
Long Non-coding RNAs in the Human Genome Acquired by Horizontal Gene Transfer
Abstract
Background:
Horizontal gene transfer of mobile genetic elements is an essential component of prokaryotic evolution. These insertion events in eukaryotes and particularly in the human genome have been investigated by various methodologies with varying results.
Objective:
In this paper, we implement a sequence composition approach to investigate insertions of genomic islands in the human genome.
Methods:
A modified version of a prokaryotic GI identifier, SeqWord Gene Island Sniffer v.2.0, was used to predict genomic islands in the hg38 version of the human genome.
Results:
Predicted genomic islands were enriched with long non-coding RNAs and also contributed to the acquisition and modification of proteins associated with the immune system and gonad development, albeit to a lesser extent. The estimated rate of acquisition of these genomic islands in vertebrate genomes was non-linear with regards to species divergence times with an acceleration at the time of vertebrate land invasion and during the transition of prosimians to monkeys soon after the Cretaceous-Paleogene extinction.
Conclusion:
The rapid acquisition of non-conserved long non-coding RNAs in the human genome and probably in vertebrata genomes was facilitated by horizontal gene transfer. All predicted human genomic islands and supporting information are freely accessible from http://hislands.bi.up.ac.za.
1. INTRODUCTION
Horizontal Gene Transfer (HGT) is a hallmark of prokaryote evolution and has extensively been studied [1-3]. The vehicles of these events, Mobile Genetic Elements (MGE), transfer functional genes through taxonomic borders, which promote adaptation of bacteria to new habitats and accelerate evolution [1, 4]. Insertions of foreign DNA, known as Genomic Islands (GIs), are readily identified in prokaryotes by various methods and catalogued in multiple, easily accessible platforms for further research and analysis [5-7].
Research on eukaryotic GIs and in particular human GIs are not as comprehensive. Various publications have delved into the contentious issue of HGT in the human genome with varying degrees of HGT detected [8-10]. Even less is known about the possible role that HGT could play in evolution of eukaryotes. The contribution of HGT to the diversification of microbial eukaryotes was demonstrated [11], but it remains disputable whether the acquired DNA fragments can be of any use to higher eukaryotes. One interesting consideration was proposed by Iyer et al. [12] that cell-to-cell signalling molecules could evolve by a lateral exchange from bacteria to multicellular eukaryotes. In this case, the authors suggested that these events took place during the early stages of eukaryote speciation, or possibly after the divergence of chordates from other animal phyla as the boldest hypothesis. There are several publications reporting gene exchange between higher organisms and their bacterial symbionts, for example between Drosophila ananassae and Wolbachia [13], or between eukaryotic chromosomes and genomes of organelles that may be exemplified by multiple inserts of mitochondrial DNA in the nuclear human genome [14]. The latter events are important for tracing down the paths of human evolution from apes and human migrations, but the functional aspect of these events is rather controversial.
As less than 2% of human genomic DNA is ultimately translated into proteins [15-17], it seems highly optimistic that any functionally annotated, large protein would have arisen due to an HGT event. It is also rather difficult to imagine the process of adaptation of acquired genes to the complex regulation of gene expression and alternative splicing in vertebrates. However, the lateral transfer of genetic material is not restricted to functional genes and may include non-coding sequences [18-20].
Historically, long non-coding RNAs (lncRNAs) were perceived as junk DNA. Recently these genetic elements spanning regions on chromosomes larger than 200 bp have been reconsidered and are currently perceived as transcriptionally and functionally important [21, 22]. The origin and location of lncRNAs in vertebrate genomes have been found to be highly influenced and driven by transposable elements due to their ability to incorporate regulatory sequences Upon chromosomal insertions with a substantial proportion of mature lncRNAs containing transposable elements [23]. Recent studies have indicated a direct involvement of lncRNAs in mammalian host cell response to bacterial infections [24-26]. LncRNAs are highly variable across genomes with rapid loss or gain occurring during the course of evolution [27, 28].
The objective of this study was to determine whether the laterally acquired fragments of DNA can play any functional and/or evolutionary role in vertebrates and particularly in human evolution. Functional genetic elements which are readily distributed by HGT are genes for regulatory RNA. An attempt was made in this work to investigate possible association of previously identified lncRNA with predicted GIs. GI prediction was performed by the program SeqWord Gene Island Sniffer (SWGIS v.2.0) [7, 29-31] A modified version of SWGIS v2.0 designed specifically for GI prediction in eukaryotic genomes has been published recently with a database of predicted eukaryotic GIs [32]. SWGIS uses a sliding window approach to exploit the variance of tetranucleotide frequencies across the genome to determine GIs based on their sequence composition. The modified version SWGIS v2.0 accounts also for a higher compositional diversity of eukaryotic chromosomes comprising long stretches of non-coding DNA and frequent repeats [32].
Only sufficiently large GIs, longer than 5 kbp, can be identified by this method. Readers should be informed that this work was not aimed at the creation of a comprehensive inventory of GIs in the human genome, but rather to identify sufficiently large horizontally acquired inserts which potentially serve as vehicles for functional genes.
The availability of predicted GIs in the human genome will enable further research in the developing and exciting field of HGT and GIs in the human evolution. All predicted GIs are freely accessible from http://hislands.bi.up.ac.za.
2. MATERIALS AND METHODS
2.1. Identification of GIs
The latest hg38 version of the human genome was inspected for the presence of GI by the SWGIS v2.0 [32]. This version is a modification of the original SWGIS algorithm, which identifies prokaryotic GIs by means of Oligonucleotide Usage Patterns (OUPs) [29-31]. SWGIS v2.0 determines a reference OUP for a sliding window of 300 kbp and then calculates OUPs for every 100 kbp step within the 8 kb long sliding windows shifting 2 kbp along the DNA sequence at every step. False-positive predictions are filtered in SWGIS v2.0 by means of BLASTN [33] against the SILVA database [34] to exclude GIs containing rRNA genes. These regions contain local OUP deviations similar to that of GIs yet are believed to be resistant to HGT [6, 35]. It should be noted that the sliding window approach allows for an estimated identification of GI containing loci and the boundaries of predicted GIs may contain flanking sequences. Analysis of the flanking regions made it possible to estimate possible associations between GI insertions and a specific genetic context of the human chromosomes, i.e. the presence of tRNA and protein coding sequences in close proximity to the predicted GIs [5].
As the abundance of repeat elements in the human genome can influence local OUPs and bias GI identification, a hard-masked version of the human genome hg38 was obtained from the UCSC Genome Browser database [16, 36]. All repeat elements were removed from each chromosome after which the SWGIS v2.0 algorithm was implemented to identify GIs in the non-redundant chromosomes. Location of the predicted GIs in the original version of the human genome was determined by BLASTN with an e-value of 1E-200. Location preference for GIs was determined by dividing a chromosome into terminal and internal regions and testing the abundance of GIs in either of these locations. Terminal regions are defined as the first and last ¼ of a chromosome and the internal region as the remaining ½ of a chromosome.
2.2. tRNA and lncRNA Content of GIs
Predicted tRNA genes for version hg38 of the human genome were acquired from GENCODE Release 26 [37]. All GIs were inspected for the inclusion of these elements within their boundaries.
Positions of lncRNAs for the version hg38 of the human genome were obtained from LNCipedia v.4.1 [38]. Identified GIs were examined for the presence of these elements, which included internal, external and partial overlaps of a lncRNA with a GI. For partial overlaps, the cut-off was set to at least 200 bp on either side of a GI.
Enrichment of these features in GIs was tested with Fisher’s exact test and p-value adjusted with Bonferroni correction. The proportion of these features in GIs were further investigated by comparing the number of features per base pair for the whole human genome to that of GIs with a 2-sample test for equality of proportions without continuity correction. All statistical analysis was done in R v3.4.2 [39].
2.3. Human GIs Displaying Regions of Pairwise Non-alignment to 38 Other Vertebrates and Their lncRNAs Content
All available precomputed pairwise alignments for the human genome (hg38) against 38 other vertebrate species were obtained in “liftover” file format from the UCSC Genome Browser database. These species included closely related hominids as well as distantly related taxa, namely: Bonobo (PanPan1), Chimpanzee (PanTro5), Gorilla (GorGor5), Orangutan (PonAbe2), Rhesus (RheMac8), Crab-eating macaque (MacFas5), Green monkey (ChlSab2), Baboon (PapAnu2), Marmoset (CalJac3), Squirrel monkey (SaiBol1), Tarsier (TarSyr2), Bushbaby (OtoGar3), Mouse lemur (MicMur2), Malayan flying lemur (GalVar1), Mouse (Mm10), Naked mole rat (HetGla2), Rat (Rn6), Rabbit (OryCun2), Sheep (OviAri3), Pig (SusScr3), Ferret (MusFur1), Dolphin (TurTru2), Chinese pangolin (ManPen1), Alpaca (VicPac2), Cat (FelCat8), Horse (EquCab2), Bison (BisBis1), Dog (CanFam3), Cow (BosTau8), Manatee (TriMan1), Opossum (MonDom5), Wallaby (MacEug2), Platypus (OrnAna2), Brown kiwi (AptMan1), Chicken (GalGal5), Golden eagle (AquChr2), Western clawed frog (XenTro7). From the pairwise alignments, DNA insertions in the human genome showing gaps in alignments larger than 1,000 bp, were identified. All GIs were inspected for the presence of lncRNAs or protein coding genes within these non-aligned regions.
In an effort to decrease false-positives and random non-alignment, only GIs with lncRNAs overlapping non-aligned regions were included as true HGT events. Further filtering of predicted lncRNA containing GIs was based on an assumption that this rare event of evolutionary importance should be absent in all the species prior to the speciation event. In other words, an insertion should not be detected in any ancestors of the species. Estimated time of species divergence and the phylogenetic tree of the 38 vertebrate organisms used in this study were obtained from TimeTree [40].
2.4. Non-aligning Regions in GIs Gene Content and Enrichment Analysis
The complete human gene set in GFF3 file format was obtained from Ensembl [41]. Locations of 21,394 complete genes in the human genome were extracted and the inclusion of these gene locations in regions of no pairwise alignment within GIs identified. This excludes 13 genes, which were found in the mitochondrial genome. If a region of no alignment was found to be larger than that of a GI, all genes located within the GI boundaries were used. Gene overrepresentation was tested using PANTER 12.0 [42] with Homo sapiens as reference and Bonferroni correction for multiple testing.
Complete genes within these regions were inspected with regards to non-aligning regions with other species to indicate the absence of these genes within certain taxa or evolutionary diverged groupings. For each gene all pairwise alignments to 38 other species were inspected to ascertain the location of a gene in a region of no alignment within or spanning a GI. This was done to determine the presence of genes within the human genome which are located in regions not presently detected in other species. Only genes not present in 10 or more pairwise alignments to different organisms were used. All sequence data, where available, for these genes were extracted from Ensembl in protein format. For those which were not available from Ensembl the sequence region in the human genome was used in nucleotide format. Sequences were compared against the NCBI nr database [43].
2.5. Identification of Possible Donors of lncRNA in GIs and Sequence Similarity Analysis
All lncRNAs located within a GI were compared against the NCBI nt database by means of BLASTN with an e-value cut-off set to 1E-30 in an effort to detect possible donors.
Regions of alignment between lncRNAs located in GIs against the best subject genera were extracted and aligned with MAFFT [44]. Sequence similarity dendrograms were inferred with IQ-TREE and 1,000 bootstraps specified [45] with the resulting trees visualized by iTOL [46].
2.6. Fitting a Logistic Function
Distribution of lncRNA inserts with regards to species divergence times was fitted to a mathematical function by using the Python module curver_fitting.py (https://github.com/aidiary/PRML/blob/master/ch1/curve_fitting.py).
3. RESULTS
3.1. Location and Distribution of GIs
Removal of repeat elements from the chromosomes reduced the size of each chromosome with an average of 55.96%. The highest reduction was observed in the Y chromosome with a decrease in size of 83.94%, while chromosome 2 contained the smallest number of repeat elements with a reduction in size of 49.56%. Size differences between chromosomes containing repeats and non-redundant chromosomes are displayed in (Fig. 1).
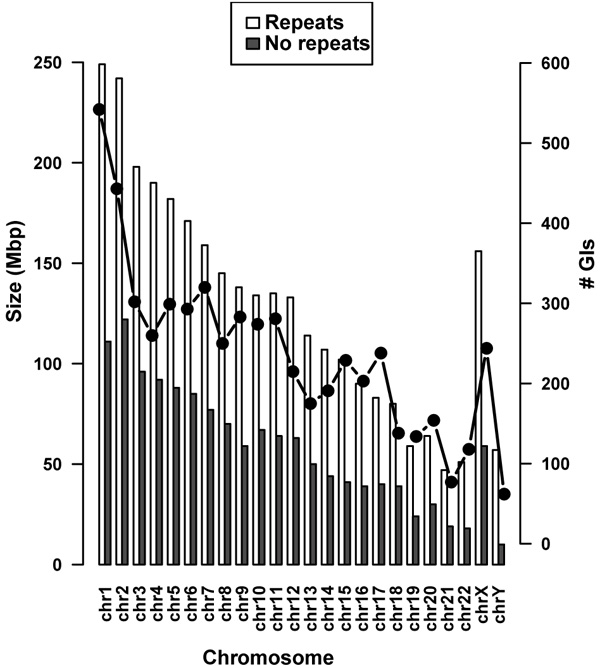
In total 5,725 GIs were predicted across 24 chromosomes relating to an average of 239 GIs per chromosome Table 1. It was found that putatively 4.1% of the original human genome or 9% after removal of repeat elements has been acquired by HGT. There was a positive correlation between the chromosome size and the number of predicted GIs compared to the initial lengths of the chromosomes and after repeat removal (Fig. 1). Pearson’s correlation coefficient was calculated as 0.9074 with a p-value = 9.553E-10. Chromosome 1 contained the highest number of predicted GIs (542) and chromosome Y had the fewest (62). No GIs were identified in the mitochondrial genome.
| Chromosome | Size before repeat removal (Mbp) | Size after repeat removal (Mbp) | Number of GIs | Combined size of GIs (Mbp) | Percentage of chromosome before repeat removal | Percentage of chromosome after repeat removal |
|---|---|---|---|---|---|---|
| 1 | 249.0 | 111.3 | 542 | 12.0 | 4.8% | 10.8% |
| 2 | 242.2 | 122.2 | 443 | 9.7 | 4.0% | 7.9% |
| 3 | 198.3 | 96.4 | 302 | 6.6 | 3.4% | 6.9% |
| 4 | 190.2 | 91.6 | 260 | 5.6 | 3.0% | 6.1% |
| 5 | 181.5 | 88.0 | 299 | 6.6 | 3.7% | 7.6% |
| 6 | 170.8 | 85.0 | 293 | 6.5 | 3.8% | 7.6% |
| 7 | 159.3 | 77.3 | 320 | 7.1 | 4.4% | 9.1% |
| 8 | 145.1 | 70.5 | 250 | 5.5 | 3.8% | 7.9% |
| 9 | 138.4 | 58.8 | 283 | 6.2 | 4.5% | 10.6% |
| 10 | 133.8 | 66.7 | 274 | 6.2 | 4.6% | 9.3% |
| 11 | 135.1 | 63.8 | 281 | 6.2 | 4.6% | 9.7% |
| 12 | 133.3 | 62.6 | 215 | 4.8 | 3.6% | 7.6% |
| 13 | 114.4 | 49.8 | 175 | 3.8 | 3.3% | 7.7% |
| 14 | 107.0 | 43.8 | 191 | 4.2 | 3.9% | 9.5% |
| 15 | 102.0 | 41.2 | 229 | 5.1 | 5.0% | 12.4% |
| 16 | 90.3 | 39.4 | 203 | 4.6 | 5.0% | 11.5% |
| 17 | 83.3 | 39.8 | 238 | 5.5 | 6.6% | 13.8% |
| 18 | 80.4 | 39.3 | 138 | 3.0 | 3.7% | 7.5% |
| 19 | 58.6 | 23.5 | 134 | 2.9 | 4.9% | 12.2% |
| 20 | 64.4 | 29.7 | 154 | 3.5 | 5.4% | 11.7% |
| 21 | 46.7 | 19.4 | 77 | 1.8 | 3.9% | 9.4% |
| 22 | 50.8 | 18.2 | 118 | 2.7 | 5.2% | 14.6% |
| X | 156.0 | 58.6 | 244 | 5.4 | 3.4% | 9.2% |
| Y | 57.2 | 9.8 | 62 | 1.4 | 2.5% | 14.5% |
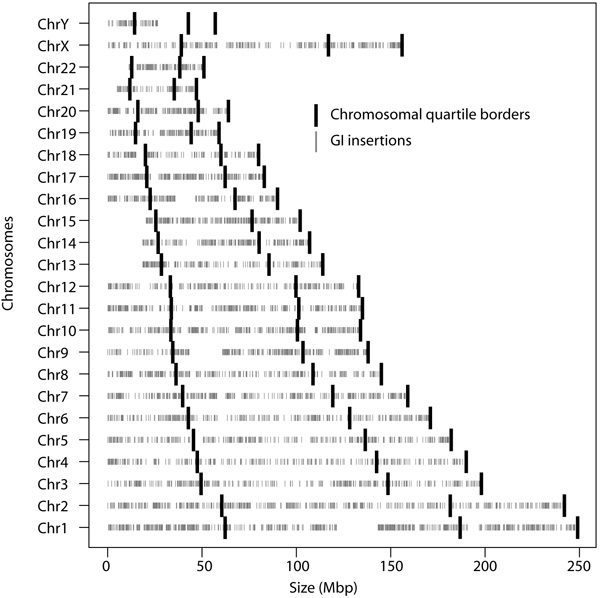
The location of all GIs was furthermore investigated in order to determine if a bias was present with regards to the chromosomal location of insertion Fig. (2). Frequency of insertions was calculated for the terminal positions, defined as the first and last quarters of a chromosome, and the internal location, the remaining region, of the chromosomes. Comparison with a Welch Two Sample t-test showed no significant locational bias for these insertions (p-value = 0.4301). In total the terminal positions contained 52.67% of the predicted GIs and with the internal position hosting 47.33%.
3.2. tRNAs in GIs
Identified GIs contained 125 tRNAs out of a possible 648 in the human genome. GIs in chromosome 1 and chromosome X displayed a high affinity for tRNAs. Chromosome Y contains only 1 tRNA, which is located in a GI (Supplementary File 1). Proportion testing for the occurrence of tRNAs per base pair in GIs were much greater than the number of tRNAs per base pair with regards to the remaining portions of the human genome after repeat removal (p-value = 1.41E-20).
3.3. Genome Specific Insertions in Predicted GIs
Alignment of 38 inspected vertebrate genomes to the human genome revealed unaligned gaps in predicted GIs. It was found that 5,108 GIs or 89.22% of all predicted GIs contained regions of no alignment located within or spanning the GI boundaries. Of these, 2 GIs, located on the terminal position of the X (155,978,495 – 156,028,276) and Y (57,153,461 – 57,214,796) chromosome respectively, contained regions of no alignment to all the 38 other species and thus represent human specific GIs. The number of GIs containing unaligned regions and the estimated divergence times are displayed in Table 2.
| Specie | Accession | Number of GIs with indels | Number of GIs containing lncRNAs overlapping indels | Number of lncRNAs overlapping indels | Number of unique lncRNA insertion events after speciation | Estimated Divergence Time from H. sapiens (MYA) |
|---|---|---|---|---|---|---|
| Chimpanzee | PanTro5 | 2 | 1 | 1 | 1 | 6.65 |
| Bonobo | PanPan1 | 5 | 1 | 1 | 0 | 6.65 |
| Gorilla | GorGor5 | 5 | 1 | 1 | 0 | 9.06 |
| Orangutan | PonAbe2 | 7 | 3 | 5 | 4 | 15.76 |
| Green Monkey | ChlSab2 | 38 | 10 | 21 | 16 | 29.44 |
| Crab-eating macaque | MacFas5 | 39 | 10 | 21 | 0 | 29.44 |
| Rhesus | RheMac8 | 46 | 13 | 24 | 3 | 29.44 |
| Baboon | PapAnu2 | 60 | 15 | 26 | 2 | 29.44 |
| Marmoset | CalJac3 | 91 | 37 | 174 | 148 | 43.2 |
| Squirrel monkey | SaiBol1 | 125 | 59 | 253 | 79 | 43.2 |
| Tarsier | TarSyr2 | 148 | 72 | 314 | 61 | 67.1 |
| Mouse lemur | MicMur2 | 151 | 73 | 326 | 12 | 74.0 |
| Bushbaby | OtoGar3 | 157 | 75 | 357 | 31 | 74.0 |
| Malayan flying lemur | GalVar1 | 158 | 75 | 361 | 4 | 76.0 |
| Mouse | Mm10 | 163 | 82 | 374 | 13 | 90.0 |
| Rat | Rn6 | 163 | 82 | 374 | 0 | 90.0 |
| Naked mole-rat | HetGla2 | 163 | 82 | 374 | 0 | 90.0 |
| Rabbit | OryCun2 | 164 | 82 | 380 | 6 | 90.0 |
| Pig | SusScr3 | 165 | 82 | 380 | 0 | 96.0 |
| Cow | BosTau8 | 166 | 84 | 381 | 1 | 96.0 |
| Bison | BisBis1 | 182 | 94 | 420 | 39 | 96.0 |
| Sheep | OviAri3 | 182 | 94 | 420 | 0 | 96.0 |
| Dolphin | TurTru2 | 185 | 95 | 430 | 10 | 96.0 |
| Alpaca | VicPac2 | 185 | 95 | 434 | 4 | 96.0 |
| Horse | EquCab2 | 185 | 96 | 438 | 4 | 96.0 |
| Dog | CanFam3 | 197 | 108 | 514 | 76 | 96.0 |
| Ferret | MusFur1 | 197 | 108 | 518 | 4 | 96.0 |
| Cat | FelCat8 | 199 | 108 | 520 | 2 | 96.0 |
| Chinese pangolin | ManPen1 | 228 | 124 | 638 | 118 | 96.0 |
| Manatee | TriMan1 | 232 | 131 | 671 | 33 | 105.0 |
| Wallaby | MacEug2 | 341 | 218 | 1,199 | 528 | 159.0 |
| Opossum | MonDom5 | 343 | 220 | 1,211 | 12 | 159.0 |
| Platypus | OrnAna2 | 678 | 445 | 2,387 | 1,176 | 177.0 |
| Chicken | GalGal5 | 765 | 509 | 2,752 | 365 | 312.0 |
| Golden eagle | AquChr2 | 840 | 567 | 2,979 | 227 | 312.0 |
| Brown kiwi | AptMan1 | 1,108 | 758 | 3,975 | 996 | 312.0 |
| X. tropicalis | XenTro7 | 2,136 | 1,497 | 7,666 | 3,691 | 352.0 |
| Zebrafish | DanRer10 | 4,076 | 3,072 | 16,024 | 8,358 | 435.0 |
3.4. Analysis of Gene Content of GIs Identified in the Human Genome
In total, 2,506 genes were located within the boundaries of the predicted GIs, but only 290 of them overlapped non-aligned genome inserts. Furthermore, only 9 complete genes were located inside an insert not found in 10 or more other species (Supplementary File 3). This indicates that the predicted GIs in the human genomes were located predominantly close to protein coding sequences but in only a few cases the HGT event contributed to acquisition of new protein coding genes or possibly individual exons. Among genes overlapping the inserts, the most enriched terms were the gonadal mesoderm development genes, elongin complex and defensins Table 3. Of the 9 completely inserted genes, 4 were heavy diversity immunoglobulins, which were located on the same GI.
| – | Number in Reference (Homo sapiens) | Number in non-aligned regions located in GIs | Expected Number | Fold Enrichment | Adjusted p-value |
|---|---|---|---|---|---|
| PANTHER Protein Class | – | – | – | – | – |
| phosphatase modulatorP | 56 | 6 | 0.47 | 12.79 | 1.85E-03 |
| phosphatase inhibitorC | 35 | 5 | 0.29 | 17.05 | 2.70E-03 |
| cell adhesion molecule | 272 | 12 | 2.28 | 5.26 | 7.89E-04 |
| GO biological process complete | – | – | – | – | – |
| gonadal mesoderm development | 8 | 5 | 0.07 | 74.58 | 8.72E-05 |
| defense respone to bacterium | 282 | 12 | 2.36 | 5.08 | 4.89E-02 |
| GO cellular component complete | – | – | – | – | – |
| elongin complex | 8 | 4 | 0.07 | 59.66 | 1.04E-03 |
| Reactome pathways | – | – | – | – | – |
| defensinsP | 43 | 8 | 0.36 | 22.20 | 7.84E-06 |
| beta defensinsC | 34 | 7 | 0.28 | 24.57 | 3.74E-05 |
3.5. Analysis of lncRNA Content of GIs
LNCipedia v.4.1 details 144,428 lncRNAs of which 26,466 were found in 4,632 GIs (80.91% of all predicted GIs). Of the 24 chromosomes, 6 indicated significant overrepresentation of lncRNAs in GIs (Supplementary file 4). Proportion testing revealed a much higher frequency of lncRNAs per base pair located in GIs when compared to the amount of lncRNAs per base pair in the remaining portions of the human genome (p-value < 0.001).
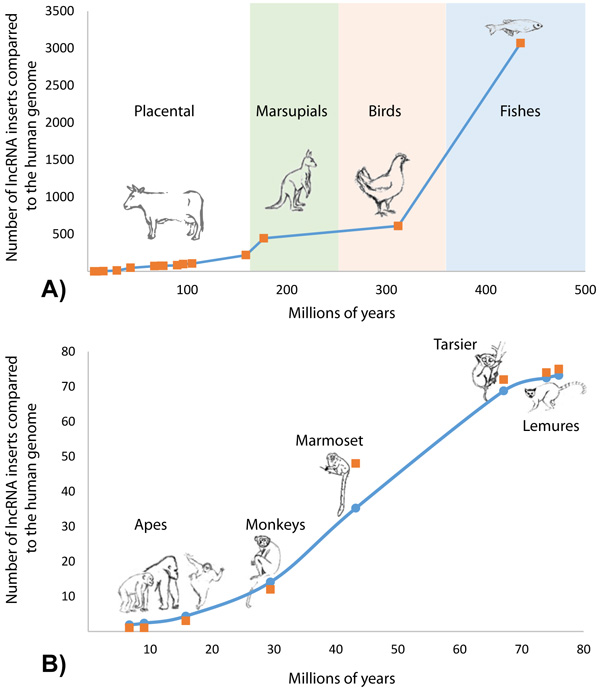
Of the 4,632 GIs containing lncRNAs, it was found that 4,281 (92.42%) GIs had lncRNAs overlapping region of no alignment (Table 2). The number of lncRNA insertion events along the divergence time of 38 vertebrate species in relation to the human genome indicated a non-linear rate of lncRNA accumulation (Fig. 3 and Supplementary File 2). The biggest number of novel lncRNAs was acquired in vertebrate genomes during the transition from an aquatic to a terrestrial lifestyle, after which the number of genomic regulatory elements stabilized in reptiles, birds and first mammalians with the next burst of lncRNA acquisition during the origination of placental mammalians (Fig. 3A).
The history of acquisition of lncRNA elements during the evolution of primates is shown in Figure 3B. Accumulation of lncRNA was in a non-linear dependence on the time of speciation of the referenced organisms. A logistic distribution (equation 1) with the parameters K = 76.9 and g = 0.096 showed the best fit with the maxima rate of HGT events taking place 40-50 million years ago which corresponds with the time period of rapid expansion of placental animals after the great Cretaceous-Paleogene extinction (Fig. 3A).
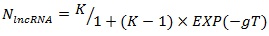 |
(1) |
where NlncRNA – expected number of acquired lncRNAs; T – time of the evolutionary split; K and g – logistic equation constants.
4. DISCUSSION
SWGIS v2.0 was optimized for GI predicting in eukaryotic genomes to alleviate the burden of horizontal transfer detection in massive genomes such as the human genome [32]. The GIs locational preference was found to be unbiased, which is in contrast with Huang et al. [9] who use an alternative approach of HGT prediction based on pairwise sequence comparison. Furthermore, it was found that GIs clustered on the chromosomes with tRNA genes. Besides encoding functional tRNA molecules, these genes are important for regulation of transcription of nearby protein coding genes and in maintenance of chromatin domain architecture by functioning as chromatin barrier elements [47]. Moreover, tRNA genes are preferable sites for integration of mobile genetic elements in prokaryotes, archaea and eukaryotes [5, 48, 49]. Thus the neighbouring position of protein and tRNA coding genes in predicted GIs may reflect both: insertion preference and better functional integration of lcnRNA into transcriptional machinery of the host organism. HGT is common in bacteria with a rather high rate of turnover of GIs by bacterial genomes. Many sequenced strains of microorganisms were characterized with a unique set of GIs shared only by the closest relatives [7]. HGT is important for fast adaptation of bacteria to new eco-niches by sourcing important enzymes from ecotype-specific bacterial consortia [50, 51]. However, many bacterial GIs were crammed with selfish plasmid and phage born genes and probably played no role in the adaptation. Foreign DNA inserts in bacterial genomes are either subjects to excision, if not functional; or they quickly gain the host specific characteristics in terms of codon usage and preferable usage of oligonucleotides in the genomic DNA amelioration process [52]. Contrary, in the higher metazoan organisms a successful HGT into germline cells is a rare event which occurs maybe once in an epoch, whilst retaining the specific oligonucleotide usage patterns for even longer periods of time indicates an absence of genome amelioration processes. At the same time, 80.91% of predicted GIs were functional as they contained lncRNAs genes. GI inserts also contributed to the evolution of protein coding genes, but to much lower extent. Only a few small genes related to the immune system functioning were acquired horizontally in the human genome. Several genes of defence against pathogens and associated with gonadal mesoderm development responsible for sexual dimorphism possibly acquired their exons through HGT.
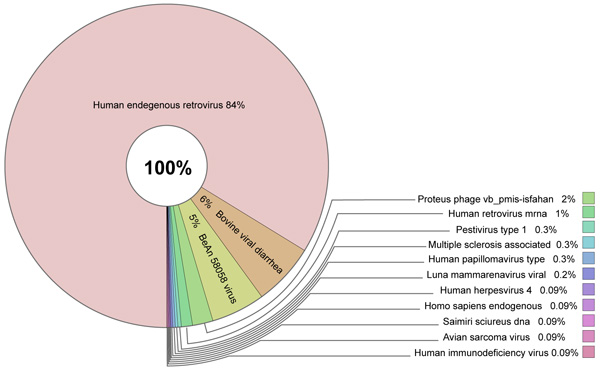
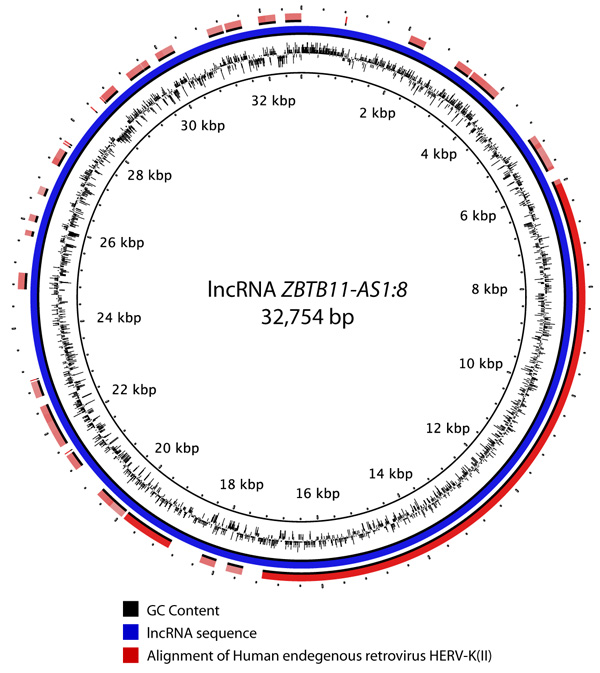
Sources of GIs and mechanisms of their acquisition by metazoan organisms remain unclear. Comparison against the NCBI nr database did not reveal any links to bacterial DNA sequences or proteins implying that bacteria were not the sources of these elements. High sequence similarities against a few bacterial proteins were identified but these were determined to be likely due to human contamination in the subject bacteria. The most plausible sources of GIs are viruses that corroborates with the latest discoveries in this field [53-56]. A total of 244 lncRNAs located in GIs were found to have sequence similarity (e-value = 1E-30) with viral hosts in the NCBI nt database. These related to 161 different viral sequences. Human endogenous retrovirus sequences were found to be the most abundant viral hits Fig. (4). For example, Fig. (5) shows an alignment of a lncRNA ZBTB11-AS1:8 located in a GI on chromosome 3 that was found to have 99.928% identity over the entire length of the Human endogenous retrovirus HERV-K(II) genome sequence (NCBI accession AB047240.1). Furthermore, this was the second best hit after an alignment to Homo sapiens 3 BAC RP11-454H13 (Roswell Park Cancer Institute Human BAC Library) complete sequence (NCBI accession: AC084198.31). Another lncRNA P3H2-AS1:7 located in a GI on chromosome 3 displayed 91.206% identity over 3,821 bp of Human endogenous retrovirus H HERV-H/env59 (clone 916F3, NCBI accession: AJ289711.1). The only other hits found were against Homo sapiens, Pan troglodytes, Pongo abelii, Gorilla gorilla and Nomascus leucogenys (data not shown).
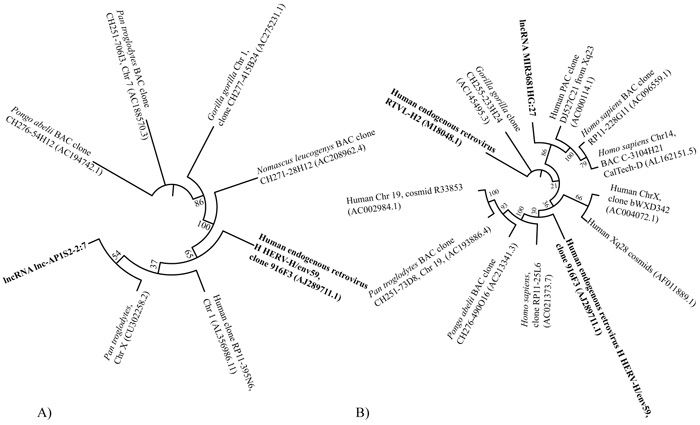
Close relations between several lncRNA inserts and Human endogenous viruses were exemplified by sequence similarity comparison. For instance, a lncRNA insert lnc-AP1S2-2:7 located in a GI on chromosome X displayed high sequence similarity (90.2% identity) with a 2,550 bp region of Human endogenous retrovirus H HERV-H/env59 (clone 916F3, AJ289711.1). Sequence similarity analysis of this region aligned to other sequences found in Homo sapiens, Pan troglodytes, Pongo abelii, Gorilla gorilla and Nomascus leucogenys is displayed as a dendrogram in Fig. (6A). Another tree was designed for sequences sharing similarity with the lncRNA MIR3681HG:27 found in a GI on chromosome 2. This insertion also displayed high sequence similarity (91.2% identity) with a 2,033 bp region of Human endogenous retrovirus H HERV-H/env59 (clone 916F3, AJ289711.1) as shown in (Fig. 6B).
While retroviral genes and sequences are common elements of repeats of the human genome, a recent study reported fossils of other prehistorical non-retroviral genomes in human chromosomes [53]. The conceptually novel perception of viruses and their role in the evolution of life was proposed by Moelling [54]. According to this theory, only a small portion of viruses are strict pathogens causing specific diseases or cancer, while the majority of viruses exist in the environment as a well-balanced ecosystem and contribute significantly to the evolution of single cell and multicellular organisms. This hypothesis was supported in a later publication by Durzyńska and Goździcka-Józefiak [55], where more details on the role of HGT as carried out by environmental viruses in the formation of tree of life were given. More specifically, the role of genomic inserts of viruses in formation of the antiviral immunity in vertebrates by HGT was reported by Villarreal [56].
It may be concluded that HGT played an important role in the formation of regulatory networks of vertebrates and particularly in human evolution. The rate of acquisition of novel lncRNA increases when organisms dramatically change their lifestyle, for example at the time of appearance of first terrestrial vertebrates; or during rapid expansion and speciation as a part of the founder effect. Acquisitions of new lncRNA are rare events yet the GIs retain their compositional specificities throughout epochs and as such may be used for timing and reconstruction of evolutionary events in eukaryotes.
The most recent possible lncRNA acquisition event with regards to the Chimpanzee genome was located in a GI on X chromosome (55,978,495 – 156,028,276). This GI (GI0530:244, chrX: 55,978,495 – 156,028,276 in hislands.bi.up.ac.za) contains 13 lncRNAs, one of which is WASIR1 (WASH and IL9R antisense RNA 1, ENSG00000185203). Gene expression was found to be the highest in human ovary samples with no known orthologues in the UCSC Genome Browser. Furthermore, it has been reported that a non-coding sequence located and within this GI on the X chromosome may be involved in the pathogenesis of X-linked calvarial hyperostosis [57]. Unfortunately, the rather high level of paralogy of lncRNA genes in the human genome prevents us from making more specific conclusions regarding the role of every individual lncRNA insert.
CONCLUSION
The importance of lncRNAs in innate and adaptive immune responses in combination with varying degrees of conservation across species may indicate a rapid evolutionary acquisition of these enigmatic regulators by means of HGT in the human genome.
LIST OF ABBREVIATIONS
| GIs: | Genomic Islands |
| HGT: | Horizontal Gene Transfer |
| lncRNAs: | Long non-coding RNAs |
| MGE: | Mobile Genetic Elements |
| OUPs: | Oligonucleotide Usage Patterns |
| SWGIS: | SeqWord Gene Island Sniffer |
ETHICS APPROVAL AND CONSENT TO PARTICIPATE
Not applicable.
HUMAN AND ANIMAL RIGHTS
No animals/humans were used for studies that are the basis of this research.
CONSENT FOR PUBLICATION
Not applicable.
AVAILABILITY OF DATA AND MATERIALS
All predicted human GIs and supporting information are freely accessible from http://hislands.bi.up.ac.za.
CONFLICT OF INTEREST
The authors declare no conflict of interests.
FUNDING
This work was supported by the National Research Foundation (NRF) grant 105996.
AUTHORS ’ CONTRIBUTIONS
RP, FJC and ONR conceived and designed the study. RP and ONR performed the analysis. RP, FJC, OKIB and ONR interpreted the results and wrote the manuscript. All authors read and approved the manuscript.
ACKNOWLEDGEMENTS
The authors wish to thank Mr. Xiaoyu Yu from the Centre for Bioinformatics and Computational Biology (University of Pretoria) for his help with curve fitting.
SUPPLEMENTARY MATERIAL
Supplementary material is available on the publishers Website along with the published article.

