
Clinical Model to the Analysis of Synergy Pattern Changes of Back Muscles and its Relationship with the Occurrence of Fatigue
Abstract
Background:
Right sitting not only leads to flatness of the lumbar spine and waistline, it also causes other problems for health. The curved body pushes into lungs and breathing will be problematic.
Purpose:
The main purpose of this study was investigating changing procedure of lumber muscles patterns and its relationship with the occurrence of fatigue.
Methods:
Participants were ten male with average age 24 ± 1. Firstly, the process of fatigue during sitting was observed by mid-frequency index. For performing the necessary analysis, the 10-second window of time was used. The 15 minutes of time trial was divided into 3 sub-terms. Each sub-term was investigated separately. The sub-terms contain: The beginning of record until the 90th second, from the 90th second to the 600th second and from the 600th second to the 900th second.
Results:
Results showed that in each subject there were synergy patterns in both of the first and the second sub-terms. Maximum error between basis vectors in all of the subjects were 0.87 and 0.79 respectively and standard deviations were 5 and 10 respectively (Mean square error index). In some participants, there were not any synergy patterns in the third sub-term (minimum error between basis vectors in all of the subjects was 18 and standard deviation was 7.5) while in other participants, their muscles still followed special synergy patterns (maximum error between basis vectors in all of the subjects was 0.98 standard deviation was 7.5).
Conclusions:
Comparing the synergy patterns between different participants has determined that the synergy patterns were the same only in the first sub-term.
1. INTRODUCTION
Muscle fatigue is a result of continuous contraction of muscles which leads to a decrease in production or keeping power [1]. Suitable neuromuscular control of lumbar spine can prevent spinal disorders [2]. The best sitting mode is still unclear, but in general lumbar lordosis should be avoided [3]. So in this study the best sitting mode is when the lordosis is similar to that of standing position [4]. There is a complex network of muscles in the lumbar spine consisting of nearly 70 muscles of variable size. The main tasks of these muscles are load distribution, load transfer and control of movement [5]. Females are more resistant to fatigue due to some effective factors including: muscle mass, substrate utilization, muscle morphology, and neuromuscular activation patterns [6]. Many factors of fatigue are effective in the electromyogram signal such as: amplitude and frequency spectrum shift [7]. Mechanical movements can be used to reduce fatigue [6]. Despite reduction in median frequency (MDF) change is not observed in sustained contractions; this is due to recruitment of additional motor units by lumber muscles to compensate the force loss according to “size principle” [8]. The suppressive factor of permanent sitting is muscle fatigue and it is possible to determine that by recorded sEMG signals [8]. Since the lower back muscles fatigue is associated with sitting mechanism, previous studies investigated the different mechanism of sitting, different kinds of chairs and their relationship to lumbar pain [3-9].
The difference between the interaction patterns of lumbar muscles in patients and healthy subjects can be used to classify neuromuscular control impairments associated with low back pain [10]. Females and males move their lumbar spine with different modes for doing the same performance [9]. So this study only investigated males and tried to reach a clear answer to this question: what is the effect of fatigue on lumber muscles patterns?
These days, how body of human can organize its muscles to perform certain task like gait, is one of major issues for researchers [11].
Muscles synergy patterns were extracted from EMG by using Non-Negative Matrix Factorization [12, 13] and HALS algorithm [14] during daily activities.
2. MATERIALS AND METHODS
2.1. Participants
Participants were ten male with average age 24 ± 1. All of them were healthy without sickness. These participants almost have equal body mass in lumber. Informed consent of the participants was obtained.
2.2. Synergy
Muscle synergy is a coherent local and temporal activity from a set of muscles which are in relation with each other in order to sustain a special performance. Synergy includes two types of synchronous (constant Synergy and variable coefficients) and Asynchronous (variable synergy and constant coefficients) [14]. Synergy pattern can be used for functional electrical stimulus [15]. Every muscle performance will be divided into linear vectors. At each moment, the sum of these vectors with specific coefficients reconstruct electromyogram signal.
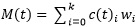 |
(1) |
M represents the time-varying muscle activation pattern of involved muscles. wi is the ith dimensional basis vector. c(t)i is the scalar activation coefficient for the ith basis vector. There are different methods to extract muscles synergy patterns such as: Non-Negative Matrix Factorization and HALS algorithm [14].
2.3. HALS Algorithm (Hierarchical Algorithm Least Square)
In this algorithm, there are some local cost functions. The cost functions are minimized consecutively based on the optimality conditions. HALS algorithm can be described in five stages.
- Initializing a randomity
-
Estimating X from the matrix equation
By solving

(2) Where Y is the known input data matrix A is an unknown Basis matrix with non-negative vectors X is a matrix representing unknown non-negative components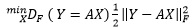
(3) - Setting all negative elements of X to zero or a small positive value.
-
Estimating A from the matrix equation XXTA = YTX
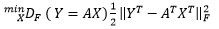
(4) - Setting all negative elements of A to zero or a small positive value ε.
Y is a constructed signal with different rows and columns. There are several methods to reduce the number of rows and columns from matrix Y. One way is selecting the first or second row or column or averages of them. Another approach is to cluster all rows and columns [14-17].
2.4. Median Frequency
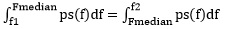
The median frequency is the frequency value that separates the power spectrum into two parts of equal energy;
 |
(5) |
Where PS(f) is the sEMG power spectrum that is calculated using Fourier transform, and f1 and f2 determine the bandwidth of the surface electromyography (f1 = lowest frequency and f2 = highest frequency of the bandwidth) [7].
2.5. Extraction of the Synergy Pattern
In the first step, raw sEMG signals were band pass filtered (10–500 Hz), in the second step sEMG signals were rectified. In the third step signals were normalized to be in the range between zero and one. Finally, the signal was filtered by the low pass filter (with cut off frequency 20 Hz).
2.6. Equipment
In this work Flexcomop recording device (this device can eliminate 50Hz noise with notch filter) was used. Data recorded with 3 Channels, sampling rate of 2048 bits per second by Biograph Infiniti Software. sEMG was recorded in the Laboratory of Neuromuscular Control Azad University, Mashhad branch.
2.7. Protocol
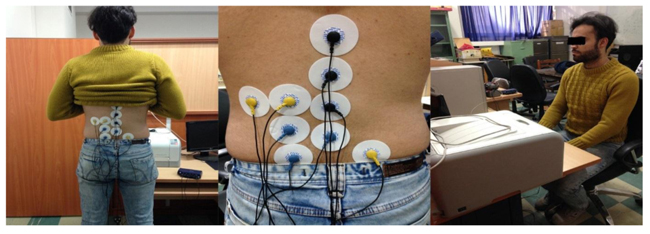
EMG data were collected from 3 muscles of the spinal erectors including: Longissimus, Iliocostalis and Multifidus. 9 Ag/Agcl surface electrodes of 10 diameter were used to record sEMG (skin tact). At the first step, the spinal skin was cleaned with alcohol for better connections. Subjects who did not have prior fatigue were asked to sit on an office chair calmly. The back of chair was set in the 90 degrees and feet of subjects were on the ground entirely. A similar text was selected for all participants and put in the same place at an adequate distance from subjects. Participants typed the text for 15 minutes and signal was recorded from mentioned muscles. Fig. (1) indicates placement of electrodes and position of the trial.
3. RESULT
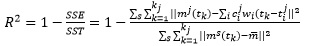
R2 criteria were used to assess the number synergy. R2 represents the fraction of total variation accounted for by the synergy reconstruction. R2 is obtained as follows:
 |
(6) |
Where SST is the sum of the squared residuals, and SSE is the sum of the squared residual from the mean activation vector ( ). In this study, four Synergies were selected for leg muscles, because after four synergies R2 is constant [14, 18].
Fig. (2) shows changes versus the number of synergies.
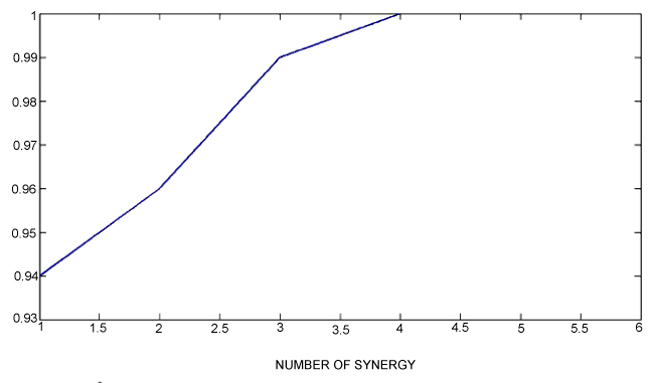
Maximum error between reconstruction signals of the original signals in all of subjects is 7.2 exp-10.
In the next step, 10 second intervals in the sEMG signal were selected. (in the previous works one phase of special movement were selected like grasping but in this study we did not have define interval. One of purpose of this study was to design spesefic sensor in order to measure level of fatigue in lumber muscle of people, so we need a real time computation. In addition, the accuracy of our approach is important. More number of contraction not only have more accuracy but also takes more time, therefore we should consider both of them. We excuted 50,100 and 200 contractions as one interval respectively. Average error of 50,100 and 200 contractions were 5.8 exp-17, 6.1 exp-12 and 2.7 exp-3 respectively, as you see accuracy of 50 and 100 were closed to each other, so we selected 100 contractions as a interval which is Equal 10 seconds because of less computation.)
In each interval, the basis vectors and activation coefficients were estimated using HALS algorithm. The basis vectors in each interval were compared element to element with other intervals and errors were calculated. 15 minute test time was divided into the three sub-terms according to the results of investigation. The basis vectors investigated in each sub-term separately. The three sub-terms contained the beginning of record until the 90th second, from the 90th second to the 600th second, from the 600th second to the 900th second. In Table 1 due to low errors, only maximum errors were listed. (Standard deviation are 5, 10 and 7.5 for three sub-term respectively) In the third sub-term lumber muscles of some of subject did not follow specific patterns (sign with --).
| Subject | Maximum Error in First Sub-term | Maximum Error in Second Sub-term | Maximum Error in Third Sub-term |
|---|---|---|---|
| 1 | 0.34 | 0.41 | -- |
| 2 | 0.85 | 0.74 | -- |
| 3 | 0.75 | 0.79 | 0.98 |
| 4 | 0.87 | 0.62 | 0.79 |
| 5 | 0.24 | 0.18 | 0.18 |
| 6 | 0.52 | 0.44 | -- |
| 7 | 0.77 | 0.53 | 0.51 |
| 8 | 0.14 | 0.1 | 0.1 |
| 9 | 0.36 | 0.8 | -- |
| 10 | 0.24 | 0.37 | 0.69 |
According to the table, subjects experienced three levels of fatigue in this trial. To measure the similarity between the basis vectors of each sub-term in different subjects, these basis vectors in each interval were compared element to element and errors were calculated. Tables (2, 3 and 4) demonstrate the maximum error of different subjects in sub-terms 1 to 3 respectively.
| Subject | 1 | 2 | 3 | 4 | 5 | 6 | 7 | 8 | 9 | 10 |
|---|---|---|---|---|---|---|---|---|---|---|
| 1 | 0 | 0.52 | 0.34 | 0.12 | 0.41 | 0.23 | 0.16 | 0.43 | 0.32 | 0.05 |
| 2 | 0.52 | 0 | 0.43 | 0.51 | 0.39 | 0.14 | 0.66 | 0.37 | 0.25 | 0.38 |
| 3 | 0.34 | 0.43 | 0 | 0.26 | 0.45 | 0.15 | 0.51 | 0.17 | 0.41 | 0.11 |
| 4 | 0.12 | 0.51 | 0.26 | 0 | 0.19 | 0.13 | 0.32 | 0.65 | 0.24 | 0.15 |
| 5 | 0.41 | 0.39 | 0.45 | 0.19 | 0 | 0.76 | 0.38 | 0.48 | 0.03 | 0.16 |
| 6 | 0.23 | 0.14 | 0.15 | 0.13 | 0.76 | 0 | 0.65 | 0.61 | 0.14 | 0.17 |
| 7 | 0.16 | 0.66 | 0.51 | 0.32 | 0.38 | 0.65 | 0 | 0.25 | 0.13 | 0.32 |
| 8 | 0.43 | 0.37 | 0.17 | 0.65 | 0.48 | 0.61 | 0.25 | 0 | 0.22 | 0.12 |
| 9 | 0.32 | 0.25 | 0.41 | 0.24 | 0.03 | 0.14 | 0.13 | 0.22 | 0 | 0.04 |
| 10 | 0.05 | 0.38 | 0.11 | 0.15 | 0.16 | 0.17 | 0.32 | 0.12 | 0.04 | 0 |
| Subject | 1 | 2 | 3 | 4 | 5 | 6 | 7 | 8 | 9 | 10 |
|---|---|---|---|---|---|---|---|---|---|---|
| 1 | 0 | 7.47 | 10.58 | 9.45 | 6.37 | 10.05 | 7.26 | 9.53 | 4.62 | 5.96 |
| 2 | 7.47 | 0 | 9.17 | 7.25 | 6.27 | 5.58 | 7.28 | 10.43 | 5.71 | 4.73 |
| 3 | 10.58 | 9.17 | 0 | 13.97 | 12.58 | 3.94 | 4.08 | 7.78 | 12.44 | 10.48 |
| 4 | 9.45 | 7.25 | 13.97 | 0 | 9.15 | 8.16 | 14.94 | 3.54 | 9.64 | 2.96 |
| 5 | 6.37 | 6.27 | 12.58 | 9.15 | 0 | 4.37 | 11.73 | 6.74 | 4.45 | 3.74 |
| 6 | 10.05 | 5.58 | 3.94 | 8.16 | 4.37 | 0 | 4.13 | 14.64 | 6.51 | 11.69 |
| 7 | 7.26 | 7.28 | 4.08 | 14.94 | 11.73 | 4.13 | 0 | 12.77 | 6.93 | 6.72 |
| 8 | 9.53 | 10.43 | 7.78 | 3.54 | 6.74 | 14.64 | 12.77 | 0 | 13.69 | 7.34 |
| 9 | 4.62 | 5.71 | 12.44 | 9.64 | 4.45 | 6.51 | 6.93 | 13.69 | 0 | 4.25 |
| 10 | 5.96 | 4.73 | 10.48 | 2.96 | 3.74 | 11.69 | 6.72 | 7.34 | 4.25 | 0 |
| Subject | 1 | 2 | 3 | 4 | 5 | 6 | 7 | 8 | 9 | 10 |
|---|---|---|---|---|---|---|---|---|---|---|
| 1 | 0 | -- | -- | -- | -- | -- | -- | -- | -- | -- |
| 2 | -- | 0 | -- | -- | -- | -- | -- | -- | -- | -- |
| 3 | -- | -- | 0 | 11.31 | 7.51 | -- | 11.93 | 10.26 | -- | 5.51 |
| 4 | -- | -- | 11.31 | 0 | 10.72 | -- | 5.38 | 7.93 | -- | 10.29 |
| 5 | -- | -- | 7.51 | 10.72 | 0 | -- | 10.18 | 3.38 | -- | 8.84 |
| 6 | -- | -- | -- | -- | -- | 0 | -- | -- | -- | -- |
| 7 | -- | -- | 11.93 | 5.38 | 10.18 | -- | 0 | 5.72 | -- | 9.84 |
| 8 | -- | -- | 10.26 | 7.93 | 3.38 | -- | 5.72 | 0 | -- | 4.51 |
| 9 | -- | -- | -- | -- | -- | -- | -- | -- | 0 | -- |
| 10 | -- | -- | 5.51 | 10.29 | 8.84 | -- | 9.84 | 4.51 | -- | 0 |
Median frequency was used to prove fatigue in all the time of trial. Median frequency for Iliocostalis and Multifidus muscles in the first sub-term was between 175 and 165 HZ, in the second sub-term was between 165 and 155 HZ and in third one was 155 and 150 HZ. Median frequency for longissimus muscle in the first sub-term was between 165 and 155 HZ, in the second sub-term was between 155 and 145 HZ and in third one was 145 and 140 HZ.
Table 5 shows the level of activity of 3 involved muscles in sitting corresponding to each synergy pattern.
| Synergy | Multifidus | Iliocostalis | Longissimus |
|---|---|---|---|
| w1 | 5 | 0.08 | 0.1 |
| w2 | 0.1 | 0.06 | 2.59 |
| w3 | 0.36 | 1.42 | 0.1 |
| w4 | 0.95 | 0.65 | 0.42 |
sEMG threshold (0.1 of the maximum amplitude of sEMG) was used to estimation percentage of activity of each muscle.
Percentage of activity of Multifidus, Iliocostalis, longissimus muscles were 80%, 20% and 20% respectively and coaction was 13%.
4. DISCUSSION
Synergy models not only describe functions of the controller, but also provide organization and convey it to the output of a system. The main purpose of this study was investigating changing procedure of lumber muscles patterns and its relationship with the occurrence of fatigue. Firstly, the basis vectors and activation coefficients were extracted using HALS algorithm. The reconstructed signals were compared with the respective original signals to ensure the accuracy of the analysis. Slight differences proved the accuracy of the analysis based on MSE. In the first sub-term maximum error and standard deviation were 0.87 and 5, respectively. In the second sub-term maximum error and standard deviation were 0.79 and 10, respectively and in the third sub-term among subjects whose muscles still were following particular patterns, maximum error and standard deviation were 0.98 and 7.5, respectively. The basis vectors from each subject for each sub-term in different intervals were compared and the results showed that there were certainly synergy patterns in each subject in the first and the second sub-terms because the maximum errors in first and second sub-terms ratio to the standard deviation were low (Table 1). Similarly, it was proven that muscles of some subjects had experienced particular synergy patterns in third sub-term. The basis vectors between all the subjects were compared which determined that there were only similar synergy patterns in first sub-term.
One of the fundamental principles of dynamic system is self-organization. That is to say, when a system of individual parts come together, its elements behave collectively in an ordered way. This system can reach coordinated action needless of higher center issuing instructions. Combination between this principle and motor control theory predicts that movement could emerge as a result of interacting elements, with no need of specific commands or motor programs within nervous system. Another feature of dynamic system is nonlinear behavior. That is, when the system parameter, gradually altered, reaches a critical value, behavior of which changes completely in a moment. This parameter is called control parameter. In this study control parameter was fatigue that according to the observations in 90th and 600th seconds, fatigue reached critical value; subsequently muscles patterns suddenly changed and followed a new one [19].
Reflexes are part of a hierarchy of motor control. Furthermore, it is asserted by hierarchical theory of motor control that motor control emerges from reflexes that are nested within hierarchically organized levels of CNS. According to this theory in the third sub-term lumber muscles of some subjects did not have particular synergy patterns and their reaction controlled by the central nervous system is an immediate response to their muscles condition. Whereas, in the sub-term lumber muscles of other subject had particular synergy patterns. This can be due to learning in the brain that is formed by previous placement in the similar circumstances. One good illustration of this is habituation which is used in many different ways in the clinical setting [19].
The difference in the percentage of muscle activity influenced the coefficients matrix and did not have much impact on synergy matrices.
Up to now, no research has used synergy patterns to detect lumber muscles fatigue. Related studies similar to our work are very restricted in which other factors were considered; the effect of sex and low back pain status were demonstrated with the use of an optoelectronic system by Lariviere et al [6]. Ringheim et al used Median frequency (MDF), amplitude (RMS) and the Rating of Perceived Exertion (RPE) as fatigue indices to investigate the relation between variability in muscle activity and fatigue during a sustained low level contraction in the lumbar muscles [8].
Each synergy expressed a specific balance in the activation of mentioned muscles, so this work can provide evidence for a relationship between variability in muscle activity and fatigue. For expanding this issue in this paper, fatigue was investigated by using changes procedure of synergy patterns and revealed different levels of muscles fatigue.
Applying electrical stimulation externally leads to nerve stimulating pulses generated on the wall of nerve fibers. Generated through nerve fibers, stimulating pulses move towards motor units and contracts the muscles [20]. As well as previous studies have demonstrated that the Central Nervous System (CNS) makes use of muscle synergies as a neural strategy to simplify the control of a variety of movements by using a single pattern of neural command signal [16]. So extracted synergy patterns of this study can be used in rehabilitation [15] and diagnosis [10]. Whether the source of pain in lumber is muscles or not can be determined easily by comparing muscles patterns of healthy subjects with patients who had pain in the lumber [10].
The results of this work is practical because the data processing algorithm is fast with high accuracy because HALS algorithm is robust to noisy data and every iteration in the generated responses program, they are converge to a single value [17].
CONCLUSION
Results showed that fatigue in subjects is divided into different levels. Synergy patterns of lumber muscles change in each level of fatigue. Similar synergy patterns only were observed among different subjects in first sub-term that fatigue does not exist. In second sub-term lumber muscles of each subject have exclusive synergy patterns. In third sub-term lumber muscles of some of subject do not have particular synergy patterns, but lumber muscles of other subjects have particular synergy patterns. In the future, researchers can use the results of this study to design a sensor for measurement of fatigue in the sitting mode when people are typing. In addition, researcher can extract synergy patterns of lumber muscles of subjects who have chronic pain in these muscles. By comparing synergy patterns of different group of people, source of pain can be identify in new patients. Due to the fact that, in pervious study it is proven, individuals with CLBP seem to be more sensitive to certain effects of back muscle fatigue and Individuals with CLBP trigger a subtly different activation pattern to control the spine.
ETHICS APPROVAL AND CONSENT TO PARTICIPATE
This study was supported by the Islamic Azad University, Mashhad branch.
HUMAN AND ANIMAL RIGHTS
All research procedures followed were in accordance with the ethical standards of the committee responsible for human experimentation (institutional and national), and with the Helsinki Declaration of 1975, as revised in 2008 (http://www.wma.net/en/20activities/10ethics/10helsinki/).
CONSENT FOR PUBLICATION
Informed consent of the participants was obtained.
CONFLICTS OF INTEREST
The authors declare no conflict of interest, financial or otherwise.
ACKNOWLEDGEMENTS
Declared none.

