
A Simple Genetic Algorithm for Optimizing Multiple Sequence Alignment on the Spread of the SARS Epidemic
Abstract
Background:
Multiple sequence alignment is a method of getting genomic relationships between 3 sequences or more. In multiple alignments, there are 3 mutation network analyses, namely topological network system, mutation region network and network system of mutation mode. In general, the three analyses show stable and unstable regions that map mutation regions. This area of mutation is described further in a phylogenetic tree which simultaneously illustrates the path of the spread of an epidemic, the Severe Acute Respiratory Syndrome (SARS) epidemic. The process of spreading the SARS viruses, in this case, is described as the process of phylogenetic tree formation, and as a novelty of this research, multiple alignments in the process are analyzed in detail and then optimized with genetic algorithms.
Methods:
The data used to form the phylogenetic tree for the spread of the SARS epidemic are 14 DNA sequences which are then optimized by using genetic algorithms. The phylogenetic tree is constructed by using the neighbor-joining algorithm with a distance matrix that the intended distance is the genetic distance obtained from sequence alignment by using the Needleman Wunsch Algorithm.
Results & Conclusion:
The results of the analysis obtained 3649 stable areas and 19 unstable areas. The results of phylogenetic tree from the network system analysis indicated that the spread of the SARS epidemic extended from Guangzhou 16/12/02 to Zhongshan 27/12/02, then spread simultaneously to Guangzhou 18/02/03 and Guangzhou hospital. After that, the virus reached Metropole, Zhongshan, Hongkong, Singapore, Taiwan, Hong kong, and Hanoi which then continued to Guangzhou 01/01/03 and Toronto at once. The results of the mutation region network system demonstrate decomposition of orthogonal mutations in the 1st order arc.
1. INTRODUCTION
The genetic algorithm is a searching and optimizing technique, which works by imitating the process of evolution and the genetic structure of living things. Sequence Alignment by Genetic Algorithm (SAGA) software tool is a software package that is also built on the genetic algorithm strategy, which appears to have the capability of finding comprehensively optimal or close-to-optimal multiple alignments in reasonable time [1]. However, such kind of practices of 22 operators by SAGA’s Genetic Algorithm were observed to be too obscure, and the level of complexity could be reduced. From that background, the multiple alignment of the epidemic, spread the pattern of Severe Acute Respiratory Syndrome (SARS) in the Arabian Peninsula, a case example in this research; which will eventually be developed by optimization with genetic algorithms. The multiple alignment applied a progressive alignment to generate phylogenetic trees delineating spread of the SARS epidemic, as well as a network topology and a network orthogonal decomposition of some used data. All the three analyses apply to multiple alignments, and in the following stage, add optimization of Genetic Algorithm (GA) simulated in matlab, which are expected to give more optimal results. The data used in this research are taken from www.ncbi.nlm.nih.gov, a world GenBank database owned by National Center for Biotechnology Information (NCBI) of USA.
2. REVIEW OF RELATED LITERATURE
2.1. Progressive Alignment
Progressive alignment method is a heuristic algorithm that generates a multiple alignment based on a number of pairwise alignments. The general scheme of the method is: two sequences (Sequence 1 and Sequence 2) are aligned, then the third sequence is chosen and aligned with the first sequence. Thus, the process continues until all the sequences are aligned [2].
CLUSTALW [3] is a very popular multiple sequence alignment program. It employs a progressive alignment method which assessed by a biologist to analyze the same spreading virus case. The alignment processes are 1) an alignment sequence performed by using dynamic programming, and 2) scores of pairwise alignment are used to form the matrix of distance genetic distance, while phylogenetic trees are used to form the neighbor-joining method [4]. 3) A dynamic programming is utilized to highlight the nearest distance sequence alignment from the tree.
2.2. Needleman Wunsch Algorithm
Needleman Wunsch is a global alignment algorithm to pairwise alignment [5]. The steps in this algorithm are as follows. If there are sequences A=(a1,a2,...,an) and B = (b1,b2,...,bm), then the table of the two sequences is included in Table 1 with s (i, j) obtained from the next step.
For element s(i,j) can be calculated using the following formula:
s(i,j)ijs(ai,bj)sijdsijdThen, the obtained alignments of these sequences are described as follows:
- Denoting the pair of the sequence as, if the groove pullback starts from ai, bi to the top left corner.
- Inserting a virtual symbol of the sequence of vertical and denote as (ai,-), if grooves pullback horizontally.
- Inserting a virtual symbol of the sequence of horizontal and denote as (-,bi), if grooves pullback vertically.
- Finally, obtaining an optimal alignment from the two sequences.
2.3. Multiple Alignment (MA) and Analysis of Mutation Network
Among various tree topologies generated by the MA, the outputs are a graph and tree used to indicate the relationship between the mutation and evolution. Let M={1,2,....,m} be the subscript set of a MA output C, that is, i ϵ M corresponds to a sequence Ci Then, graphs G={M,V and G'={M',V'} are the extension of {M,V} which is similar to that as has been given by phylogenetic tree T'={M',V'}. The network systems generated by the MA output are as follows [5]:
- Topological network system generated by MA output: G(W)={M,V,W}, where W is penalty function of the output MA (A') defined by W=(Ws,t) by A'.
- Mutation region network system: G(Δ)={M,V,Δ} where Δ is the mutation region function of the MA. The mutation region representing stable and unstable region.
- Network system of mutation mode generated by multiple alignment output: G(H) = {M,V,H} where H is the modular function of the MA.
2.4. Penalty Matrix
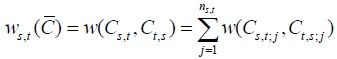
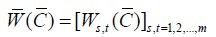
Penalty matrix is defined [5], for example, C is alignment matrix induced by multiple sequence A. For any s,t ϵ M penalty function W= w(a,b) stated on Vs would be obtained from two expansions Cs,t and Ct,s based on pairwise sequence As and At. For pairwise Cs,t and Ct,s the penalty score is defined as follows:
 |
(1) |
Where matrix
 |
(2) |
is a matrix of penalties produced by pairwise alignment from multiple sequence A and shortened as a penalty matrix.
2.5. Distance Method
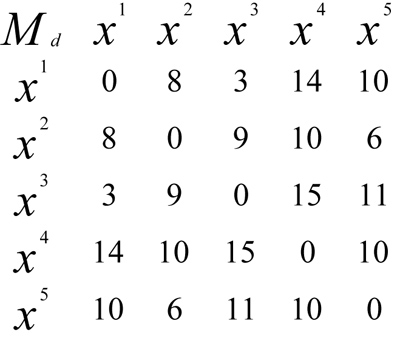
One of the methods to construct a tree from a collection of distances among each pair of sequence alignment is called Distance Method. This set of distances is shown in a matrix form, named matrix of distance [5]. Example:
Fig. (1) shows a distance matrix for 5 sequences, i.e. Operational Taxonomy Units (OTUs), which are a set of sequences {x1, x2, x3, x4, x5} representing five different virus species. Each element of the matrix represents the genetic distance between the sequences involved. For example, the distance between OTU x2 and x3 is 9, meaning that there are 9 genetic differences between the x2 and x3 sequences. This difference occurs because of the evolutionary process within its genetic structure, or the difference in the number of genes due to evolution.
| – | – | a1 | a2 | – | an |
| – | s(0,0) | s(1,0) | s(2,0) | – | s(n,0) |
| b1 | s(0,1) | s(1,1) | s(2,1) | – | s(n,1) |
| – | – | – | – | – | – |
| bm | s(0,m) | s(1,m) | s(2,m) | – | s(n,m) |
2.6. Phylogenetic Tree
The phylogenetic or evolutionary tree is a “tree” that shows the evolutionary relationships between different species of living things based on their similarities and physical and/or genetic characteristics. The taxa are derived from a common ancestor [6].
The phylogenetic tree in this SARS case is used to find out the pattern of epidemic spread based on the locations and dates of sampling in the NCBI.
2.7. Neighbor-Joining Algorithm
One of the distance based methods used to construct phylogenetic trees is the Neighbor-Joining method [7]. This algorithm requires the input of a distance matrix, where distance represents the dissimilarity of the aligned sequences.
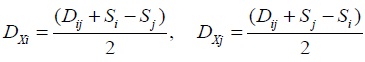
The Neighbor Joining method starts from a star like structure as in Fig. (2a) and gathers all the “neighbors” together to form a tree without roots as output. For the set of N sequences, the computational steps are given as follows:
 |
- Finding the N sequence distance matrix.
- The shape of the star-like pattern as in Fig. (2a) and assume each OTU as a fork.
- For each OTU, compute S, where S is the sum of distance (D) between OTU one with another OTU, divided (N- 2), where N is the total number of OTUs.
- Identifying OTU pair with minimum value:
- Combining two taxa on a node into a sub-tree
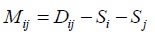
- Calculating branch length:
- Calculating the new matrix distance by connecting i and j and replace it with the node (x) that connects it
- Repeating the above steps until (N-2) !
2.8. Genetic Algorithm
Genetic algorithms are classified in several forms such as the Simple Genetic Algorithm. The mechanism of simple genetic algorithms is by copying strings and partially exchanging them. This algorithm gives good results in many practical problems consisting of three operations, namely: 1) reproduction, 2) Cross over and, 3) Mutations [8].
The general steps of the common Genetic Algorithm can be figured out by the following pseudo-code [9]:
- Initialization: a display of a beginning of population
- Evaluation: assessing individuals by using a fitness function
- Selecting individuals (parents)
- Applying the genetic operators in order to create offspring
- New generation: creating new generation from some combination of old generation and new offspring generations
- Go to 2 until it meets the fixed criteria
- End.
2.9. Fitness Function and Objective Function
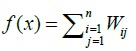
Genetic algorithm measures how well a chromosome can solve a problem. The measurements are made by using the fitness function, which is the purpose function of the problem to be solved. The greater the fitness value is, the more chromosome in the population, the more likely it is to survive the next generation. The objective function used in the genetic algorithm for multiple sequence alignment follows a scoring scheme called Sum of Pairs [10]:
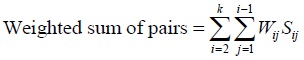 |
(3) |
Where Wij = weight/distance sequences i and j
Sij = score between sequences i and j
2.10. Chromosome Selection
The selection is one operation to ensure the amount of upcoming chromosome generation which is gained from the fitness value compared to the average fitness value of population. It then defines the number of representatives of a chromosome received in the next generation. Afterwards, chromosomes with excellent fitness values will have a greater chance of being elected parent and remains to the next generation, while worse chromosomes will be substituted by new chromosomes. One of the techniques of selection in genetic algorithms is the technique of roulette wheel selection introduced by [11]. This selection technique is illustrated as a roulette disc playback technique. The size of the slot is equal to the ratio between the fitness value of a chromosome to the total fitness value of all chromosomes. To produce a population, the roulette is rotated as much as the size of the population [8].
2.11. Operators in Genetic Algorithms
A child's chromosome can be formed by two main processes; first is by combining elements between two parent chromosomes using a crossover operator, and secondly by modifying a parent chromosome using a mutation operator. The explanation is as follows:
a. Crossover
Crossover is the primary operator or primary operator in the genetic algorithm. These operators work on a pair of parent chromosomes to produce two child chromosomes by exchanging some of the elements (genes) that each of the parent chromosomes possess.
b. Mutation
Mutations are secondary operators or support operators in genetic algorithms that play a role in altering the chromosome structure unexpectedly. This unexpected change leads to the formation of a mutant, a new chromosome that is genetically distinctive from the preceding chromosome.
3. ANALYSIS AND DISCUSSION
The data used in this study were 14 DNA sequences of patients infected with the SARS virus with the genbank access code AY278489, AY394997, AY395004, AY394978, AY394983, AY304495, AY278554, AY278741, AY274119, AY283794, AY291451, AY345986, AY394999 and AY627048. Six of them have been analyzed in paper [12], but in this paper 14 DNA sequences were analyzed along with optimization with genetic algorithms. After analyzing multiple alignment of the 14 DNA of human diseases with the SARS virus, the results obtained by the analysis of the network system topology, network systems area mutation, and network system mode mutations in detail are described as follows:
3.1. Analysis of Network System Topology
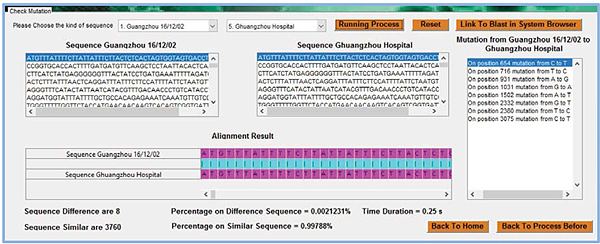
System network topology is produced by the result Multiple alignment, namely G(W)={M,V,W} where W is a function penalty of outcome Multiple alignment where pairwise alignment uses Needleman Wunsch algorithm simulated in Matlab as shown in the user menu interface Fig. (3).
From the alignment as displayed in Fig. (3), a penalty matrix can be derived as follows:
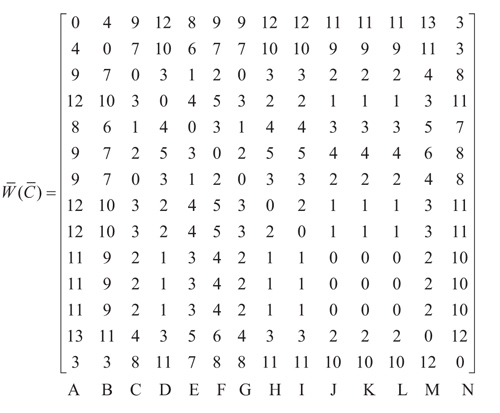
where A, B, C, D, E, F, G, H, I, J, K, L, and N represent the sequences in particular cities and dates respectively as follows Guangzhou, December 16th 2002; Zhongshan, December 26th 2002; Zhongshan, Jan 4th 2003; Guangzhou, Jan 24th 2003; Guangzhou Hospital; Guangzhou Feb 2nd 2003; Metropole, Feb 21st 2003; Hanoi, Feb 26th 2003; Toronto, Feb 27th 2003; Singapore, March 1st 2003; Taiwan, March 8th 2003; Hongkong, March 19th 2003; Hongkong, May 15th 2003, and Palm civet. Palm Civet is a ferret that was allegedly as host of the SARS epidemic [4]. SARS viruses were isolated from Himalayan palm civets found in a live-animal market in Guangdong, China. Evidence of virus infection was also detected in humans working at the same market. Palm civet sequence is raised from that patients [13]. Network system topology analysis gains a stable area [12] telling similar nucleotide locus in multiple alignment, and unstable area capturing dissimilar nucleotide locus. The unstable area among sequences here is then well-known as mutation. Stable and unstable regions in the multiple alignment of SARS epidemic can be seen in Table 2.
In Table 2, there are 19 positions that seem unstable regions, with a percentage of 0.5%. It is clear that all the studied SARS DNA sequences have a very high similarity. The number of mutated nucleotides in each sequence is shown in detail in the Table 3.
| Nucleotide Postion | Amount | Percentage | |
|---|---|---|---|
| Stable Region | 1-80, 82-145, ……….....3624-3768 |
3749 | 99,5 % |
| Unstable Region | 81,146,224,230,654,716, 731,931,1026,1031,1502, 1729,2332,2380,3075, 3381,3487,3505,3623 |
19 | 0,5% |
| Sequence Length | 3768 | 100 % |
| No. | Position of Nucleotide | Amount of Nucleotide | ||||
|---|---|---|---|---|---|---|
| A | C | G | T | - | ||
| 1 | 81 | 0 | 0 | 1 | 13 | 0 |
| 2 | 146 | 0 | 13 | 0 | 1 | 0 |
| 3 | 224 | 0 | 13 | 1 | 0 | 0 |
| 4 | 230 | 7 | 0 | 7 | 0 | 0 |
| 5 | 654 | 0 | 2 | 0 | 12 | 0 |
| 6 | 716 | 0 | 11 | 0 | 3 | 0 |
| 7 | 731 | 0 | 7 | 0 | 7 | 0 |
| 8 | 931 | 3 | 0 | 11 | 0 | 0 |
| 9 | 1026 | 10 | 0 | 4 | 0 | 0 |
| 10 | 1031 | 11 | 0 | 3 | 0 | 0 |
| 11 | 1502 | 1 | 0 | 0 | 13 | 0 |
| 12 | 1729 | 0 | 0 | 1 | 13 | 0 |
| 13 | 2332 | 0 | 0 | 4 | 10 | 0 |
| 14 | 2380 | 0 | 13 | 0 | 1 | 0 |
| 15 | 3075 | 0 | 3 | 0 | 11 | 0 |
| 16 | 3381 | 0 | 1 | 0 | 13 | 0 |
| 17 | 3487 | 13 | 0 | 1 | 0 | 0 |
| 18 | 3505 | 13 | 0 | 1 | 0 | 0 |
| 19 | 3623 | 0 | 13 | 0 | 1 | 0 |
3.2. Analysis of the Mutation Network System
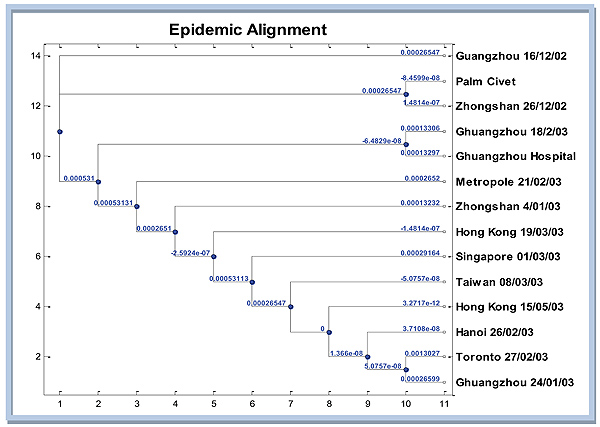
The next analysis is mutation network system on multiple alignments of the SARS epidemic. In this section, the outline is how to construct a graph and tree produced by the SARS epidemic. The graph in Fig. (4) displays the phylogenetic tree that tells the SARS epidemic spread in particular regions. Distance matrix which is then converted into evolutionary distance matrix is used as the input for phylogenetic tree construction. Distance matrix obtained from dissimilarities nucleotide between pairs of sequences in multiple alignments. Furthermore, convert dissimilarity into evolutionary distance by correcting for multiple events per site with jukes cantor model [14]. Here are the results of the simulation Matlab phylogenetic tree using neighbor-joining algorithm with Jukes Cantor distance correction.
In Fig. (4), it appears that the closest sequence to Palm Civet as host [4] is Zhongshan 26/12/02. However, if the attention is not much on genetic distance from Guangzhou 12/16/02, then it could be reasonably inferred that the extent of the SARS epidemic of Guangzhou 16/12/02, then spread to Zhongshan 26/12/02, then almost simultaneously to Guangzhou 02/18/03 and Guangzhou hospital. From there, the virus continued to spread to the Metropole, Zhongshan, Hongkong, Singapore, Taiwan, Hongkong, Hanoi, Guangzhou 24/01/03 and Toronto simultaneously.
3.3. Analysis of Network System of Mutation Mode
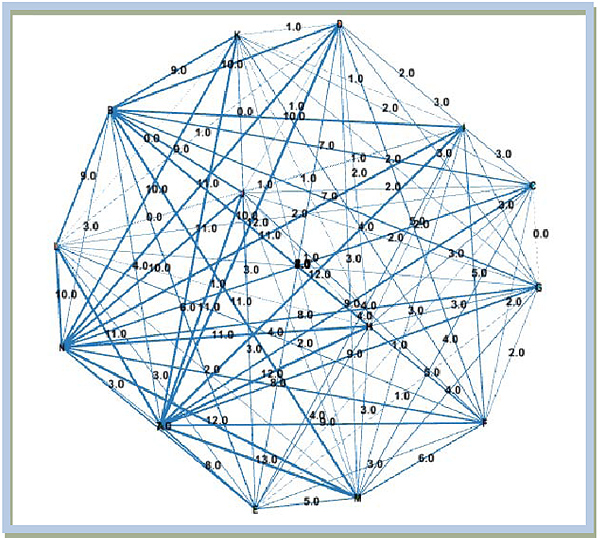
Before explaining analysis of network system of mutations mode, from the penalty matrix, a non-directional graph can be visualized showing the relationship between sequence mutations. The notation on the node indicates the name of the encoded sequence as the letters A,B,...,N with the codes representing names of particular regions as mentioned before.
The number of mutations can be shown in Fig. (5). The thicker the lines, the more the mutation occurred. As mentioned, 19 mutations appeared in unstable regions on 14 different DNA sequences of this SARS epidemic. As shown in Fig. (5), some mutations occur only in the arc orthogonal order to-1, for example in ΔABE, ΔABF, ΔABD, ΔAFD, ΔBFD Mode mutation HAE (a mutation in the sequence Guangzhou, Dec 16th 2002 to Toronto, March 27th 2003), mode mutations HAB (mutations in the sequence Guangzhou, Dec 16th 2002 to sequence Guangzhou Hospital), as well as the mode of mutation HBE (a mutation in the sequence Guangzhou Hospital to sequence Toronto, March 27th 2003).
In ΔABE effect:  and structure modulus HAE, HAB, HBE mutually orthogonal.
3.4. Optimizing by Genetic Algorithm
Genetic algorithm approach for multiple alignment in the case of the SARS epidemic is defined below:
3.4.1. Population
Initial population is a penalty matrix of multiple alignment result of Needleman Wunsch alignment with the use of progressive alignment. Because all the data used have the same sequence length 3768bp, so the multiple alignment outcome has no gap at all.
3.4.2. Objective Function
The objective function used in this case is the score of the weight of the matrix MA Wunsch Needleman results. Objective function:
 |
3.4.3. Fitness Value
Fitness value is the value of the objective function:
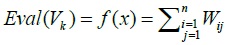 |
Because of the spread of the SARS epidemic, the shortest distance showed the closest kinship, in the sense most closely with the host, then the fitness value is taken from the most minimal value.
3.4.4. Selection
Selection procedures used an approach of Roulette wheel. One chromosome was selected to produce a new population, and a number r was generated at random from the range [0,1], and the roulette disc was played 14 times.
3.4.5. Outcrossing (Crossover)
At this crossing process, the sequence is broken down into several parts. Separation is assumed for each multiple of 500, so for a long sequence of 3768bp there are 8 part-solving sequences. Meanwhile the cross-linking process is done randomly but the benchmark crossing probability (Pc) is set to be 0.25. It means that with the values is expected to average 25% of chromosomes in the population will experience a crossing.
3.4.6. Mutation
Mutation probability (Pm) value is set to be 0.01. This means that it is expected on average 1% of the total number of bits in the population will mutate.
In this case of 3768×14 = 52752 when it is multiplied by 0.01, this means that there are 528 mutations in a single generation.
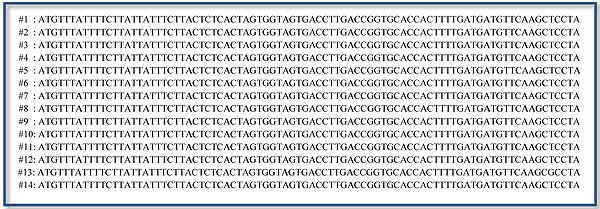
3.4.6.1. Initial Population
The initial population is the Multiple Alignment with Needleman Wunsch algorithm as shown previously.
The program results are displayed in the command window in matlab. The 14 sequences in the initial population have a very high similarity as seen in Fig. (6).
3.4.6.2. The Result of Fitness Value
Before the fitness value is calculated, the weight of MA is calculated from the penalty matrix. From the weight matrix, the score of each sequence is calculated. Retrieved:
Eval(v_1) = 124 ; Eval(v_6) = 64; Eval(v_11) = 46
Eval(v_2) = 102 ; Eval(v_7) = 46; Eval(v_12) = 46
Eval(v_3) = 46 ; Eval(v_8) = 58; Eval(v_13) = 70
Eval(v_4) = 58 ; Eval(v_9) = 58; Eval(v_14) = 112
Eval(v_5) = 52 ; Eval(v_10) = 46
From the above values, the strongest chromosome is the chromosome with the value closest to v_14 (palm civet, host of this SARS epidemic), ie chromosome v_1. And the weakest chromosome is the chromosome with the smallest values, i.e., which are v_7, v_10, v_11, and v_12.
| No. | 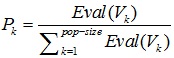 |
 |
|---|---|---|
| 1 | 0,1336 | 0,1336 |
| 2 | 0,1099 | 0,2435 |
| 3 | 0,0496 | 0,2931 |
| 4 | 0,0625 | 0,3556 |
| 5 | 0,0560 | 0,4116 |
| 6 | 0,0690 | 0,4806 |
| 7 | 0,0496 | 0,5302 |
| 8 | 0,0625 | 0,5927 |
| 9 | 0,0625 | 0,6552 |
| 10 | 0,0496 | 0,7047 |
| 11 | 0,0496 | 0,7543 |
| 12 | 0,0496 | 0,8039 |
| 13 | 0,0754 | 0,8793 |
| 14 | 0,1207 | 1,000 |
3.4.6.3. The Result of the Selection
For the 1st generation of the result process, a selection roulette wheel disc is obtained as in Table 4.
Then the disc is rotated 14 times randomly in the range [0,1], and a random value is assumed to be the value of r at each time of rotation as
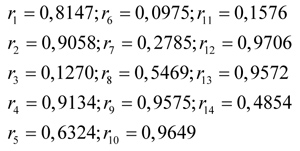
Finally, after the selection is completed, a new population (potential parental chromosomes) is generated, consisting of chromosomes from sequences 1, 2, 3, 7, 8, 9, 13, and sequence 14.
3.4.6.4. The Result of Crossover
In this crossover process, a sequence will be broken at any multiple of 500. The probability of crossing is set as 0.25 and based on the random generation in the range [0,1], sequence 2 and sequence 8 are selected to be crossed. So the sequence is broken at the positions of 500, 1000, 1500, and so on.
3.4.6.5. The Result of Mutation
The mutation process will replace one or more genes with an opportunity equal to the mutation probability. A mutation refers to the change of one nucleotide to another nucleotide. After the crossover process on sequences 2 and sequence 8, the final population in the 1st generation had mutations in the sequences 5, 8, 12, and 14 as in Table 5. The number of mutations in the respective sequences is detailed as follows:
Thus the process repeats over and over again until a plot of fitness values gets close to a constant.
3.4.6.6. Plots of Fitness Value Results
The results of iterations are performed until the 10th generation because for a higher number of generations, the system is not yet supportive. The last values obtained in the 10th iteration are shown as in Table 6.
So the plot of fitness values for the 10th generations based on the obtained results can be shown in the Fig. (7).
Fig. (7) appears that the result is still far from convergent so it needs to be iterated again until the result is near constant.
| Mutation Position | Seq. 5 | Seq. 8 | Seq. 12 | Seq. 14 |
| Amount of mutation |
13 | 37 | 25 | 26 |
| V1 | V2 | V3 | V4 | V5 | V6 | V7 |
| 1569 | 2100 | 2221 | 1669 | 1895 | 1438 | 2138 |
| V1 | ||||||
| V8 | V9 | V10 | V11 | V12 | V13 | V14 |
| 1360 | 1324 | 1952 | 1623 | 1443 | 1656 | 1726 |
CONCLUSION
Based on the results of this study, some conclusions can be obtained as follows:
- From the analysis of multiple alignment of the multiple sequences in forming a phylogenetic tree delineating the spreading epidemic of SARS by distance method, 19 unstable regions of 3768bp were obtained. In the unstable regions, there are mutations for a number of different nucleotides. The regions are in positions 81, 146, 224, 230, 654, 716, 731, 931, 1026, 1031, 1502, 1729, 2332, 2380, 3075, 3381, 3487, 3505, and 3625.
- Mutation network analysis noted that SARS epidemic worldwide extended from Guangzhou, Dec 16th 2002 to Zhongshan, ten days afterwards, then almost simultaneously to Guangzhou, Feb 18th 2003 and Guangzhou hospital. From there the virus continued to spread to Metropole, Zhongshan, Hongkong, Singapore, Taiwan, Hongkong, Hanoi, Guangzhou Jan 24th 2003 and Toronto all at once.
- Only a few orthogonal mutations order-1 were formed based on the network system of mutation mode analysis.
- The use of genetic algorithm in multiple alignments in case of the spreading epidemic SARS appears to be less optimal, because without using the approach of genetic algorithm, a phylogenetic tree can be formed faster than with usage of GA, which takes longer time.
ETHICS APPROVAL AND CONSENT TO PARTICIPATE
Not applicable.
HUMAN AND ANIMAL RIGHTS
No animals/humans were used for studies that are the basis of this research.
CONSENT FOR PUBLICATION
Not applicable.
CONFLICT OF INTEREST
The authors decalre that there is no conflict of interest, financial or otherwise.
ACKNOWLEDGEMENTS
This research is the outcome of a cooperation research among universities in 2017 were financed by Directorate of Research and Community Service, Directorate General for Research and Development, Ministry of Research, Technology and Higher Education (Kemenristekdikti) number 101/ SP2H/PPM/ DRPM/IV/2017, April 3rd 2017.

