Bacterial DNA Diversity among Clear and Cloudy Sakes, and Sake-kasu
Abstract
Background:
The traditional Japanese alcoholic drink, sake, is classified into two types: those that contain sediment produced during the production process (cloudy sakes) and those that do not contain such sediment (clear sakes). Leftover pressed sediment from the sake production process, sake-kasu (sake cake or sake lees), is commercially available and is highly nutritious for humans.
Objective:
The purpose of this study was to determine the difference among component bacterial DNA sequences of clear and cloudy sakes, and sake-kasu.
Methods:
We compared the 16S rDNA sequences from 44 samples of clear sake, 3 samples of cloudy sake, and 11 samples of sake-kasu.
Results:
The DNA sequences were divided into three major clusters; however, sequences in sake-kasu were located in just one cluster forming two lineages. The microbial diversity in sake-kasu was lower than that in clear and cloudy sakes, which may be because some of the contaminating bacterial cells do not lyse during the production process and remain intact, along with yeast cells, in sake-kasu.
Conclusion:
Bacterial DNA frequently detected in sake samples was from environmental bacterial contamination that occurs early in the sake production process. Contaminating bacteria are usually killed by the ethanol produced as the sake yeast grows; after which, if bacteria lyse, the bacterial DNA is released into the sake solution. However, if the bacterial cells do not lyse, they will precipitate toward the sediment. Thus, there is bacterial DNA diversity in clear and cloudy sake, but less diversity in sake-kasu.
1. INTRODUCTION
Koji, moto, rice, and water are needed for sake production and no bacteria are added. However, a diverse range of bacterial DNA sequences were detected in sake samples previously [1-6]. This indicates that bacterial contamination occurs during sake production. The fungus, Aspergillus oryzae (Aspergillus flavus subsp. flavus var. oryzae), produces koji, which converts rice starch into sugars [7, 8]. The ethanol fermentation starter, moto, is produced using koji and the sake yeast, Saccharomyces cerevisiae, which converts sugars to ethanol [9]. There are no reports about bacterial ethanol fermentation during sake production.
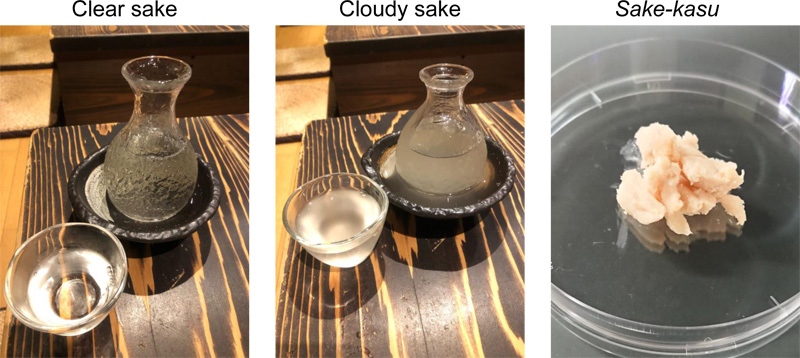
While all sakes are filtered, clear sake is completely filtered, while cloudy sake is not. Thus, the cloudy sake contains sediments produced during the sake production process. After the filtered sediments are pressed, sake-kasu is produced. Clear sake, cloudy sake, and sake-kasu are shown in Fig. (1). Many cloudy types of sakes effervesce when opened, indicating fermentation by the yeast occurred. Effervescence is not seen in clear sakes. Hiire (pasteurization) is usually performed once before storage and once before bottling for sterilization. On the other hand, cloudy sake is not pasteurized. We examined bacterial DNA in different sake samples during the sake production process [3, 4, 6]. Bacterial contamination mostly occurs during koji and moto production [6]. At the genus level, Acinetobacter, Bacillus, and Staphylococcus DNA were frequently detected during the koji production process, while DNA from Lactobacillus, Leuconostoc, Pseudomonas, Sphingomonas, Thiobacillus, and Vibrio bacteria was frequently detected during the moto production process [1, 3]. The lactic acid bacterial DNA is detected more frequently in sake, using yamahai-moto than sokujyo-moto [4].
In this study, we compared the bacterial DNA diversities of 11 samples of sake-kasu, 44 samples of clear sake, and 3 samples of cloudy sake.
2. MATERIALS AND METHODS
2.1. Sake Samples
We compared the 16S rDNA sequences from 44 samples of clear sake, 3 samples of cloudy sake, and 11 samples of sake-kasu from different 33 breweries in different 13 prefectures (Table 1).
2.2. DNA Isolation and Purification
DNA was isolated and purified from clear and cloudy sakes according to the protocol used in previous studies [3, 4]. The isolated DNA was concentrated using Amicon Ultra 15 Centrifugal Filter Units (Merck Millipore, Darmstadt) or Nanosep 10K ultrafiltration unit (PALL, Port Washington). DNA was purified using the NucleoSpin gDNA Clean-up kit (Macherey–Nagel, Duren). Samples of sake-kasu were crushed using Multi-beads Shocker (Yasui Kikai, Osaka, Japan) (3,000 rpm, 10 cycles: 60 s ON and 60 s OFF). After the samples were crushed, 60 μL of C1 solution (150 mM NaCl, 4% SDS, 0.5 M Tris) was added and the samples were centrifuged at 10,000 x g for 10 min. Subsequently, 250 μL of the supernatant and C2 solution (133 mM ammonium acetate) were mixed. The mixture was incubated at 4˚C for 10 min and then centrifuged at 10,000 x g for 5 min. The supernatant and 200 μL of C3 solution (120 mM ammonium aluminum sulfate dodecahydrate) were mixed. The mixture was incubated at 4˚C for 10 min, and then centrifuged at 10,000 x g for 5 min. Thereafter, 800 μL of C4 solution (5 M GuHCL, 30 mM Tris, 9% isopropanol) was added per 500 μL of the supernatant. The mixture was passed through a FastGene Plasmid Mini Kit mP Column (Nippon Genetics, Tokyo, Japan), followed by the addition of 700 μL of solution C5 (10 mM Tris, 100 mM NaCl, 50% EtOH), centrifugation at 10,000 x g for 2 min, and washing three times. Finally, DNA was eluted using 100 μL of TE buffer (10 mM Tris, 0.1 mM EDTA, pH 8.0).

| Sample | Type | Pasturization Times | Brewery | Reference |
|---|---|---|---|---|
| A01 | clear sake | 2 | Toyama 1 | This study |
| A01+ | clear sake | 2 | Toyama 1 | This study |
| A02 | clear sake | 0 | Toyama 1 | This study |
| A03 | clear sake | 1 | Toyama 1 | This study |
| A04 | clear sake | 1 | Toyama 1 | [3] |
| A05 | clear sake | 2 | Toyama 1 | This study |
| A06 | clear sake | 2 | Toyama 1 | [3] |
| A07 | clear sake | 0 | Toyama 1 | [3] |
| A08 | clear sake | 2 | Toyama 1 | [3] |
| A09 | clear sake | 2 | Toyama 1 | [3] |
| A10 | cloudy sake | 0 | Toyama 1 | [3] |
| A11 | clear sake | 2 | Toyama 1 | [3] |
| B01 | clear sake | 2 | Toyama 2 | [3] |
| C01 | clear sake | 0 | Toyama 3 | [3, 4] |
| D01 | clear sake | 2 | Aichi 1 | [3] |
| E01 | clear sake | 2 | Iwate 1 | [3] |
| F01 | clear sake | 2 | Akita 1 | [3] |
| F1 | sake-kasu | - | Iwate 1 | This study |
| F2 | sake-kasu | - | Akita 2 | This study |
| F3 | sake-kasu | - | Tottori 1 | This study |
| F4 | sake-kasu | - | Toyama 1 | This study |
| F5 | sake-kasu | - | Ishikawa 1 | This study |
| F6 | sake-kasu | - | Akita 3 | This study |
| F7 | sake-kasu | - | Mie 1 | This study |
| F8 | sake-kasu | - | Akita 4 | This study |
| F9 | sake-kasu | - | Nara 1 | This study |
| F10 | sake-kasu | - | Nara 2 | This study |
| F11 | sake-kasu | - | Toyama 4 | This study |
| G01 | clear sake | 2 | Gifu 1 | [3] |
| H01 | clear sake | unknown | Fukui 1 | This study |
| I01 | clear sake | 2 | Ishikawa 2 | [3, 4] |
| J01 | clear sake | 2 | Iwate 2 | [3] |
| K01 | clear sake | 2 | Iwate 3 | [3] |
| L01 | clear sake | 2 | Iwate 4 | [3] |
| M1 | cloudy sake | 0 | Toyama 1 | This study |
| M2 | clear sake | 2 | Nara 2 | This study |
| M3 | clear sake | 2 | Aomori 1 | This study |
| M4 | clear sake | 2 | Aichi 2 | This study |
| M5 | clear sake | 2 | Kyoto 1 | This study |
| M6 | clear sake | 2 | Kyoto 2 | This study |
| M7 | clear sake | 2 | Aomori 2 | This study |
| M8 | clear sake | 2 | Aichi 3 | This study |
| M9 | clear sake | 0 | Iwate 5 | This study |
| M10 | clear sake | 2 | Ishikawa 5 | This study |
| M11 | clear sake | 2 | Kyoto 3 | This study |
| M12 | clear sake | 2 | Ishikawa 3 | This study |
| M13 | clear sake | 2 | Nara 3 | This study |
| M14 | clear sake | 0 | Yamanashi 1 | This study |
| M15 | clear sake | 2 | Yamanashi 1 | This study |
| M16 | clear sake | 2 | Ishikawa 4 | This study |
| M18 | clear sake | 2 | Toyama 1 | This study |
| M19 | clear sake | 2 | Ishikawa 2 | [4] |
| M20 | clear sake | 0 | Toyama 3 | [4] |
| M21 | cloudy sake | 0 | Toyama 1 | This study |
| M22 | clear sake | 0 | Iwate 1 | This study |
| M23 | clear sake | 0 | Iwate 1 | This study |
| M24 | clear sake | 2 | Iwate 1 | This study |
| M25 | clear sake | 2 | Iwate 1 | This study |
| Name | Component | Concentration |
|---|---|---|
| LB | tryptone | 10 g/L |
| NaCl | 10 g/L | |
| yeast extract | 5 g/L | |
| MB | peptone | 5 g/L |
| yeast extract | 1 g/L | |
| ferric citrate | 0.1 g/L | |
| NaCl | 19.45 g/L | |
| MgCl2 | 5.9 g/L | |
| MgSO4 | 3.24 g/L | |
| CaCl2 | 1.8 g/L | |
| KCl | 0.55 g/L | |
| NaHCO3 | 0.16 g/L | |
| KBr | 0.08 g/L | |
| SrCl2 | 0.034 g/L | |
| H3BO3 | 0.022 g/L | |
| Na2HPO4 | 0.008 g/L | |
| Na2SiO3 | 0.004 g/L | |
| NaF | 0.0024 g/L | |
| NH4NO3 | 0.0016 g/L | |
| TGY | tryptone | 5 g/L |
| yeast extract | 3 g/L | |
| glucose | 1 g/L |
2.3. Bacterial Isolation From Hatsuzoe
Bacterial isolation was performed from 6 different Hatsuzoe (the first mixture of koji and moto) samples of Brewery Toyama 1. Three different media (Table 2) containing 25 µg/mL cycloheximide were used for the isolation. Each Hatsuzoe sample (30 µL) was added to each medium (20 mL) and cultured at 15 °C and 30 °C for 72 h. After that, a single colony was chosen .
2.4. Massively Parallel DNA Sequencing
V3 and V4 regions of the 16S rRNA gene from each DNA fraction were amplified by PCR and DNA sequencing performed according to a previous study [3, 4].
2.5. Analysis of Bacterial DNA Sequence Components
Using the protocol developed in a previous study, sequencing data were analyzed using QIIME (Quantitative Insights into Microbial Ecology, version 1.9.0) [10]. The resultant sequence was analyzed by length (from 400 to 500 bp) using the statistical software R (http://www.R-project.org/) with the Biostrings package [11]. Next, chimera sequences were removed using QIIME with the Greengenes reference database (http://greengenes.lbl.gov/, v13.8), and the “non_chimeras_retention” parameter set as “intersection”. OTU-picking and alpha-diversity calculations were then performed against the 16S rRNA genes database (Greengenes database, version 13.8). The resultant sequences were subjected to BLASTn search (version 2.9.0+) and alignment against the 16S Microbial NCBI database as installed on June 9th, 2019.
2.6. Cluster Analysis
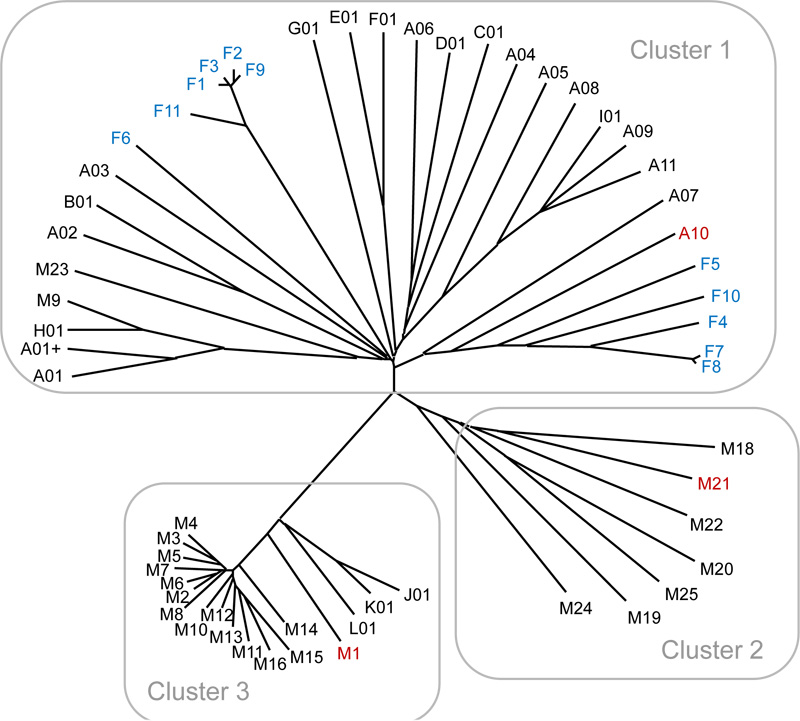
Based on the results from the analysis of the bacterial DNA, sequence frequencies were obtained (Suppl. Table 1). Each frequency vector consisted of 1,611 elements. Each vector was converted into a unit vector. The Euclidean distance between different two vectors (samples) among 58 vectors was calculated using the statistical software R (http:// www.R-project.org/ ). On the basis of the distance matrix, a neighbor-joining tree was constructed using the MEGA software [12].
3. RESULTS AND DISCUSSION
A total of 1,611 bacterial DNA sequences were obtained in the 58 samples. Based on the result, we rearranged the bacterial DNA sequences at the genus level. The DNA sequences of less than 1% are summarized as others in (Suppl. Table 2). As a result, 168 bacterial genera were identified (Suppl. Table 2).
Bacterial DNA sequence components were grouped into three major clusters (Fig. 2). Cluster 1 is the largest, consisting of 33 samples (22 samples of clear sake, 11 samples of sake-kasu, and 1 sample of cloudy sake), while cluster 2 consisted of 6 samples of clear sake and 1 sample of cloudy sake, and cluster 3 of 17 samples of clear sake and 1 sample of cloudy sake. Although the samples of clear and cloudy sakes were distributed into three different clusters, the samples of sake-kasu were distributed into just one cluster with two different lineages (Fig. 2). The microbial sequences in sake-kasu and cloudy sake were not separate from that of clear sake, indicating that no bacteria are specific to sake-kasu or cloudy sake.

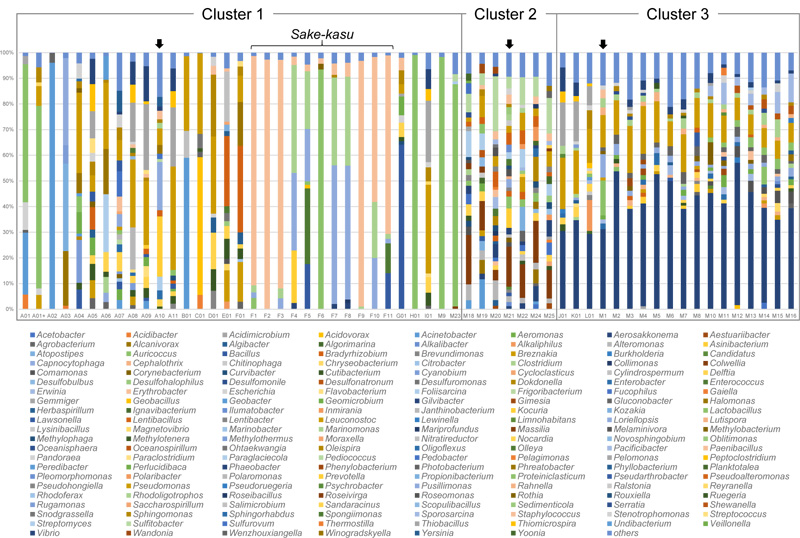
The most frequently detected bacterial genus in this study was Pseudomonas, detected in 40 out of the total 58 samples, and in a range of between 1.7% of sample M18 and 40.3% of sample A11 (Suppl. Table 2), (Fig. 3). However, Pseudomonas was not detected in any of the 11 sake-kasu samples (Suppl. Table 2). Pseudomonas has been detected in various environments [13]. Delftia, Loriellopsis, and Rhodoligotrophos were also frequently detected (Suppl. Table 2). Although Delftia was detected in 28 samples, and in a range of 1.0% of sample M10 and 14.3% of sample D01, it was not detected in the sake-kasu samples (Suppl. Table 2), Fig. (3). However, Loriellopsis and Rhodoligotrophos were both detected in the sake-kasu samples, with detection rates exceeding 20% in the sake-kasu samples F4, F5, F7, F8, and F10 (Suppl. Table 2). Loriellopsis and Rhodoligotrophos were isolated from low-temperature environments (below 20 ˚C) [14, 15]. Although a wide range of bacteria were detected in sake and sake-kasu, this was from bacteria usually present in the environment.
The genus Kocuria was detected in only three samples: A10, F4, and M21 (Suppl. Table 2). Interestingly, these samples were from the same sake brewery (Toyama 1) (Table 1). In addition, the samples A10 and M21 are both cloudy types of sake, while F4 is sake-kasu (Table 1). Kocuria was isolated from the first mixture of koji and moto from Brewery Toyama 1 [6]. Thus, this genus may be specific to sake from Brewery Toyama 1. Furthermore, this bacterium was not detected in clear types of sake from Toyama 1 (Suppl. Table 2), strongly suggesting that the Kocuria cells may be difficult to lyse in the sake production process.
We obtained 46 isolates from 6 Hatsuzoe samples of Brewery Toyama 1. Inferred from the 46 partial 16S rDNA sequences, 23 isolates (from 6 Hatsuzoe samples), 12 isolates (from 4 Hatsuzoe samples), 6 isolates (from 3 Hatsuzoe samples), 2 isolates (from 1 Hatsuzoe sample), 2 isolates (from 1 Hatsuzoe sample), and 1 isolate had similar sequences to the genera Kocuria, Staphylococcus, Bacillus, Leifsonia, Microbacterium, and Enterococcus, respectively (Table 3). The isolates of Kocuria were obtained from all of the 6 Hatsuzoe samples, strongly suggesting that these isolates may be contaminated from the environments of Brewery Toyama 1. The DNA from the genus Kocuria was detected in the sakes of Brewery Toyama 1 but was not detected in other breweries (Suppl. Table 2). Thus, those Kocuria isolates may be inhabited in Brewery Toyama 1.
Cluster 1 consisted of 33 samples, which is the largest cluster. However, no genera were detected across all 33 samples (Suppl. Table 2). The most frequently detected genus was Staphylococcus, detected in a range between 1.2% of sample E01 and 97.3% of sample F2, and in 17 samples altogether (Suppl. Table 2), (Fig. 3). Interestingly, Staphylococcus was detected in all 11 samples of sake-kasu (Suppl. Table 2), (Fig. 3). Among the sake-kasu samples, the percentage of Staphylococcus exceeded 50% in the samples F1, F2, F3, F9, F10, and F11 (Suppl. Table 2), (Fig. 3).
The variation of sequences detected in sake-kasu samples was lower than those of clear and cloudy sakes Fig. (3). Twelve different genera were detected in the sake-kasu samples (Suppl. Table 2), of which 11 were also detected in clear and cloudy sake samples (Suppl. Table 2). The genus Collimonas was only detected in the sake-kasu sample, F8 (1.4%) (Suppl. Table 2). Collimonas is capable of extracting nutrients from living fungi and from rocks and minerals [16], and its presence strongly suggests that bacterial DNA detected in sake-kasu may come from dead bacterial cells present, together with yeast cells, in the sediment. In sake solutions, extracellular bacterial DNA may exist from when bacterial cells lyse during the production process. The DNA from unlysed cells is also included in sake-kasu after filtration. Thus, the microbiome in sake-kasu may be a part of that in sake solutions (Fig. 3).

Table 3.
| Hatsuzoe | Sampling Date | Isolate | Genus |
|---|---|---|---|
| Sample 1 | 23-Oct-18 | MB1023_1 | Bacillus |
| LB1023_2 | Kocuria | ||
| TGY1023_2 | Kocuria | ||
| TGY1023_4_1 | Leifsonia | ||
| TGY1023_4_2 | Leifsonia | ||
| LB1023_3 | Staphylococcus | ||
| Sample 2 | 13-Nov-18 | TGY1113_1_15 | Bacillus |
| LB1113_2 | Kocuria | ||
| MB1113_2 | Kocuria | ||
| TGY1113_2 | Kocuria | ||
| Sample 3 | 20-Nov-18 | LB1120_1_15 | Enterococcus |
| LB1120_1_30 | Kocuria | ||
| LB1120_2 | Kocuria | ||
| MB1120_1 | Kocuria | ||
| TGY1120_1 | Kocuria | ||
| TGY1120_3 | Kocuria | ||
| TGY1120_1_15 | Microbacterium | ||
| TGY1120_2_15 | Microbacterium | ||
| MB1120_2 | Staphylococcus | ||
| Sample 4 | 27-Nov-18 | LB1127_2 | Kocuria |
| LB1127_3 | Kocuria | ||
| MB1127_2 | Kocuria | ||
| TGY1127_2 | Kocuria | ||
| TGY1127_3 | Staphylococcus | ||
| Sample 5 | 4-Dec-18 | LB1204_1 | Kocuria |
| Sample 6 | 18-Dec-18 | MB1218_3_30_1 | Bacillus |
| MB1218_3_30_2 | Bacillus | ||
| TGY1218_4_1 | Bacillus | ||
| TGY1218_4_2 | Bacillus | ||
| LB1218_1_15 | Kocuria | ||
| LB1218_1_30 | Kocuria | ||
| LB1218_2_30 | Kocuria | ||
| MB1218_1_15 | Kocuria | ||
| MB1218_2_30 | Kocuria | ||
| MB1218_5_30 | Kocuria | ||
| TGY1218_1_15 | Kocuria | ||
| TGY1218_1_30 | Kocuria | ||
| LB1218_2_15 | Staphylococcus | ||
| LB1218_3_30 | Staphylococcus | ||
| MB1218_2_15 | Staphylococcus | ||
| MB1218_4_1 | Staphylococcus | ||
| MB1218_4_2 | Staphylococcus | ||
| TGY1218_2_15_1 | Staphylococcus | ||
| TGY1218_2_15_2 | Staphylococcus | ||
| TGY1218_2_30 | Staphylococcus | ||
| TGY1218_3_30 | Staphylococcus |
We also pose that there are certain bacteria that are difficult to lyse during sake production. Staphylococcus, Loriellopsis, and Rhodoligotrophos are likely candidates. Conversely, some bacteria are likely to lyse easily, with their DNA detected in sake solutions, but not detected in sake-kasu, and are likely to include Pseudomonas and Delftia. The structure of a bacterial cell surface is likely related to its resistance to lysis from exposure to ethanol. The bacterial diversity in cloudy sake is higher than in sake-kasu, indicating that the genetic diversity of lysed bacterial cells is more diverse than that of unlysed, dead bacteria in sake sediment.
In cluster 1, the percentage of Lactobacillus exceeded 50% in samples A01, A01+, H01, F6, M9, and M23 (Suppl. Table 2), (Fig. 3). Lactobacillus is used in fermentation starter production [1, 2, 5]. In addition, some species of Lactobacillus are known to spoil sake [17, 18]. Strains known to cause spoilage were detected in samples A01, A01+, H01, M9, and M23 (Suppl. Table 1). On the other hand, in the sample F6, Lactobacillus sakei that does not cause spoilage was obtained (Suppl. Table 1).
Cluster 2 consisted of 6 types of clear sakes and one type of cloudy sake (Fig. 2), and is the smallest cluster but with the highest diversity (91 genera) (Suppl. Table 2), (Fig. 3). The genera Alteromonas, Colwellia, Pseudoalteromonas, Pseudomonas, and Sulfitobacter were detected in all seven samples. The most detected genera in samples M18, M19, M20, M21, M22, M24, and M25 were Colwellia (19%), Acinetobacter (11.7%), Sulfitobacter (21.4%), Colwellia (15.6%), Colwellia (13.1%), Colwellia (16.3%), and Sulfitobacter (13.8%), respectively (Table 3).
Cluster 3 consisted of 17 samples of clear sake and one sample of cloudy sake (Fig. 2). Aero sakkonema and Pseudomonas were detected in all 18 samples (Suppl. Table 2). Aerosakkonema was detected in the range of 29.4% of sample L01 and 55.4% of sample M12 (Suppl. Table 2), Fig. (3), with the species, Aerosakkonema funiforme, detected, which is a cyanobacterium containing intracellular gas vesicles [19]. Pseudomonas was detected in a range of between 7.1% of sample M15 and 20.0% of sample J01 (Suppl. Table 2), (Fig. 3).
CONCLUSION
Bacterial DNA frequently detected in sake and sake-kasu samples correspond to bacteria commonly present in the environment. Bacterial contamination occurs early in the sake production process; however, bacterial cell death usually occurs on exposure to ethanol produced as the sake yeast cells grow. After bacterial cell death, if bacterial cells lyse, the DNA is released into the sake solution, but if the cells do not lyse, they will precipitate toward the sediment. Most contaminating bacterial cells lyse during the production process; therefore, while both the microbiome in cloudy and clear sake is diverse, there is less microbial diversity in sake-kasu. In this study, Pseudomonas and Delftia were frequently detected in sake samples but were not detected in sake-kasu. Thus, it is likely that these bacteria lyse easily during sake production.
ETHICS APPROVAL AND CONSENT TO PARTICIPATE
Not applicable.
HUMAN AND ANIMAL RIGHTS
No animals/humans were used in the study that is the basis of this research.
CONSENT FOR PUBLICATION
Not applicable.
AVAILABILITY OF DATA AND MATERIALS
Not applicable.
CONFLICTS OF INTEREST
The authors declare no conflict of interest, financial or otherwise.
FUNDING
None.
ACKNOWLEDGEMENTS
The authors thank M. Akaike, Y. Kimura, H. Miyagawa, and M. Yamada for their technical supports. This work was supported by research funds of Toyama Prefecture and Toyama Prefectural University.
SUPPLEMENTARY MATERIAL
Supplementary material is available on the publishers Website along with the published article.


