
Computational Analysis, In silico Functional Annotation, and Expression of Recombinant PE_PGRS Protein Biomarkers Found in Mycobacterium tuberculosis
Authors Info & Affiliations
Abstract
Background:
Over the years, there have been many advances made within the treatment and diagnosis of Mycobacterium Tuberculosis (Mtb). In recent times, the rise of drug resistance has led to higher mortality rates, specifically in poorer countries. There is an urgent need for novel treatment regimens to work against Mtb. Previous studies have identified a gene family within Mtb, known as PE_PGRS proteins, which has shown potential as a drug target. Functional annotations can assist with identifying the role these proteins may play within Mtb.
Methods:
Previous studies indicated PE_PGRS to have potential for further research. The protein biomarkers that showed the most promise were identified as PE_PGRS17, PE_PGRS31, PE_PGRS50, and PEPGRS54. The sequences of these proteins were searched on the Mycobrowser software. Results were designed by entering these sequences into various computational algorithms. PE_PGRS17 showed characteristics of a potential vaccine candidate. Considering this result, expression profiling and purification were conducted on the recombinant PE_PGRS17 Mtb protein biomarker.
Results and Discussion:
The results were calculated using various online software algorithms. Many characteristics were predicted to understand the stability, localization, and function of these proteins. All the proteins have been estimated to produce an immune response or be involved in the process of immunity. The recombinantPE_PGRS17 protein was chosen to be optimally expressed and purified using E.coli as a host cell. These findings specifically on PE_PGRS17, can be expanded in future scientific studies.
Conclusion:
The predicted structures, protein-protein interaction, and antigenic properties of the proteins estimate whether a protein can be used for further studies, specifically as drug/vaccine targets. Ultimately, PE_PGRS17 is seen as the most stable according to its predicted structure, which holds promise as a key factor in future tuberculosis studies.
1. INTRODUCTION
In a world containing an abundance of technology propelling towards futuristic ideologies, Mycobacterium tuberculosis (Mtb) remains a global health threat. Mtb is known as an infectious disease caused by a gram-positive bacillus. Over time, there have been many breakthroughs in the diagnosis and treatment aspects of Mtb. Mtb is difficult to overcome on account of its infectious nature, intricate immunological response, chronic progression, and the long duration of treatment [1]. With the emergence of drug-resistant Mtb, current treatment strategies have been severely crippled. According to studies, Mtb is labeled as the “disease of the poor” [2, 3]. This perception is supported by evidence that populations exposed to overcrowded living conditions and work conditions are more susceptible of spreading Mtb Another contributing factor is that the countries lack basic health facilities and economic capacity to manage the disease efficiently [2]. The world health organization (WHO) stated in their 2022 global TB report that an estimated number of 10.6 million people developed TB in 2021 [4]. This is a drastic 4.5% increase in cases from 2020. Two-thirds of the globally reported cases occur in countries, such as India and China. South Africa falls within the top 30 countries that contribute to the reported statistics [4]. Mtb presents in two forms, namely active Mtb and latent Mtb. Latent tuberculosis infection (LTBI) lurks within individuals silently and usually does not cause any symptoms. The bacteria remain dormant in almost 90% of Mtb patients and, therefore, should be considered the focus of treatment strategy [5].
When an individual coughs or sneezes, aerosol droplets are released and dispersed into the air around them. The inhalation of these droplets by another individual is the start of the Mtb cycle. An inflammatory mononuclear cell referred to as granuloma is responsible for either limiting the growth of Mtb or allowing its survival. This step marks the difference between active and latent Mtb. These cells lie in a constant state of balance that can be easily offset by the loss of vascularization, increased necrosis, and the accumulation of caesium in the granuloma centre [6]. If this occurs, the immune system of an individual is compromised, and the disease progresses to the rest of the body. The granuloma cells form cavities within the lung. When these cavities collapse, Mtb spreads into the airways of an individual. This restarts the life cycle of Mtb. Antibiotics were created to help stunt the growth of the bacteria, which has made it the most successful chemotherapy agent in the history of medicine [7].
The treatment method used against LTBI consists of a long regimen of specific antibiotics, which include isoniazid and rifampicin. Some of these first-line drug treatments have been coupled with other drugs to enhance their efficacy. The mechanism of action of isoniazid inhibits the mycolic acid synthesis of the cell, which then disrupts the bacterial cell wall [5, 8]. Rifampicin is believed to bind to the β subunit of the DNA-dependent RNA polymerase inhibiting the RNA synthesis mechanism in the bacteria. This blocks the RNA transcription from occurring, resulting in an effective treatment against LTBI [5]. Unfortunately, the organisms found in latent tuberculosis possess low metabolic activity due to their dormancy state [9]. Thus, anti-tuberculosis treatments require lengthy course plans to be effective [5]. These treatment plans are costly, which puts a strain on poorer populations, further affecting economic growth as a whole [2]. Despite the advances made in treating this disease, the development of resistance has set science behind. Antibiotics have been misused by overconsumption as well as poorly used by the medical community. Genetic resistance elements continue to undergo evolution, leading to multidrug-resistant (MDR) and extremely drug-resistant (XDR) pathogens [7].
A strain of Mtb, namely H37Rv, comprising of approximately 4 million base pairs and 3000 proteins in its genome sequence, has become the focus of attention as it possesses a specific gene family: PE/PPE [10]. Roughly 10% of proteins encode these subfamilies within the genome. The gene family is given the names PE and PPE, as specific amino acid motifs are held toward the N-terminus. The PE family can be divided further into two groups, namely PE and PE_PGRS subfamilies. The PE_PGRS family contains a polymorphic domain of Gly-Gly-Ala/Gly-Gly-Asn amino acid repeats. The proteins are found within the outer membrane matrix of the mycobacteria. The main function of the subfamily, PE_PGRS proteins, is still unknown to science but is the subject of much speculation. Due to the subcellular localization of the subfamily, there is a suggestion that this group may mediate the interaction between the macrophage and host bacteria [11]. Certain PE_PGRS proteins have been recorded to have evidence of being expressed in granulomas and found at the surface of the mycobacteria, indicating that they may play a role in host/pathogen interaction [6, 12]. The role that these proteins may play in mycobacterial pathogenesis is dependent on the localization, host response, and regulation of these proteins. Only a handful of PE_PGRS subfamily proteins have been extensively studied. These specific proteins, PE_PGRS, can be used as promising subunit vaccine components to prevent the reactivation of Mtb. Future work on these proteins would be fruitful for the scientific community as Mtb is becoming difficult to fight as antibiotic resistance strains increase [11]. This study characterized PE_PGRS proteins as potential targets for drugs and vaccines to prevent Mtb activation. This strategy is less expensive than performing laboratory experiments. Functional annotations of these proteins could highlight them as potential biomarkers for improved treatment and diagnostics of Mtb [13]. Thus, it was found that a PE_PGRS17 protein would be an ideal candidate. Given this result, PE_PGRS17 purification and expression were carried out.
2. MATERIALS AND METHODS
2.1. Sequence Retrieval
We searched through the Mycobrowser (https://mycobrowser.epfl.ch/), which was adapted from the Tuberculist database, for sequences of potential PE_PGRS biomarkers [14]. The database provides a powerful, generic framework that assists in retrieving information, such as sequences, making it convenient to study mycobacterial genomes. Protein sequences from the subfamily PE_PGRS found in Mtb were screened. The proteins, PE_PGRS17, PE_PGRS31, PE_PGRS50 and PE_PGRS54, were selected. The sequences were converted to the FASTA format for further analysis programs (Table 1).
| Primer sequence (5’-3’) |
|---|
| PE_PGRS17 fwd (30 bases) GCCTTAGAATTCGCGACCCAGGTGTTG |
| PE_PGRS17 rev (36 bases) TGTAAACTCGAGTCATGCTAAGCTGATTACCGACAC |
2.2. Analysis of Physicochemical Properties
The ExPASy tool from the ProtParam database (http://web.expasy.org/protparam/) and EMBL-EBI Emboss Pepstats (https://www.ebi.ac.uk/Tools/seqstats/emboss_peps tats/) search were used for the analysis of the physiological and chemical properties of the targeted protein sequences. The properties that were analysed by ProtParam database included molecular weight, aliphatic index (AI), extinction coefficients, isoelectric point (pI), and instability index (II). The Pepstats database was developed by EMBOSS, a European Molecular Biology Open Software Suite, which estimates peptide statistics of specific proteins. The software can predict physicochemical properties, such as molecular weight and molar extinction coefficients [15]. The Kyte-Doolittle program (https://web.expasy.org/pro tscale/) found on the ExPASy database is used to calculate the hydrophobic regions in proteins.
2.3. Subcellular Localization Prediction
Prediction of subcellular localization was compared using four different software systems for PE_PGRS17, PE_PGRS31, PE_PGRS50 and PE_PGRS54. The software used were CELLO v.2.5 (http://cello.life.nctu.edu.tw/), Mempyre (https://mu2py.biocomp.unibo.it/mempype/default/predict), BaCelLo and PSORTb v3.0.2. The interface CELLO uses 4 types of sequence coding schemes: the di-peptide composition, amino acid composition, the physio-chemical properties of the amino acids, and partitioned amino acid composition. The scoring method for each type is combined with the jury votes, which gives a final assessment. The prediction of the subcellular localization is important in understanding the function of the protein.
2.4. Motif Analysis
The identified proteins were subjected to a MEME tool search (http://meme-suite.org/tools/meme) to predict conserved motifs characteristic of the 4 PE_PGRS proteins. The main function of the MEME suite database is to find motifs in unaligned DNA, RNA, or protein sequences. The database was created in 1994 and has improved immensely over the last 20 years [16, 17]. The eukaryotic linear motif database (ELM) (http://elm.eu.org) is commonly used to verify short linear motifs (SLiMs). The ELM dataset is used to search for the function of identified common motifs in the database of known motifs [18].
2.5. Multiple Sequence Alignment
Multiple sequence alignment (MSA) is the process of sequence alignment of biological sequences, proteins, DNA, or RNA. There are numerous computational algorithms for accomplishing this task, given the intractability of manually processing the sequences. There are many approaches, including methods like dynamic programming [19], consensus methods [19], hidden Markov models [20, 21], and many more. A comparison between four sequences is made using the T-coffee online programme (http://tcoffee.crg.cat/apps/ tcoffee/do:mcoffee). The comparison can give insight into the functional and structural features of a specific protein. MSA tool scores are based on the match of amino acid sequence or nucleic acid sequence between many sequences.
2.6. Secondary Structure Analysis
A secondary structure prediction is based on the numbers of alpha-helices, random coils, extended strand, and beta-turn present. This study utilizes the database called Self-Optimized Prediction Method with Alignment (SOPMA) (https://npsa-prabi.ibcp.fr/NPSA/npsa_sopma.html) to compare the four PE_PGRS family proteins. The tool contains approximately 126 chains of non-homologous data, which can be used to compare proteins under investigation. This method is regarded as homology methodology.
2.7. Protein-protein Interaction Analysis
Proteins found in genomes interact with each other to be able to perform specific functions in biological systems. The database selected for the purpose was STRING (http://string- db.org/). This database was utilized to analyse the network of predicted associations for a group of proteins surrounding the protein of interest.
2.8. Antigenic Properties
The VaxiJen tool (http://www.ddg-pharmfac.net/vaxijen/ VaxiJen/VaxiJen.html), immunomedicine (http://imed.med. ucm.es/Tools/antigen-ic.pl) and SVMTrip (http://sysbio.unl. edu/SVMTriP/) were used to predict various antigenic features of these proteins. The tool uses alignment-independent prediction to predict the antigenicity of a specific protein [22].
2.9. Homology Modelling
The BLASTP database (https://blast.ncbi.nlm.nih.gov/ Blast.cgi?PAGE=Proteins) was used to perform homology modelling of the target protein sequences. This modelling enables the prediction of the three-dimensional structure of PE-PGRS17, PE_PGRS31, PE_PGRS50, and PE_PGRS54. The search was conducted against the Brookhaven Protein Data Bank (PDB) to find suitable templates for homology modelling.
2.10. Tertiary Structure Prediction
The tertiary structure was predicted by SWISS-MODEL through the ExPASy web server (http://swissmodel.expasy .org/) of the Swiss Institute of Bioinformatics. The program uses homology modelling techniques and amino acid sequences to generate 3D models of target proteins. It is a simple web-based database that does not need to be installed onto a computer (Table 2).
2.11. Confirmation of the Protein Biomarker PE_PGRS17 in the pGEX-6P-1
The recombinant plasmid pGEX-6P-/pe_pgrs17 in E. coli BL21 expression host was obtained from the Discipline of Microbiology, UKZN. Polymerase chain reactions (PCR) were used to verify and confirm the presence of pe_pgrs gene insert using gene-specific primers. Platinum™ II Taq Hot-Start DNA Polymerase (Cat. No. 14966001, Invitrogen) was used to perform PCR in a 50 uL reaction following the manufacturer’s instructions. PCR conditions were initial denaturation at 95°C for 1 minute, followed by 30 cycles of 95°C for 30 seconds, 55°C for 1 minute, and 72°C for 1 minute. The final extension was conducted at 72°C for 5 minutes. Results were analysed using 1% agarose gel electrophoresis (Table 3).
| Master Mix Components | 1 Vial |
|---|---|
| 10xPCR buffer | 5uL (used 10uL since I had 5X) |
| 50mM MgCl2 | 1.5uL |
| 10mM dNTP mixture | 1uL |
| 10uM forward primer | 1uL |
| 10uM reverse primer | 1uL |
| TOTAL | 14.5 |
| Reagents | Control | Tube 1 | Tube 2 |
|---|---|---|---|
| Master mix | 16 | 16 | 16 |
| Template DNA (add last) | 2 | 2 | 2 |
| Taq polymerase | 0 | 0.5 | 0.5 |
| GC enhancer | 0 | 0 | 10 |
| Distilled water | 32 | 31.5 | 21.5 |
| Total | 50 | 50 | 50 |
LB media containing ampicillin (100 µg/ml) was inoculated with E. coli harbouring recombinant plasmid. The culture was grown overnight at 37oC in a 160 rpm shaking incubator. The culture was removed after 12-16 hours of growth. The Zyppy plasmid miniprep kit by Zymo Research, USA, was used to extract the DNA for further analysis.
2.12. Chemically Competent Rosetta Cells (DE3)
The cells were retrieved and inoculated in 10 mL of lysogeny broth (LB) media and grown for 12-16 hours at 37oC. 100 X dilution of overnight LB media was carried out at 37oC until the culture reached an absorbance (OD) of 0.4 - 0.5 at 600 nm. Once the OD has been reached, the culture was incubated at 4oC for 30 minutes. The culture was then transferred into two 50 mL centrifuges, and the culture was spun down at 4oC at 3220 x g for 7 minutes. The supernatant was discarded, and the cells were resuspended in half the original volume (25mL) of 0.1M MgCl2 and incubated on ice for 15 minutes. The solution was centrifuged at 4000 rpm for 7 minutes at 4oC, and the supernatant was discarded. The pellet was resuspended in 25 mL of ice-cold 0.1M CaCl2 and incubated on ice for 15 minutes. The tube was centrifuged again (3220 x g) for 7 minutes. The pelleted cells were resuspended in 1 mL of 0.1 M CaCl2 and 20% glycerol stock, and aliquoted into 1.5 mL tubes to store in the -80oC bio-freezer.
2.13. Heat Shock Transformation of the PE_PGRS17 into Rosetta Cells
The chemically competent E. coli Rosetta (DE3) was retrieved from a -80oC bio-freezer (100 µL of competent glycerol cell stock solution in a 1.5mL microcentrifuge tube). A water bath was switched on and adjusted to 42oC. The tube(s) were kept on ice. An estimated 50 ng (5 µL) of circular DNA (PE_PGRS17) was added into 100 µL of competent E. coli Rosetta (DE3) and E. coli BL21 (DE3) (control). The tubes were incubated on ice for 10 minutes to completely thaw the competent cells. Thereafter, the tubes were placed in a water bath at 42oC for 45 seconds and immediately put back on the ice for 2 minutes to reduce the damage to E. coli cells. 1 mL of freshly made LB media was added to the tubes, and the tubes were incubated at 37oC for 1 hour. Approximately, 100 µL of the resulting tubes were spread-plated on LB media plates and grown overnight at 37oC. Colonies were picked and inoculated into the culture. This culture was grown at 37oC overnight, and glycerol stocks were made. 1.5 mL tubes were pipetted with 200 µL culture and 200uL 40% glycerol.
2.14. Optimising Bacterial Expression Profiling for PE_PGRS17
After successfully transforming the plasmid into competent E. coli Rosetta (DE3) cells, plasmids should be optimally expressed and purified. Optimal bacterial expression settings can be evaluated by varying conditions, such as IPTG ratio, media, temperature, and time length of growth. The glycerol stocks (transformed PE_PGRS17) were cultivated overnight in media and then inoculated on a larger scale in a 250mL flask of media at a specific temperature. The 1% starter culture was inoculated into larger expression media containing 1 mM concentration of chloramphenicol and ampicillin antibiotics. The absorbance of the culture was reviewed every hour until it was between 0.4 and 0.6 nm. This is regarded as the pre-induction period of growth and is indicative of the mid-log phase of growth. Thereafter, the expression was induced with 1 mM of IPTG (Isopropyl β-D-1-thiogalactopyranoside). An absorbance reading was taken at designed intervals. To assess the optimal concentration of IPTG, 0.2 mM, 0.5 mM, 1 mM, and no IPTG were also used to induce protein expression.
Various culture media (LB media, 2YT media, and TB media) and various temperature settings (370 C, 300 C, and room temperature) were independently employed to optimize expression levels. The growth rate was monitored at various time lengths, such as 1-6 hours, 24 hours, and 48 hours growth, where readings were taken every 6 hours. The samples were centrifuged at maximum speed for one minute, and the supernatant was removed. The pellet was resuspended in B-PER lysis buffer (Thermo scientific, USA) after correct calculation. An SDS-PAGE analysis was used to view the result of the expression.
2.15. Purification Strategy for pe_pgrs17 Gene
2.15.1. Preparation of Lysate
The culture was grown at optimal conditions for 2 hours after mid-log phase growth at 37oC. The cells were pelleted and stored in the bio-freezer for further analysis. Pelleted cells were thawed on ice and resuspended in 7.5 mL B-PER (Thermo scientific, USA) lysis buffer. These were incubated on ice for 30 minutes on an end-over rotator system. The cells were then pelleted down at 2436 x g for 1 hour. The cells were then washed with 5mL of 1% triton X solution for 10 minutes and centrifuged at 3220 x g for 40 minutes. This step was repeated 3 times.
2.15.2. Solubilisation of Aggregated Protein
The pellet was resuspended in 5mL of buffer B (10 mM Tris HCl at pH 8, 5 mM DTT, and 8 M Urea) and incubated at 30oC for 1 hour. The solution was then centrifuged at 2436 x g for 1 hour.
2.15.3. Refolding Strategy of Solubilized Protein
The pelleted cells were resuspended in 5 mL of buffer B for preparation for dialysis. The dialysis membrane was washed overnight in water and resuspended in dialysis buffer (Tris HCl at pH8). The dialysis membrane (Sigma, Germany) was tied into a tight knot at one end and the sample was loaded into the tubing through the other end. The open end was folded around a spatula to allow the sample to suspend within the dialysis buffer in a 400mL beaker. The beaker with dialysis buffer was stirred at low speed at room temperature. The dialysis buffer was changed every 2 hours for 6 hours and then left for overnight dialysis.
2.15.4. Purification Technique for GST-tagged Protein
The dialysed sample was prepared for purification by adding an equal volume of equilibration/binding buffer. A centrifuge tube that contained the Glutathione Superflow Agarose (resin) was used as a separation column and was washed with an equilibration buffer. The prepared protein extract was added to the tube with the resin and mixed for a few minutes. The tube was left to incubate, and the resin started to separate from the rest of the solution. A pipette was used to remove the flow-through, and 60uL was collected in a microcentrifuge tube where 20uL of equilibration buffer was added. The resin was then washed twice with wash buffer (two resin bed volumes), and the flow was separated the same way. 80uL of each wash step was kept. The GST-tagged protein was then eluted 5 times using 500uL of elution buffer each time, and the flow-through was collected through a pipette and added into microcentrifuge tubes. SDS analysis was used to view the result of the eluted protein.
2.16. SDS-PAGE Analysis of Expressed and Purified PE_PGRS17 Protein
SDS-PAGE (Sodium dodecyl-sulfate polyacrylamide gel electrophoresis) was used to analyse and view results based on the molecular weight of the study protein. To prepare for the analysis, 80 μL of the sample was diluted with 10-20 μL of sample buffer. The diluted samples were heated to 1000C in a heating block for 15 minutes and thereafter cooled in a rack at room temperature. The 12% acrylamide SDS-PAGE gels were casted by means of stacking and resolving gel in SDS-PAGE casting equipment (Biorad, USA). Well-forming combs were used to create the space in which the sample will be loaded as well as the molecular marker. After solidifying, the gel was placed in the running chamber (Biorad, USA) and filled with running buffer. This ensured the sample to be able to float to the bottom of the well. A protein standard marker (New England Biolabs, UK) and samples could be loaded into the well. Running buffer was added again to top up and submerge the bottom of the gel. The equipment was attached to a power supply and run at 120 volts for 90 minutes. When the samples run to the bottom of the gel, it was removed and further processed with coomassie stain and distilled water. This was done to ensure good visualisation of bands using G: box viewer (Syngene, UK).
3. RESULTS AND DISCUSSION
3.1. Physiochemical Properties
The physiological and chemical properties of the PE_PGRS proteins (Table 4) were computed by the software systems ProtParam and Pepstats. The properties were deduced from the protein sequence in FASTA format for each protein biomarker. These calculated properties (Table 4) estimate the stability of the proteins correlating to their proper function. The molecular weight varies between 31KDa and 147KDa. The definition of an isoelectric point (pI) is the pH of the protein, whereby there is no net charge and no mobility. The amino acids found in the proteins are unable to tolerate liquid at this point and therefore do not move in an electric field of direct current [23]. The pI for this group of proteins ranges between 3.5 and 10.1. The molecular weight and pI parameters help to visualize the gene on an electrophoresis gel, which can be used in laboratory investigations of the proteins [23]. The pI is vital for buffer development for expression and purification studies [13].
The extinction coefficient is essential for quantitative analysis of protein-protein and protein-ligand interactions, which is necessary information in the drug development stage [13]. The parameter that measures the amount of light absorbed by the protein is known as an extinction coefficient. This information is necessary when a protein is being purified [24]. This parameter is a simple method to ensure that the sample solution contains the desired protein for further studies. This coefficient can be used to work out the protein concentration. The instability index is the estimation of the stability of a protein in a test tube environment. Any protein that has an instability value smaller than 40 is considered stable. The stability index for PE_PGRS17 is 14.54 therefore the protein is stable. The rest of the proteins have instability values above 40, making them unstable. The aliphatic index was also predicted from the protParam database. This index is able to tell the number of aliphatic chains that are present in the sequence. The higher the index, the higher the indication that the protein under study is thermostable under a wide temperature range. PE_PGRS17 protein is regarded as the most thermostable [13, 23, 24]. The Probability of Expressed Protein in Inclusion Bodies (PEPIB) estimates the probability of expression of the gene cloned into E.coli over the protein [25]. The Grand Average of Hydropathy (GRAVY) is based on the sum of the hydropathy values of the amino acids in a sequence divided by the total residues in the sequence. The value is a representation of protein-water interaction, which then accounts for the hydrophilic nature of the protein [13]. A GRAVY value that is low is taken to indicate that the protein has a higher interaction with water. The GRAVY range of the four PE_PGRS proteins is 0.3 to 0.7, which is low in range. This indicates that proteins are more hydrophilic (globular) in nature rather than hydrophobic (membranous). This parameter is useful in predicting the location of proteins [26].
| Physiochemical Properties | PE_PGRS17 | PE_PGRS31 | PE_PGRS50 | PE_PGRS54 |
|---|---|---|---|---|
| Molecular weight | 31019,06 | 51962,84 | 129385,38 | 147625,34 |
| Isoelectric point | 4,4486 | 4,0544 | 10,1103 | 3,5385 |
| Residues | 331 | 618 | 1538 | 1901 |
| Charge | -5,0 | -8,5 | 20,0 | -69,5 |
| A280 Extinction Coefficients 1mg/ml (Reduced) | 0,595 | 0,518 | 0,695 | 0,179 |
| Improbability of expression in inclusion bodies | 0,946 | 0,850 | 0,585 | 0,816 |
| Instability index (II) | 14,54 | 49,98 | 54,42 | 55,54 |
| Aliphatic index (AI) | 83,50 | 11,42 | 13,28 | 11,22 |
| GRAVY | 0,303 | 0,647 | 0,790 | 0,778 |
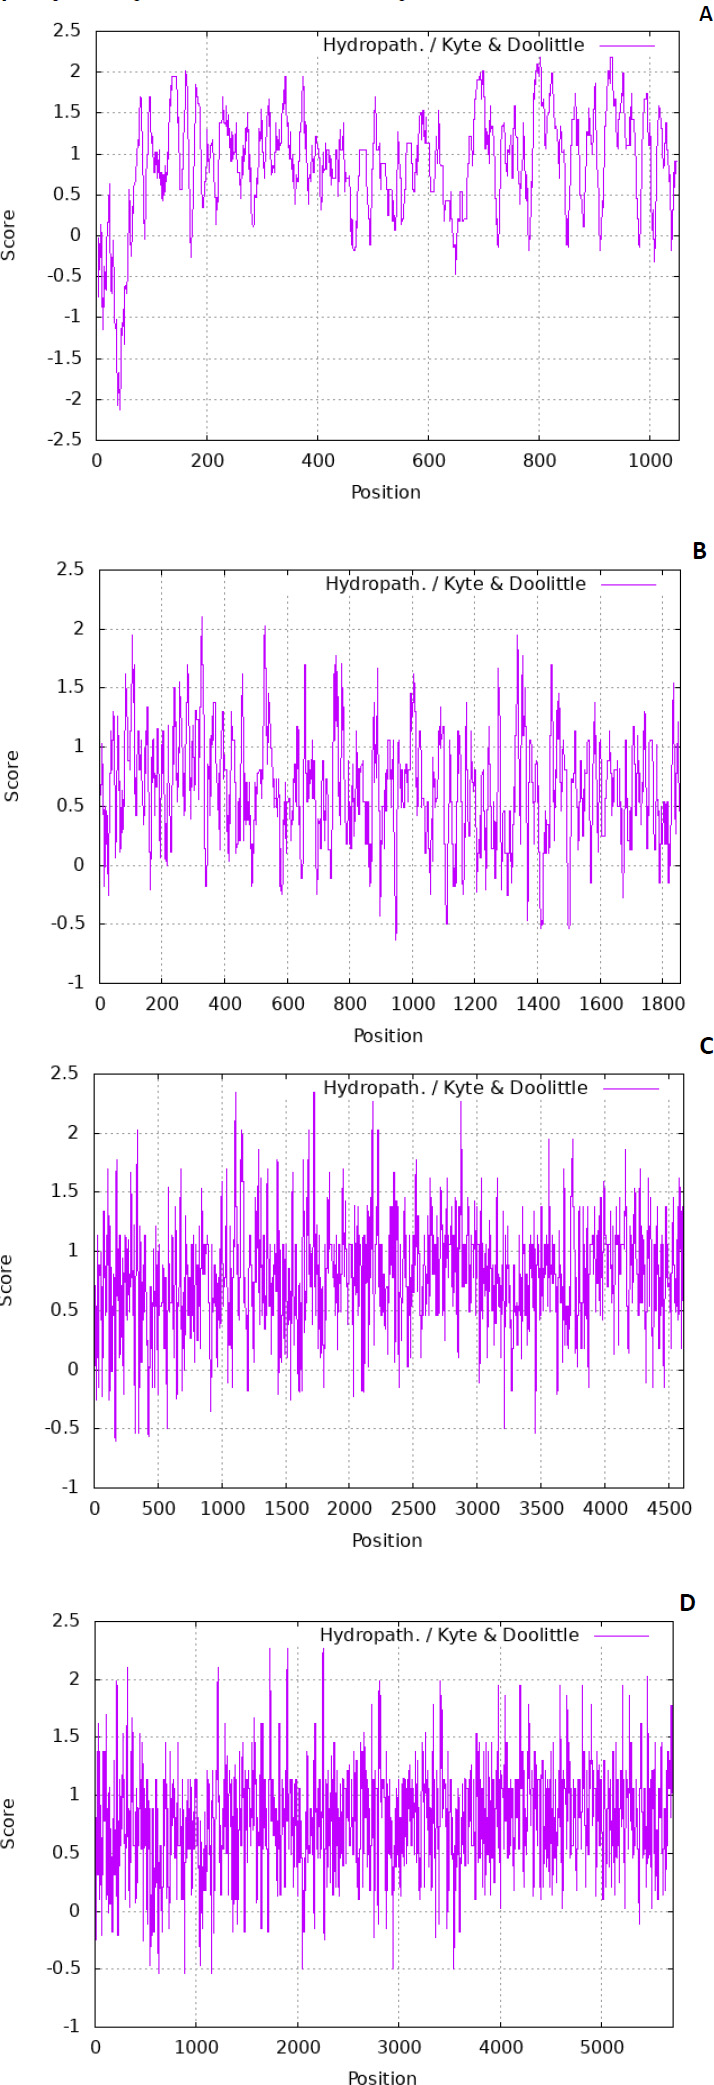
The residues are also tiny. There are various scales used to predict the hydropathicity of a protein; in this case, the Kyte-Doolittle scale was used. The ExPASy contains the Kyte-Dolittle scale to plot the graphs. Fig. (1) denotes predicted hydropathy plots of the biomarker proteins, PE_PGRS17, PE_PGRS31, PE_PGRS50, and PE_PGRS54. The algorithm is found in a web-based program referred to as ExPASy (Expert Protein Analysis System) software and is used to identify hydrophobic regions within protein structures. The hydropathic nature can rely on whether a protein is hydrophobic (fears water) or hydrophilic (loves water). A positive value on the scale is indicative of a hydrophobic region in the protein. A negative peak could indicate hydrophilic segments [27]. By predicting this scale, regions that are found on the surface and transmembrane regions can be identified [28]. This information is used to predict the structure of a protein. In protein research, it is important to understand that a predicted structure can correlate to a predicted function. All four PE_PGRS proteins are seen to have both hydrophobic and hydrophilic regions. In particular, PE_PGRS17 is seen to have larger positive peaks towards the middle of its sequence than at the beginning and end. This could be indicative of the N-terminal and C-terminal being surface-exposed and the body of the structure residing within the transmembrane region. The rest of the proteins also display regions where some are surface exposed, and some are found in the transmembrane. Further analysis will have to be conducted to discover the specific location prediction of each region.
SOPMA and I-TASSER were used to predict the secondary structure of the four proteins. 27.19% α-helix, 25.98% extended strand, 9.67% β-strand, and 37.16% random coil were predicted in the secondary structure for PE_PGRS17 by SOPMA analysis.
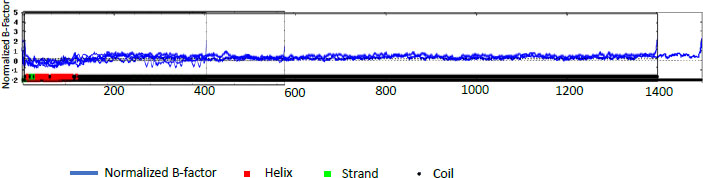
The percentages for PE_PGRS31 were predicted to be 14.72% α -helix, 24.11% extended strand, 9.22% beta-turn, and 51.94% random coil. PE_PGRS 50 and PE_PGRS 54 have a high percentage of the random coil, i.e., 68.66% and 71.70%, respectively. Percentages of the random coil are indicative of disordered regions of the folding found in the protein. This does not mean that the protein is unstable. The random coil may play an important part in the function of a protein, such as ligand-binding. The α-helix is the most stable form of a protein due to the side chains facing out of the chain allowing for hydrogen bonds along the helix. A z-score-based normalization of the raw B-factor values for a target protein can be referred to as a normalised B-factor score. A predicted normalized B-factor profile (BFP) is produced using a combination of a template-based assignment and profile-based prediction. If the values are higher than zero, the structure is taken to be less stable. The profiles seen in Fig. (2) show potentially stable structures with a few unstable regions. This could be related to the random coils predicted in Table 5. All these predicted structures begin as helices and proceed to coil structures. This reiterates the point of the structure being in two compartments of the cell [29].
The secondary structure of the protein is predicted using SOPMA and I-TASSER. Analysis by SOPMA predicted a 27.19% α-helix, a 25.98% extended strand, a 9.67% β-strand, and a 37.16% random coil in the secondary structure for PE_PGRS17. The percentages for PE_PGRS31 were predicted to be 14.72% α -helix, 24.11% extended strand, 9.22% b-turn, and 51.94% random coil. PE_PGRS 50 and PE_PGRS 54 have high percentages of random coils, i.e., 68.66% and 71.70%, respectively. A percentage of random coils is simply disordered region of the folding found in the protein. This does not mean that the protein is unstable. Random coils may play an important part in a protein's function, such as ligand binding. The α-helix is the most stable form of a protein due to the side chains facing out of the chain allowing for hydrogen bonds along the helix. The proteins under evaluation seem to be stable structures to undergo further study.
| PE_PGRS Family Protein | Alpha Helix (Hh) |
Extended Strand |
Beta Turn |
Random Coil |
|---|---|---|---|---|
| PE_PGRS17 | 27,19% | 25,98% | 9,67% | 37,16% |
| PE_PGRS31 | 14,72% | 24,11% | 9,22% | 51,94% |
| PE_PGRS50 | 9,95% | 13,72% | 7,67% | 68,66% |
| PE_PGRS54 | 6,10% | 13,10% | 9,10% | 71,70% |
The evolutionary analysis of the PE_PGRS proteins was predicted. A BLASTp (Basic Local Alignment Search Tool for Proteins) search was performed. This revealed that all the PE_PGRS proteins aligned to the PE family were found in Mtb (Table 6). The proteins had an estimated homology higher than 98%, providing evidence to make assumptions that the proteins may have similar functions as other known PE family proteins. Another valuable prediction provided is the subcellular location of a protein. A cell's functions is dependent on the location of the cell's protein due to the mechanism available. Therefore, if we know the localization of the protein in a cellular space, it will help reveal some vital information about an unknown functional ability of a protein. Predicting the function of proteins is important for drug design and progress in further studies on an unknown protein [23, 30]. Four different web-based programs were used to provide validity to the results; the websites PSORTb, BaCelLo, CELLO, and Mempype (Table 7) correlated that the PE_PGRS proteins are predicted to be in the cell membrane. Proteins in this localization are involved in maintaining the barrier of the cell and involved in the gate process of what substances are allowed in and out, such as nutrients and waste products.
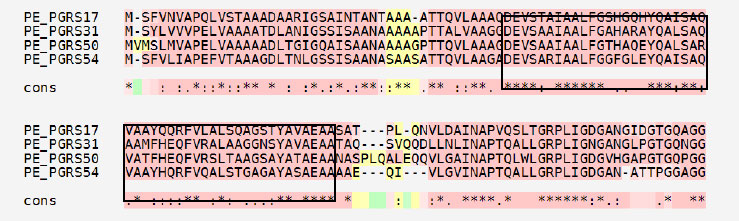
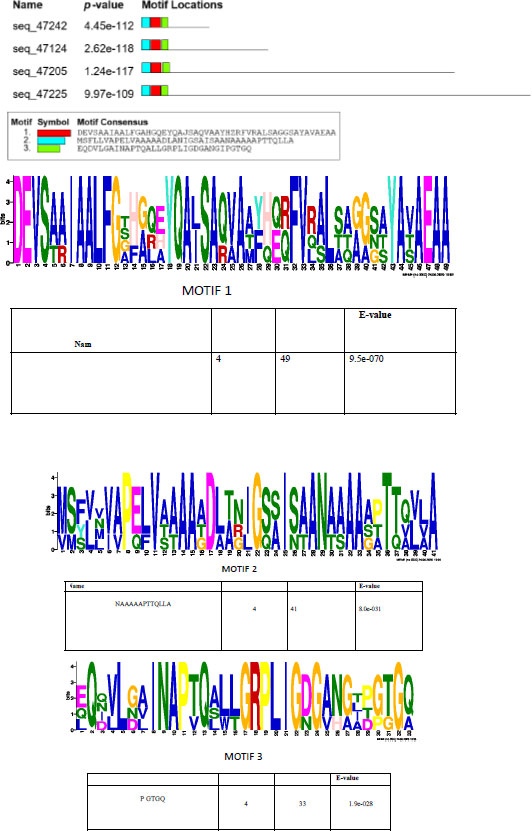
A prediction of short linear motifs (SLiM) was made using the MEME tool. These motifs are stretches of a protein sequence that are usually between 3 to 20 amino acids long. These sequences uphold a specific function of the protein [31]. SliMs have the potential to be involved in various regulatory processes in proteins, such as post-translational modification [32]. The PE_PGRS proteins have 3 potential common motifs designated as 1, 2, and 3, with motif 1 being conserved among PE_PGRS proteins (Fig. 3). Motif 1 is located at approximate position of 44-92 amino acids. Using the ELM database, motif 1 is predicted to consist of binding/recognition sites for glycosaminoglycan and GSK3 phosphorylation, respectively. Multiple sequence alignment (MSA), shown in Fig. (4), is widely used in many biological techniques [33]. Comparing sequences on a database enables structural and functional insight into a specific protein. The MSA of the four PE_PGRS proteins of Mtb was generated by the program T-coffee. This database provides a progressive method of aligning sequences [34]. The boxed region indicates the most conserved region, which we know to be motif 1. The conserved residues are indicated by the asterisks in the alignment. Conserved sequences provide evolutionary evidence that PE_PGRS17, PE_PGRS31, PE_PGRS50 and PE_PGRS54 are of the same family. It can be assumed that these proteins may exude similar functions in the cell.
| PE_PGRS Family Protein | Protein Description | NCBI Accession Number | Max Score/Total Score | Query Cover (%) |
|---|---|---|---|---|
| PE_PGRS17 | PE family protein (Mtb) | WP_031757157.1 | 614 | 100 |
| PE_PGRS31 | PE family protein (Mtb) | WP_075956450.1 | 1016 | 100 |
| PE_PGRS50 | PE family protein (Mtb) | WP_010886165.1 | 2543 | 100 |
| PE_PGRS54 | PE family protein (Mtb) | WP_0108861172.1 | 2831 | 100 |
| Software | Subcellular localization prediction outcome | |||
|---|---|---|---|---|
| PE_PGRS17 | PE_PGRS31 | PE_PGRS50 | PE_PGRS54 | |
| CELLO v.2.5: subcellular localization predictor | Extracellular | Extracellular | Extracellular | Extracellular |
| BaCelLo balanced subcellular localization predictor |
Secretory | Secretory | Secretory | Secretory |
| PSORTb v3.0.2 | Final prediction-unknown (this protein may have multiple localization sites) Secondary localization - cell wall |
Final prediction-cytoplasmic membrane Secondary localization-cell wall |
Final prediction -extracellular Secondary localization -cell wall |
Final prediction -extracellular Secondary localization -cell wall |
| MemPype prediction server | Cell membrane | Cell membrane | Cell membrane | Cell membrane |
A strong vaccine candidate requires a peptide to be hydrophilic and be able to produce the B-cell and T-cell to mediate immunity [35]. The VaxiJen tool is used in the prediction of protective antigens, which are considered the basis of subunit vaccines [36]. The software uses a novel independent alignment for prediction. This method is based on the auto cross-covariance (ACC) transformation of protein sequences into identical vectors [36]. Table 8 shows a summary of predicted antigenic properties. The threshold of this tool is 0.4. The PE_PGRS proteins have surpassed this threshold, ranging between 0.8940 and 2.7388, making them highly antigenic. The SVMTriP database was used as a method to predict antigenic epitopes using a Support Vector Machine to Integrate Tri-Peptide Similarity and Propensity (SVMTriP). These epitopes are defined as regions on a protein's surface that are recognized by B-cell antibodies. The prediction of these epitopes is advantageous for an individual's immunity mechanisms and could potentially be useful for the design of vaccine components and immunodiagnostic reagents [37].
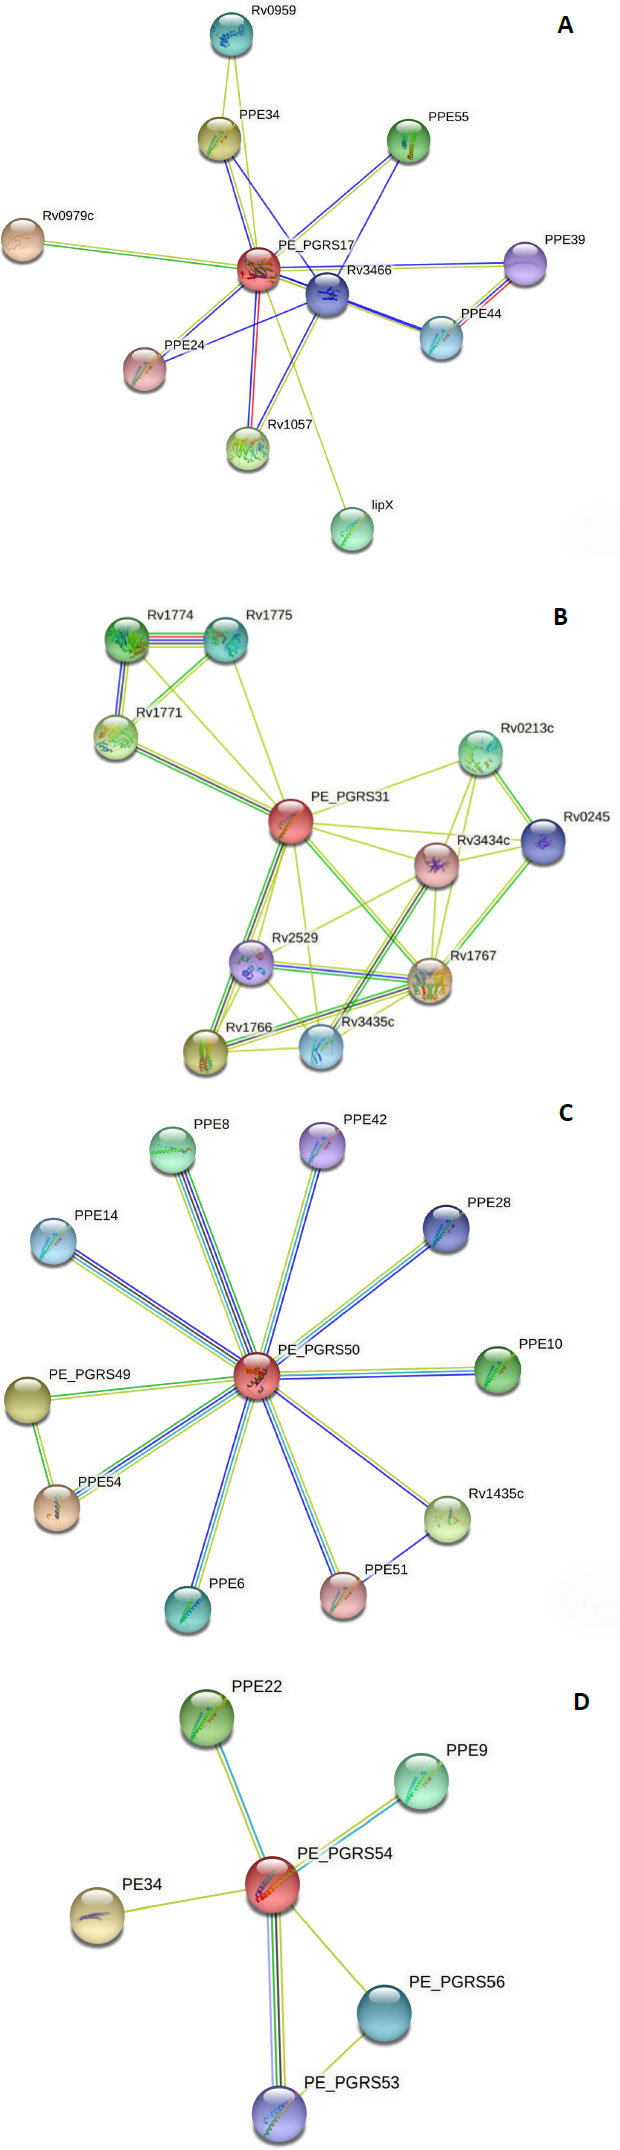
To make a functional prediction, the STRING software was used for the prediction of interaction between the PE_PGRS proteins and other protein association networks. The network nodes seen in different coloured spheres represent protein associations. The associations are depicted in 7 different colours. A red line indicates the fusion evidence, a green line indicates neighbourhood evidence, a blue line indicates the co-occurrence evidence, a purple line indicates experimental evidence, a yellow line indicates text mining evidence, a light blue line indicates database evidence, and a black line indicates co-expression evidence. In confidence mode, the thickness of the line indicates the degree of confidence prediction of the interaction. Action mode gives additional information regarding the prediction, such as binding, activation, etc. The PE_PGRS17 protein Fig. (5A) has close interactions (3 coloured lines) with two proteins, namely PPE34 and PPE24.
Due to this relationship, the predicted functional abilities of PE_PGRS17 are seen to be directly related to the immune response of tuberculosis. The protein induces maturation and activation of human dendritic cells (DCs) via TLR2-dependent activation of ERK1/2, p38 MAPK, and NF-kappa-B signalling pathways, and enhances the ability of DCs to stimulate CD4 (+) T cells. The activation of DCs potentially influences the initiation of the innate immune response during tuberculosis infection, and hence regulates the clinical course of Mtb. The PE_PGRS31 has two neighbouring proteins, Rv1766 and Rv1771, in which it has a strong association, as shown in Fig. (5B). Rv 1766 is a conserved protein. Rv 1771 encodes L-gulono-1,4-lactone dehydrogenase responsible for producing vitamin C within Mtb Bacillus. This enzyme belongs to the oxygen-dependent FAD-linked oxidoreductase family. It can oxidize L-gulono-1,4-lactone to L-xylo-hexulonolactone and spontaneously isomerize L-ascorbate. Vitamin C supports many functions in a functioning cell. PE_PGRS31 can be predicted to be involved in this process (Fig. 5B).
The protein, PEPGRS50, has many associations with PPE proteins, as shown in Fig. (5C). Most of these proteins are uncharacterized, and therefore, their function is unpredicted. It is strongly associated with PPE8, although the function of this protein is not determined. Protein PPE54 is predicted to play a role in host phagosome maturation arrest. The vacuole of the mycobacterial phagosome can retain markers derived from the plasma membrane in Mtb [38]. The PE_PGRS50 protein has close relations to the PPE28 protein, which is predicted to be found in the outer membrane. It can be assumed that the PE_PGRS50 protein has a function in the outer membrane. The PE_PGRS54 protein is predicted to be related to a vapB2 protein Fig. (5D). This protein has a predicted role as an antitoxin component of a possible type II toxin-antitoxin (TA) system. The PE_PGRS54 protein can have a function in this system. Understanding the protein-protein interaction confers knowledge of every process occurring within a living cell.
| Antigenic properties | PE_PGRS Family Protein | |||
|---|---|---|---|---|
| PE_PGRS17 | PE_PGRS31 | PE_PGRS50 | PE_PGRS54 | |
| Residue Length | 331 | 618 | 1538 | 1901 |
|
Antigenic Score |
1.0245 | 0.9815 | 0.9473 | 0.9477 |
|
Antigenic Determinants |
9 | 16 | 49 | 51 |
| Threshold | 0.4 | 0.4 | 0.4 | 0.4 |
|
Overall Prediction for the Protective Antigen (Probable Antigen) |
0.8940 | 1.6788 | 2.4173 | 2.7388 |
|
Antigenic region Antigenic Peptide Tool /SVMTrip tool |
34-53 | 89-108 | 1125-1144 | 1348-1367 |
| Epitope | ATTQVLAAAGDEVSTAIAAL | VAEAATAQSVQQDLLNLINA | GSGGDGGGGISLGGNGGLGG | NTGLASAASGDGGNGGAGG |
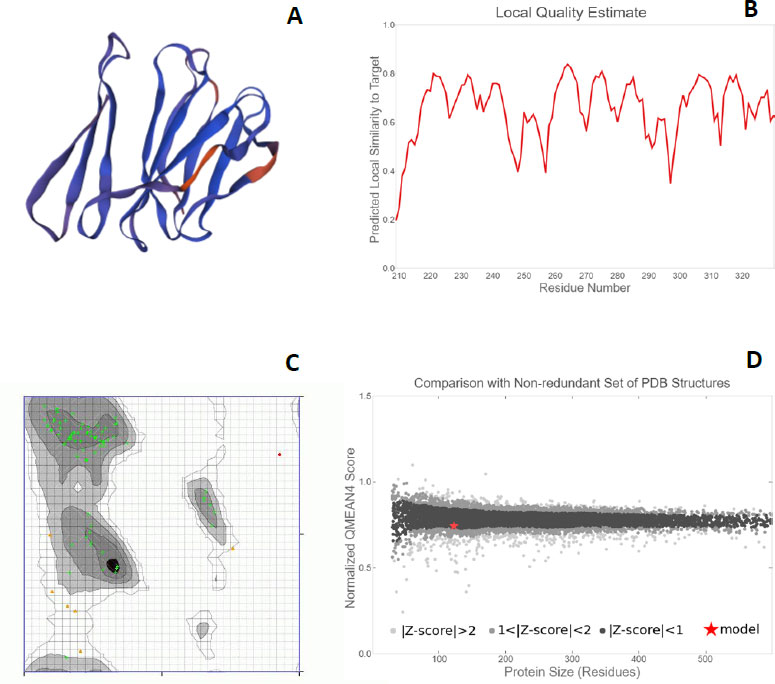
When modelling the structures of proteins, it is important to use tools that show the quality and reliability of these models [39]. In recent years, homology modelling has become a reliable part of genomics in the comparative modelling of several unknown structures [30]. A protein's interaction with other molecules or the function that it may carry out is dependent on its tertiary structure [39]. The SWISS-MODEL database is used to accurately predict three-dimensional structures of proteins. The program selects modelling templates automatically and aligns the unknown sequence with known related structures. Models for the four proteins were calculated, as seen in Fig. (6A-D), with the rate of identity with the model from PDB ranging from 28.57% to 47.50%. The general principle involved in modelling a protein is that the percentage identity between the template and query proteins should not be less than 30% [25].
Each protein backbone was evaluated using the Ramachandran plot (Fig. 6C), which is described as an X-Y plot of the Phi and Psi dihedral angles. These angles are between the N-Cα and Cα-C peptide bonds present in the protein backbone. These angles rotate freely in the proteins. Many of the combinations that are possible from these angles are seldom seen due to the steric hindrance in the backbone makeup of proteins [39]. For the proteins PE_PGRS17, PE_PGR31, PE_PGRS50, and PE_PGRS54, a high percentage of amino acids fall in the favoured region of the plot [26]. There are fewer outliers, thus deeming the predicted structures to be of relatively good quality. The quality can be further investigated by the QMEAN (Qualitative Model Energy Analysis) score. These scores are calculated as z-scores, which are good indicators of model quality. The ‘Local quality’ plot compares each residue in the structure to the native structure. The PE_PGRS proteins being examined in this study have QMEAN scores greater than 0.6 (Fig. 6B). Any value above 0.6 is indicative of high quality.
From a ‘Comparison plot’ (Fig. 6D), a structure model can be further assessed. In these plots, model quality scores in individual models are compared to scores gathered for experimental structures of similar size. The y-axis represents the normalized QMEAN score. Each dot on the plot signifies one experimental protein structure. The colour of the dot varies to characterize a normalized QMEAN score within a specific standard deviation. Dark grey dots/zones are experimental structures with z-scores between 0 and 1, whereas light grey dots/zones are z-scores between 1 and 2. Structures that are further away from the calculated mean are within even lighter areas. A red star on the graph is representative of the actual model. If a model is close to the dark grey zones, it is considered a good model. The model for the PE_PGRS17 protein is found in the dark grey area, thus, deeming it to be a good estimated model. The models for the proteins PE_PGRS31 and PE_PGRS54 lie in the light grey areas, showing low validity of these models. The model for PE_PGRS50 protein is seen outside the grey zone, making it invalid. An understanding of these interactions improves the understanding of pathogenesis. This information stipulates the basis of novel therapeutic ideas. These predicted tertiary structures can be used in further studies, such as drug design prediction. Considering all the predictions estimated in this study, PE-PGRS17 shows the most promise for further research. Further studies could include protein docking studies and immunization prediction studies to assess the potential aspects for drug design or a vaccine target.
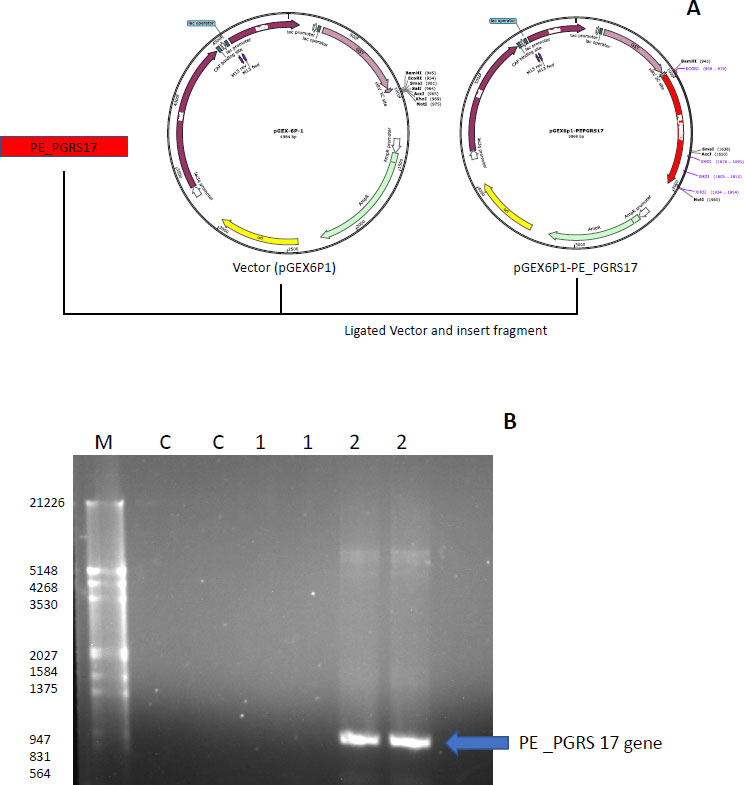
The strategy used to insert the PE_PGRS17 gene into the vector pGEX-6P-1 is displayed in Fig. (7A), where restriction enzymes were primed onto the ends of the DNA insert and ligated into the pGEX-6P-1 vector. The gene was confirmed using PCR analysis, and the result was run through a 1% agarose gel (Fig. 7B). A distinct band is in the lane labelled 2, which includes the GC enhancer solution. The gene is sequenced to contain 996 base pairs, and the band falls around that range according to the molecular marker. PE_PGRS proteins are GC-rich proteins that are generally harder to amplify. GC-rich sequences have higher melting points caused by hydrogen bond strength and secondary structures, hindering the amplification of the sequence [40]. The generation of secondary structures, such as hairpins and knots, halts primer annealing during PCR and leads to a premature extension of the sequence [40]. GC enhancers contain DMSO, which resolves the secondary structure by assisting in binding minor and major grooves of the DNA strands [40].
The Rosetta strain is a derivative of the BL21 strain and contains chloramphenicol resistance. The strain possesses specific TRNA codons able to enhance expression. The expression strain, E. coli Rosetta, was made chemically competent using the heat shock method. The pGEX-6P-1 containing the PE_PGRS17 gene insert was successfully transformed into the competent Rosetta strain. A control was also made using distilled water. Immediately after transforming, the sample was spread onto an antibiotic infused-LB medium plate. No growth was seen on the control, indicating no contamination. A single colony was inoculated in culture, and glycerol stocks of these cells were made up and stored in a bio-freezer at -80°C. The growth was necessary for the rest of the expression and purification.
Expression profiling begins with an overnight culture that is inoculated into the media and left to incubate. Antibiotics, ampicillin and chloramphenicol, were used during all expression studies. After mid-log phase growth has been reached (0.4-0.6 OD), the culture was induced with IPTG (Isopropyl β-D-1-thiogalactopyranoside) to optimize the expression of the protein. IPTG is commonly used in expression systems as it contains a lac promoter, lac operator, lac repressor in combination with T7, and other variations of promoters to help improve gene regulation [41]. The use of an IPTG inducible system in mycobacterial membranes has been widely popular due to its ability to express downstream genes [41]. Different concentrations of IPTG were used to optimize the expression of the pe_pgrs17 gene Fig. (8A-D). A 1mM concentration of IPTG (Fig. 8C) was preferred, but a western blot analysis is needed to confirm this result. An uninduced culture is always run alongside all induced cultures to provide control. Absorbance readings were read at specific time intervals and temperatures (Fig. 9) and using 3 different mediums Fig. (10) to optimize the growth time. The absorbance of the culture at any time interval was used to calculate the amount of lysis buffer to be added to the sample. The lysis buffer was added after the sample was centrifuged. The samples were then stored for further analysis using SDS PAGE electrophoresis. Fig. (10A) shows a clear band for the induced sample at approximately 57kDa.
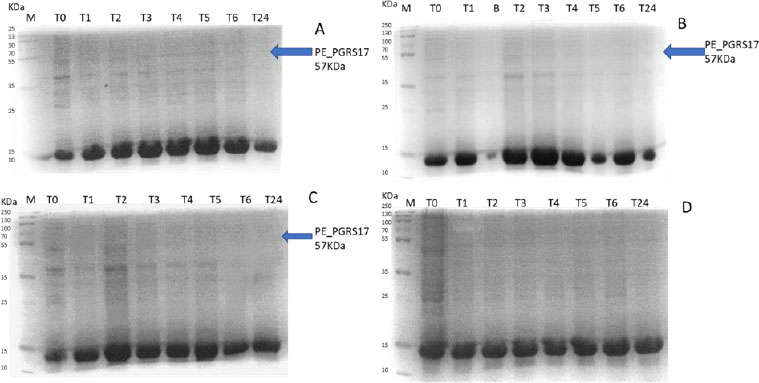

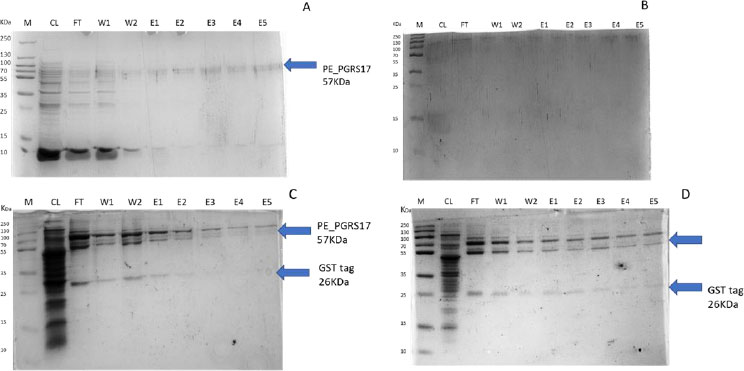
After analysing the results, LB media growth at 370 C was induced after 2 hours (mid-log phase), which is the preferred growth condition. During observation, the expression was noted to be controlled and there was minimal loss to the plasmids. A western blot analysis is required to confirm this result. The next step of the analysis is large-scale expression for large-scale purification. The presence of higher bands could have resulted from molecules that are linearized. This occurs when samples are heated incorrectly or the running buffer is made incorrectly. The glutathione superflow agarose provides a quick and easy method to purify recombinant proteins. After assessing the optimized method for cell growth in the expression step, cultures were grown and pelleted down for the purification step. The recombinant PE_PGRS17 protein is a GST (glutathione S-transferase)-tagged protein that has a molecular weight of 26 kDa. Samples obtained during native purification, seen in Fig. (11A and B), were run using just the superflow agarose resin, equilibration/binding buffer, and elution buffer. The results showed low purification yields during the SDS-PAGE analysis, and no bands were seen in the western blot analysis. High levels of expression may cause proteins to aggregate, producing inclusion bodies that seize the biological activity of the protein [42]. This may be due to the lack of posttranslational modifications machinery resulting in insoluble proteins. In the case of PE_PGRS proteins, their GC-rich sequence contributes to the aggregated protein. Solubilization and refolding of the protein may assist in reducing aggregated protein [42]. To increase the yield of protein during purification, a solubilisation strategy was included in the next set of purification steps.
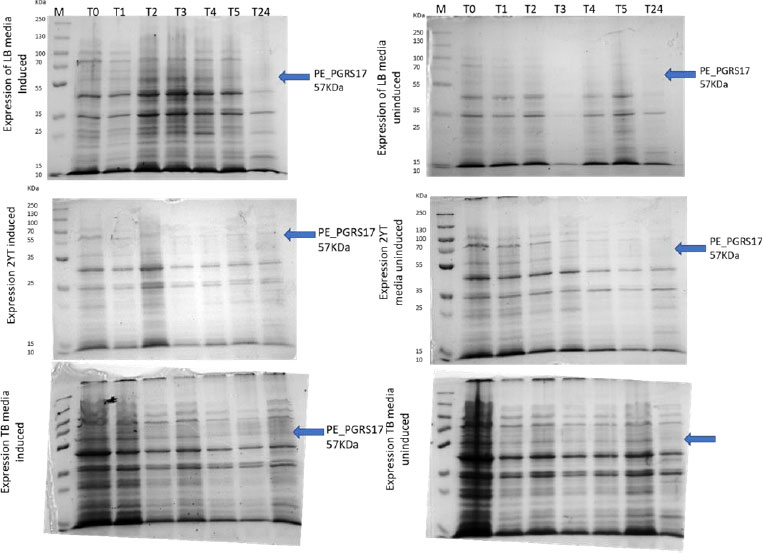
Fig. (11C and D) show the result of the solubilization and refolding of the protein before the purification step. Solubilization is achieved by using a buffer that is of high urea concentration, which provides a mechanism to decrease non-covalent bonds within the protein molecule [43]. Refolding the denatured protein will help reinstate its biological activity. Other methods that may aid the E.coli host to produce soluble proteins are lower expression temperature conditions and co-expression with chaperones [44]. In this method, dialysis was used to remove the denaturant for the protein to refold itself [43]. The purification step, referred to as the GST pull-down method, can then continue as usual. At first, the GST-tagged proteins exhibited a higher affinity to the glutathione agarose resin [45]. The protein sample was treated with a equilibrium/binding/wash buffer to remove any contaminating proteins and unbound proteins. To retrieve the protein from the agarose resin, an elution buffer consisting of a high amount of reduced glutathione was used. The elution buffer holds a higher affinity to the agarose resin and allows the protein to flow into a collection tube. A native purification step was then conducted (Fig. 11A and B, which resulted in no bands. The result was analysed by SDS-PAGE analysis, and in Fig. (11D), we can see the protein bands as well as the GST tag.
CONCLUSION
In this study, PE_PGRS17, PE_PGRS31, PE_PGRS50, and PE_PGRS54 proteins were functionally and structurally investigated using various in silico tools. In a systematic approach, the study analysed each protein’s physiochemical properties, subcellular localization, three-dimensional modelling, multiple alignment strategies, antigenic properties, and protein-protein interaction. In light of the above-mentioned parameters, the functional and binding capabilities of each protein were reviewed. This led to a better understanding of the biological role they may play within Mtb. The conducted study could provide some pertinent and pioneering information for future studies, which could herald a breakthrough for the scientific community researching treatment. Protein PE_PGRS17 appears to possess the most promise for advances in further studies based on the insight gained from the present study. This study also focused on optimising expression and purification conditions of the PE_PGRS17 protein found in Mtb. The study showed that solubilizing and refolding strategies can be reliably used to purify the GC-rich protein, PE_PGRS17. This strategy can be used in future studies involving other G C-rich proteins.
AUTHORS’ CONTRIBUTION
A.MR conducted the research and has written the manuscript. T.E.C and O.J.P helped to draft the manuscript and supervised the work.
LIST OF ABBREVIATIONS
| Mtb | = Mycobacterium Tuberculosis |
| WHO | = World Health Organization |
| MDR | = Multidrug resistant |
| AI | = Aliphatic index |
| SLiMs | = Short linear motifs |
| MSA | = Multiple sequence alignment |
| SOPMA | = Self-Optimized Prediction Method with Alignment |
| PCR | = Polymerase chain reactions |
| SDS-PAGE | = Sodium dodecyl-sulfate polyacrylamide gel electrophoresis |
ETHICS APPROVAL AND CONSENT TO PARTICIPATE
Not applicable.
HUMAN AND ANIMAL RIGHTS
Not applicable.
CONSENT FOR PUBLICATION
Not applicable.
AVAILABILITY OF DATA AND MATERIALS
The data supporting the findings of the article is available in the Zenodo Repository at https://zenodo.org/record/ 7566190#.Y9APF3ZByMo.
FUNDING
The Council for Scientific and Industrial Research (CSIR) provided funding for this study.
CONFLICT OF INTEREST
The authors declare no conflict of interest, financial or otherwise.
ACKNOWLEDGEMENTS
The authors would like to thank CSIR (www.csir.co.za) for financially supporting this study and Professor K G Moodley (adjunct professor in the Faculty of Management Sciences, Durban University of Technology) for a primary review of this manuscript.

