
Decision-making Support System for Predicting and Eliminating Malnutrition and Anemia
Authors Info & Affiliations
Abstract
Aims:
This study investigates predicting and eliminating malnutrition and anemia using ML Algorithms and comparing all the methods with various malnutrition-based parameters.
Background:
The health of the nation is more important than the wealth of the nation. Malnutrition and anemia are serious health issues but the least importance is given to eradicate them.
Objective:
Proper nutrition is an essential component for the survival, growth, and development of infants, children, and women who in turn give birth to infants.
Methods:
In the proposed system, machine learning approaches are utilized to predict the malnutrition status of children under five years of age and anemia in men and women using old datasets and further providing a suitable diet recommendation to overcome the disease. Classification techniques are being used for malnutrition as well as anemia prediction.
Results:
Algorithms such as Naïve Bayes classifier (NBC), Decision Tree (DT) algorithm, Random Forest (RF) algorithm, and K-Nearest Neighbor (k-NN) algorithm are utilized for prediction. The results obtained by these algorithms are 94.47%, 85%, 95.49%, and 63.15%. When compared, Naïve Bayes and random forest algorithm provided efficient results for malnutrition and anemia, respectively.
Conclusion:
By testing and validating, preventive actions can be taken with the help of medical experts and dieticians to reduce malnutrition and anemia conditions among children and elders, respectively.
1. INTRODUCTION
In developing countries, malnutrition and anemia are considered major setbacks. According to the Global Hunger Index (GHI) of 2019, in children below the age of five, at least one in five suffers from waste, and almost 44% of children are underweight in Brazil, Russia, India, China, and South Africa (BRICS), around 52% of married women suffer from anemia in India alone. Going further, if a woman is diagnosed with anemia during pregnancy it may lead to premature childbirth or the child may become anemic, or sometimes it also has the risk of infant death. In malnutrition, there are three types: under-nutrition, micro-nutrition, and over-nutrition. Undernutrition includes wasting meaning low weight for height, stunting meaning low height for age, and underweight meaning low weight for age. Micro-nutrition is caused either by an excess or deficiency of vitamins and minerals in the diet. Over-nutrition causes obesity and some diet-related non-communicable diseases, sometimes it can also lead to a neurological disorder such as spiny dendrites [ 1, 2]. Just like malnutrition, anemia can be classified into five types aplastic anemia, iron deficiency anemia, sickle cell anemia, thalassemia, and vitamin deficiency anemia.
Aplastic anemia, sickle cell anemia, thalassemia, and vitamin deficiency anemia are caused when the blood cell production is reduced, a disorder in red blood cells or less number of healthy red blood cells, reduced hemoglobin in red blood cells, and lower amount of vitamins than the required amount in red blood cells, respectively. Iron deficiency anemia is caused due to the deficiency of the mineral called iron and is the most common type of anemia in women and it can be easily treated by just making some changes in the diet of the patient. Predicting and vanquishing this problem seems to play a vital role in strengthening the nation. Considering the present pandemic situation, there is a large decline in the health of people as the GDP of every country is affected, which indirectly affects the food supply chain, due to these circumstances, neither malnutrition nor anemia is going to any better place. Hence, an efficient method and technology are required to overcome this problem. In the current world, technology is growing exponentially. Utilizing different technologies, today, almost all problem statements have different solutions. Similarly, there are various solutions for this problem, but it is important to analyze which methods can effectively help to overcome malnutrition and anemia. In regard to the prediction of any kind of disease, irrespective of species (animals or birds), machine learning techniques are quite famous [ 3, 4]. Similarly, there are few classification techniques that use the anthropometric index and clinical data to predict malnutrition. Even anemia uses classification techniques like regression, Support Vector Machine (SVM) [ 5], and sometimes even clustering algorithms for prediction. Image processing techniques have restored their position at the top in regard to disease prediction [ 6]. Similarly, anemia can also be predicted utilizing image processing with a blood sample or images of the conjunctiva.
The flow of this paper is prepared as follows. Section 2 reviews the existing techniques used in the prediction of malnutrition and anemia. Section 3 describes the methodology used in the proposed system. Section 4 lists the results of the proposed system. Section 5 gives the conclusion.
2. LITERATURE SURVEY
2.1. Prediction using ML Algorithms
In machine learning, there are four different learning techniques supervised learning, unsupervised learning, semi-supervised learning, and reinforcement learning. When we consider prediction, the most used learning type is supervised learning. A comparison was proposed among 5 different machine learning algorithms for the prediction of malnutrition [ 7]. Algorithms such as Linear Discriminant Analysis (LDA), k-NN, SVM, RF, and Logistic Regression (LR) are used, which come under the supervised technique. All these algorithms are considered to have set their standards in the machine learning domain. LDA is one of the most used dimension reduction techniques for data extraction [ 8], but it is very sensitive to external noise and it has less interoperability [ 9]. k-NN is a simple and efficient learning algorithm and it is also called a lazy learning algorithm [ 10]. In k-NN, the classification is done by calculating the Euclidean distance of every data sample and based on the nearest neighbors, new data samples are classified. SVM is used for both classification and regression problems. They classify the new sample by segregating the given data sets into classes. The RF algorithm [ 11] is derived from ensemble learning, meaning that more algorithms are combined to increase the efficiency of classification or prediction. LR is usually used in classifying categorical dependent variables and the outcome of this algorithm is always a probabilistic value.
Predicting malnutrition in a child depends on many factors like Body Mass Index (BMI), mother's education, wealth index of the family, place of residence, Division, Mother's BMI, birth interval with respect to the mother’s age, and here in the proposed approach, these factors are used as parameters. Totally 5,147 training data sets and 1,716 testing data sets were considered. Based on the Weight-for-age Z score (WAZ), the data sets were classified into malnourished and nourished. These training data sets were applied to all above supervised techniques and 10-fold cross-validation was used to get accurate results.
It can be observed that many performance factors are considered, that is, accuracy, Cohen's k, sensitivity, and specificity. Accuracy is used to observe the performance of the algorithm for both training and test data sets. Similarly, Cohen's k is agreement static. The value of Cohen's k varies between 0 and 1, 0 is considered as no agreement, and 1 is considered an almost perfect agreement. Sensitivity here is calculated by dividing true-positive data samples by the sum of true-positive and false-negative data samples. Similarly, specificity is calculated by dividing true-negative data samples by the sum of true-negative and false-positive data samples. On comparison of the values of all algorithms, the RF algorithm is considered the most efficient algorithm or supervised learning technique among all five algorithms as the specificity and sensitivity for both training and testing datasets are higher in comparison with other algorithms [ 7].
2.2. Prediction of Nutrition Status using Anthropometric Index
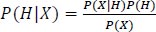
In a study [ 12], the authors have discussed the performance of two classification algorithms. One is the Naïve Bayes Classifier (NBC) algorithm and the other is C4.5 algorithm. The NBC is one of the most used and most efficient algorithms [ 13]. It works efficiently for real-time data when compared with other classification techniques. The general form of NBC is shown below:
 |
(1) |
where X denotes data with unknown classes, H denotes that X hypothesis is a specific class. P( H| X) is considered as the posterior probability and P( X| H) is the probability of X based on H condition. P( H) and P(X) are the probabilities of H and X, respectively. C4.5 algorithm [ 14] is also known as the statical classifier and is used in the generation of the decision tree. The main advantage of using this algorithm is it deals with noise in the data, is easy to implement, easily understandable, and can be used for both categorical as well as continuous values. The general formula used to find entropy is given below:
 |
(2) |
Where S is a dataset, n is the number of partitions in S, Pi is the proportion of S. To measure the nutritional status of a child or a toddler, an anthropometry index can be used. Anthropometry index consists of measurements like BMI, age, height, weight, weight-for-age, height-for-age, weight-for-height, and BMI-for-age, which are considered as attributes in this experiment. The outcome is divided into five different classes very thin, thin, normal, fat, and very fat. Around 530 data samples are considered for this experiment and the first step is to clean the data and the data samples. It was found that only 430 data samples were fit for the training and testing purpose. In the next step, the algorithms were applied to the data samples and finally, the test data were evaluated using the Rapid Miner tool, and confusion matrix evaluation was performed to observe accurate results in both algorithms. On comparing the results obtained by these algorithms, it was observed that the C4.5 algorithm was more accurate by 0.93% than the Naïve Bayes classifier [ 12].
2.3. MUST-plus
MUST-Plus [ 15] is a machine-learning version of the Malnutrition Universal Screening Tool (MUST) [ 16]. It is a screening tool used to measure the nutrition status of adults (18 years and above). Earlier along with MUST, screening tools such as Malnutrition Screening Tool (MST) and NRS-2020 (Nutritional Screening Test) [ 17] were used. In MUST, the measurement ranges from 0 to 6, if the MUST score is 2 or above, then it is considered that the individual has a risk of getting malnutrition or has a nutrition related problem. Due to limitations like methodological errors, invalidation, and no generalization of inpatient data, the performance of the MUST is limited. As discussed before, an ensemble learning method called RF algorithm [ 11] is being used in the experimentation along with MUST to improve the screening technology and it was called MUST-Plus. In this proposed system, the nutrition status of the hospitalized patients is used as data samples. These data samples were divided into 3241 training data and 5238 testing data. Fifty-three variables were used in the RF algorithm. By applying 10-fold cross-validation, a final list of 33 variables with 278 features were used for training purpose. Some of those variables are as follows, age, gender, BMI, hemoglobin, serum albumin, length of stay, serum potassium, blood urea nitrogen, serum creatinine, and serum alanine aminotransferase. On comparing the results of MUST and MUST-Plus like sensitivity, specificity, and accuracy, it was observed that MUST-Plus performed much better [ 15].
2.4. Estimation of Anemia using Macro-lens and Hbmeter
Giovanni et al. [ 18] proposed a device that helped them in capturing the images of the conjunctiva. The main motivation was to stop taking blood samples to do the test and rectify if the patient was suffering from anemia or not as it was a tedious job. Previously, a device called Colorimetric tool [ 19] was used to predict anemia by capturing the palpebral conjunctiva. Later, a software called Personal Digital Assistant (PDA) [ 20] which utilized grey cards along with RGB values to find Hemoglobin (Hb) levels, was used. In the proposed system the device contains a macro lens, which is attached to the rare camera of the smartphone to improve the quality of the captured image. This macro-lens is a modified version of the Aukey PL-M1, a 25 mm, 10X lens including a satin glass spacer. A software called Hbmeter is also designed for the smartphone to accurately detect anemia using the images captured.
Once the image is captured, both images and the calculated index required for the examination are automatically sent to the doctor through e-mail. In macro-lens, LED lights have also been installed to capture the image with the same color reference so that Hb concentration can be found easily. To select the valid conjunctiva image for all images captured, the SLIC algorithm [ 21] is used. To analyze the captured image before selection, the CIELAB (CIE L*A*b) color model is used, which contains all ranges of human colors. These analyzed images are then compared with different Hb-level images with different color ranges, based on which the outcome is decided. If Hb < 10.5 g/dl, then it is considered that the patient is at high risk of having anemia, if 10.5 < Hb < 11.5 g/dl, then it is considered doubtful, if Hb > 11.5 g/dl then it is considered that the patient is at low risk of having anemia. The supervised learning technique k-NN was used to obtain precise results instead of taking blood samples to the lab, and then 10-fold cross-validation was also implemented on 113 patient data samples in this experiment. It was found that the proposed system performed well.
2.5. Prediction of Clinical Signs of Anemia using Conjunctiva Images
Giovanni et al. [ 22] again proposed a new method to give a precise result in the prediction of anemia. First, they discussed how anemia is caused and what are its symptoms, and how technology can be used to predict anemia in a patient. Erythropoiesis [ 23] is a mechanism that occurs in our body to produce erythrocytes from blood, and a protein found in erythrocytes is responsible for transporting oxygen to all tissues of the lungs. If there is any deficiency of iron, vitamin B12, or incorrect synthesis of hemoglobin, then it may lead to less production of erythrocytes and which in turn reduces the oxygen supply to tissues and blood cells causing anemia. Some of the symptoms that occur recurrently in anemia are fatigue, headache, pale skin and tongue, increase in respiratory rate and heart rate, conjunctival pallor [ 24, 25], etc. To predict this disease, many methods were proposed like finding the relation between the pale fingernail tips and the hemoglobin concentration in blood [ 26, 27], HemaApp [ 28], which helps in monitoring the Hemoglobin levels, prediction based on the redness of the conjunctiva using a head-mounted device containing raspberry pi card, camera modules and LED lights [ 29], identifying the image margins using Gaussian filter and edge detector algorithm. In the proposed system, a device called conjunctiva acquisition is used, which is similar to the macro-lens is designed, but this device is faster and more precise, robust, user-friendly, and affordable. This is connected to the rare camera of smartphones, which capture the images. Software is set up to provide the history of the patient, the image captured, and the required data is sent to the doctor. The device makes sure that it has captured a high-quality image of 24 bits/pixel, if the image captured does not show the conjunctiva properly, then such images are discarded.
Once the image is captured to select the best one, a segmentation algorithm called SLIC [ 21] is used. After the selection of the images, a manual selection of conjunctiva was done using different classification techniques like Naïve Bayes classifier, Decision Tree algorithm, SMO, Adaboost, one rule classifier, k-NN, Logistic Regression, LogitBoot over a data set of size 102. Amongst the 102 data samples, 25 samples had a risk of anemia and 77 samples were safe. Even though it produced good results, it wasn't satisfactory as there was some imbalance in the learning. For example, by preparing a confusion matrix for the k-NN algorithm, it was found that the false-negative situation had occurred 11 times, which in fact must be very minimal like 0. To avoid an imbalance in the supervised learning technique, two balancing algorithms called ROSE and SMOTE are utilized here. ROSE [ 30] is a bootstrap-based method and SMOTE [ 31] is the oversampling approach. Both methods are used to remove the imbalance in the dataset so that the classification techniques work better. It was found that among 354 data sets (4 iterations), 154 data sets were considered safe and 200 data sets were at risk. When the performance of the classification algorithms was compared, k-NN had performed well. Similarly, the ROSE method was considered for 347 data sets, among which 127 data sets were considered safe and the remaining 127 data sets were at risk. Again, the k-NN algorithm performed better than other classification techniques with a precision of 0.955. In both methods, the false-negative condition was found to be minimal, that is, 0, and when ROSE and SMOTE algorithms were compared, it was found that the SMOTE algorithm was more effective than the ROSE algorithm [ 22].
2.6. Estimation of Anemia using Key-sight Slim Probe and SVM
Adam et al. [ 32] proposed a device that works at microwave frequencies, utilizing the dielectric property of human blood to predict if a person is affected with anemia. Previously many methods were used like, Cyanmethemoglobin (Hemoglobin-Cyanide) [ 33], which is an optical technique used to find the hemoglobin concentration and it requires a sophisticated lab. Then, a method called HemoCue [ 33] came into the picture where the blood samples were kept in a HemoCue photometer in a microcuvette and calculated the concentration of hemoglobin but it wasn't affordable for investigating large samples together. In the proposed system, the device is designed in such a way that it is of low cost. This uses microwave measurements which is contradictory to the cyanmethemoglobin method. To find the hemoglobin concentration, some chemicals will be added to the proposed system, considering the dielectric property of blood, the microwave frequency is used. The sensor was designed with a frequency of 9.4 GHz and it does not mix any chemical with the blood sample and is a non-destructive method to find the concentration of hemoglobin in blood [ 34]. Similarly, a 1GHz single microwave frequency is used in this device. It also contains a key-sight slim probe that uses a key-sight network analyzer to measure the hemoglobin concentration by keeping the blood samples in the vacutainer tube. The network analyzer is used to decrease the uncertainty in the system. To classify the blood samples after finding the hemoglobin concentration, SVM is used. This algorithm deals with binary classification similar to the proposed system, it is used to classify the data samples either as healthy data samples or anemic data samples. Here, 80 samples from male patients and 96 samples from female patients, when summed up, a total of 176 patient samples were used in experimenting with the classification algorithm. About 90% of the total data were considered as a training data set which after execution underwent 10-cross validation with the help of Bayesian optimizer and 10% of the data samples were considered as test data samples and it was observed that the results had 96.89% of sensitivity and 94.56% of specificity.
2.7. Anemia Detection using Camera-based Spectrometry
A digital camera-based spectrometry was proposed by Halder et al. [ 35] to detect anemia at early stages. This device uses Point-of-care settings to provide a device that is of lower cost. Here, a whole blood sample of 10 µL from 300 people was used as a data set for the detection of anemia. This device was built based on the principles of Beer-Lambert law [ 36, 37] and it is used to find the concentration of hemoglobin C in a microcuvette, which can be represented as follows,
 |
(3) |
where Io is the reference cell, I is the sample cell, E is the molar absorptivity of blood and l is the thickness of blood film. Healthy Oxygenated hemoglobin absorbs the light of wavelengths between 570nm - 631nm and this differential absorption wavelength can help in the calculation of the concentration of hemoglobin. Hence, in this approach, the device has two LED lights with a wavelength of 570nm which is green light, and another one is a of wavelength 631nm which is red light. Each LED light is provided with a pinhole to avoid the scattering of light other than the blood film in the microcuvette. These LED lights are connected to an electrical circuit to control the intensity of the light. This electric circuit has a controller like Raspberry Pi wherein a Python program is written to control the light intensity and there are two webcams used in the proposed system to capture the photos that are transmitted through the microcuvette, which is converted to the greyscale image to get the count of the number of photos with respect to Area Under the Curve (AUC). Once it was calculated, the linear dependency with an automated Hematology Analyzer was calculated and a linear regression curve of 95% confidence interval and 95% prediction interval was found. Hence, providing a good screening device to detect anemia.
2.8. Non-invasive Hemoglobin Estimation
Acharya et al. [ 38] proposed a non-invasive method for identifying anemia in women between the ages of 17 and 52 years. Hemoglobin contains two major moieties and two minor moieties. The major moieties are oxygenated hemoglobin (HbO2), deoxygenated hemoglobin (RHb) and the minor moieties are carboxyhemoglobin (HbCO) and methemoglobin (HbMet) [ 39]. Each of them absorbs light of different wavelengths and their coefficients vary between 570nm and 1000nm. In designing this device, the Beer-Lambert law was used for sensing the hemoglobin in PPG. The patient places a finger inside the PPG in the middle of the LED light and a photodetector. The LED light was emitted in programmed intervals for 60 seconds where the wavelength of light that was absorbed by the finger was noted by the photodetector and was de-multiplexed into four PPG signals. These signals were used as inputs to the machine learning classification techniques to predict if the patient was suffering from anemia or not. Many features such as attenuation (de-multiplexed signals), sum of Hb moieties, age, and pregnancy status were used for training purposes. In the proposed system, the classification technique used is called the stacked regressor model. This model consists of two layers, one is the regression model and the other one is meta-regressor that is, the support vector regressor. The regression models used in the first layer are LASSO Regression [ 40], Ridge Regression [ 41], Elastic Net Regression [ 42], and Ada Boost [ 43]. These regression models are used for feature selection and optimization. A total of 1583 data samples from women whose ages varied from 17-52 years were used for prediction and 80% of the data was considered for training and 20% of the data was used for testing purposes. After the execution of the classifier, if the Hb level was less than 7 g/dL, it was considered that the patient was severely anemic, if the Hb value varied between 7-9 g/dL and 9-11 g/dL then the patient was moderately anemic and mildly anemic, respectively and if the Hb level is greater than 11 g/dL, then the patient was considered healthy.
In sections 2.1-2.3, it can be observed that there are various algorithms used to predict malnutrition in children. The major disadvantages in these papers were that only the presence of malnutrition was being concentrated and there was no mention of which type of malnutrition the child was suffering from. In sections 2.4-2.8, it can be observed that there are few efficient non-invasive methods that are being currently used to predict anemia in women and children. These papers need the physical existence of the patient and a gadget to predict anemia. It is good to have a method that gives accurate and effective results and is also cost-effective.
3. THE PROPOSED SYSTEM
As discussed before, the eradication of malnutrition and anemia should be given more importance as a large number of population is affected by them. The main objective of the proposed system is to provide a medical sector application useful for both government and corporate hospital doctors as well as nutritionists which predicts and eliminates both malnutrition and anemia. Here, for the prediction of malnutrition, 2 classification algorithms, Naïve Bayes, and Decision Tree have been compared. Similarly, for anemia prediction, k-NN and Random Forest algorithms are compared. Based on the results obtained, the algorithm that gives the best result is considered.
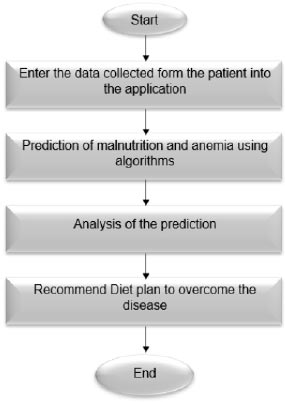
To eliminate these diseases, a diet suitable to the predicted disease is provided to the patient and the flowchart of the same can be seen in Fig. ( 1). The proposed system uses the old patient's data with different parameters to build an application that is cost-free and real-time which can be used to predict both malnutrition and anemia.
3.1. Methodology
In the proposed system, the supervised learning technique is used for the prediction of malnutrition and anemia. In supervised learning, the best suitable algorithms such as Naïve Bayes Classifier, Decision Tree, k-NN, and Random Forest algorithms are being used. As discussed before, in this paper, NBC and C4.5 algorithms are being used for malnutrition prediction and k-NN and RF algorithms are being used for anemia prediction. In the following sections, each algorithm will be discussed one by one.
3.1.1. Naïve Bayes Classifier (NBC) Algorithm
The Naïve Bayes classifier algorithm is one of the most used algorithms in supervised learning. It is most suitable for real-time data samples as it takes very little time for execution and it is suitable for multi-class prediction. It also works better than logistic regression as it will assume the missing data based on previous experiences. This algorithm classifies each feature independently. Here, in the proposed system, we are using this algorithm for malnutrition prediction. First, we will be scanning the training dataset and the test dataset of the algorithm. Let S be an array list containing the outputs, i.e., in the proposed approach we are considering 4 outputs, namely, 0 (normal), 1 (stunned), 2 (underweight), and 3(obese). Let s c be the count of s. Let m be the number of parameters used in the dataset, i.e., we have used 9 different main parameters like gender, age, weight, height, MUAC, WAZ, HAZ, WHZ, and interaction. Let p be the probability of s i.e.,
 |
(4) |
In the proposed system, as we have considered 4 different outputs, the value of p becomes 0.25. Then, we need to find n, n c, where n means the number of occurrences of the test attribute in the training data set and n c means the number of occurrences of the test attribute in the training dataset with respect to the outputs in s. In the next step, we have applied these values to the formula,
 |
(5) |
The P values must be found for all parameters and all outcomes. The P values of all test parameters m are multiplied by p for each outcome. Finally, the data sample is classified to the outcome which has the highest value. Hence, the test data sample will be classified to any one of these outputs.
3.1.1.1. Algorithm 1: Naïve Bayes Classifier
1. Read both training and testing dataset
2. Let s c be the number of outputs
3. Let m be the number of parameters
4. Let p be the probability of the outputs
5. for each attribute i less than s c
6. for each attribute j less than m
7. Find the value of attributes n c, n
8. end for
9. Apply the formula
P =

10. end for
11. Multiply the probabilities of each parameter by p
12. Compare the values and classify the outcome with the highest value
3.1.2. Decision Tree Algorithm
The Decision Tree algorithm also belongs to the supervised learning technique. This Decision Tree helps in data fitting, boosts the accuracy and has many algorithms under it. One of the most used algorithms is C4.5. Here, in the proposed system, similar to NBC, this algorithm is also used to predict malnutrition. First, we will be scanning the training and testing dataset of the algorithm. Let m be the number of parameters in the dataset. Here again, we have used 9 parameters as in the Naïve Bayes algorithm. Then, the information gain ( IG) of each attribute S can be calculated as follows:
 |
(6) |
By comparing the test attribute with the training dataset, it should be calculated for all parameters and all test data. Here, to calculate the information gain, we also need to calculate the entropy of each attribute S using pi, which is the probability of the number occurrence of parameters for different outcomes in the dataset and is calculated using the following equations.
 |
(7) |
Finally, each parameter and the parameter P with the highest normalized information gain is considered. Then, we need to identify the gain count of each outcome with respect to P. Hence, the given data sample is classified as the outcome with the highest gain.
3.1.2.1. Algorithm 2: Decision Tree (C4.5)
1. Read both training and testing dataset
2. Let m be the number of parameters
3. for each attribute i in m
4. Calculate the information gained from each parameter
5. end for
6. Repeat step 4 on all training dataset
7. Sort all the parameters
8. Parameter P with the highest information gain is found
9. The P with the maximum number of outcomes is considered the new node
3.1.3. Random Forest (RF) Algorithm
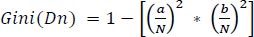
RF algorithm is a very simple as well as a flexible supervised learning technique. It is nothing but an ensemble of decision trees. This algorithm works well for real-time classification as it works on a subset of features. Here, in the proposed system, this algorithm is used for predicting anemia. First, the training and testing datasets are loaded to the algorithm. Let m be the number of parameters, i.e., we have used 11 parameters like age, gender, RBC (Red Blood cell Count), PCV (Packed Cell Volume), MCV (Mean Corpuscular Volume), MCH (Mean Corpuscular Hemoglobin), MCHC (Mean Corpuscular Hemoglobin Concentration), RDW (Red cell Distribution Width), TLC (Total Leucocyte Count), PLT (Platelets), HGB (Hemoglobin) in the proposed system. Each parameter P n in the test dataset must be split with respect to the randomly selected training dataset. Gini and Gini-split (Gini Index) for each of these splits must be calculated. For instance, in the proposed system we have considered two outputs in anemia prediction, i.e., 0 (normal) and 1 (anemic). Let a and b be the count of these outputs. Let us consider D1, D2, ..., Dn, to be split for each parameter. For each Pn, the Gini value is calculated as
 |
(8) |
where N is the count of the number of occurrences of the split in the training data set. Using the Gini value of different splits, the Gini-split of each parameter is calculated. The formula for the calculation of Gini-split is given below,
 |
(9) |
where NC= N1+ N2+ ... + Nn. Once this Gini-split is calculated from all splits of all parameters, the Gini-split with the least value is considered as the Gini Indexing is used to show the incorrectness of the algorithm. Finally, the test set is classified into the outcome containing the least Gini-split.
3.1.4. k-Nearest Neighbor (k-NN) Algorithm
k-NN is again a very simple and easy-to-implement supervised learning technique. This algorithm classifies the data in accordance with the measurement similarities. In the proposed system, the k-NN algorithm is used to predict anemia. First, the training and testing data are loaded into the algorithm. Let m be the number of parameters just like we have considered in the Random Forest algorithm and k be any nearest data point. Then, for all 11 parameters given in the test data, calculate the Euclidean distance of each training dataset parameter. The Euclidean distance is calculated using the following formula.
 |
(10) |
where x n, y n are the different parameters of the training dataset and x m, y m are the parameters of the test data sample. Once the distance is known, then sort d in ascending order and determine the k nearest points from the starting point. In the proposed system, we have considered the k value as 35 i,e. We will be considering the first 35 nearest neighbouring points. Hence, a new class is formed to which the test data sample can be classified.
3.1.4.1. Algorithm 4: K-Nearest Neighbor
1. Read both training and testing dataset
2. Let m be number of parameters
3. let k be nearest data point
4. for each attribute i in m
5. Calculate the Euclidean distance of each i from the attributes in training dataset
6. end for
7. Recur step 5 on all training dataset
8. Based on the distance value, sort in ascending order.
9. Choose the top k rows from the sorted array.
10. A class is given to the test attribute based on the least distance.
4. RESULTS AND DISCUSSIONS
The proposed system is software built using simple tools such as Visual Studio for programming the C# code and SQL Server Management Studio Express for storing the data that is outputted by the application. To store the datasets, both training and testing Microsoft Excel has been utilized. To run the application, the basic requirements are a Windows operating system, a minimum of 4 GB RAM, a 500 GB hard disk drive, and 5 th Gen i3-core Microprocessor.
4.1. Results of the Proposed System
As mentioned earlier, NBC and DT are being used for malnutrition prediction and k-NN and RF are being used for anemia prediction. After malnutrition prediction, any one of these 4 different outputs can be seen, i.e., 0 - Normal, 1- Stunned, 2 - Underweight, and 3 - Obese, and after anemia prediction, any one of these 2 outputs can be seen i.e., 0 - Normal, 1- Anemic. To find the performance of these algorithms, among the 1589 malnutrition datasets and 1799 anemia datasets which were collected from the hospitals and Anganwadi medical workers. Initially the data was unstructured hence it was cleansed by removing the duplications and fixing the structures that are giving the values as shown in Tables 1 and 3 to the different parameters. About 10% of the dataset is considered as the testing dataset, and the remaining 90% of the dataset is considered as training dataset.
| Parameters | Values |
|---|---|
| Gender | 1 (Male), 2 (Female) |
| Age | Below 5 |
| Weight | 1 (Low), 2 (Normal), 3 (High) |
| Height | 1 (Low), 2 (Normal), 3 (High) |
| Mid-Upper Arm Circumference (MUAC) | 1 (<11 cm), 2 (11 -13.4 cm), 3 (>13 cm) |
| Weight for Age Z-score (WAZ) | 1 (<-2 SD), 2 (Between -2 to 2 SD), 3 (>2 SD) |
| Height for Age Z-score (HAZ) | 1 (<-2 SD), 2 (Between -2 to 2 SD), 3 (>2 SD) |
| Weight for Height Z-score (WHZ) | 1 (<-2 SD), 2 (Between -2 to 2 SD), 3 (>2 SD) |
| Interaction | 1 (Hypo active), 2 (Active), 3 (Moderately active), 4 (Hyperactive) |
In Table 1, the parameters and their values utilized in the experimentation can be observed. Here, it is observed that both weight and height have numbers saying 1 (Low), 2 (Normal), and 3 (High). To determine the weight number, the weight values listed in Table 2, are to be compared. The weight number is set to 1 if the inputted weight is lower than the normal age. Similarly, if the weight of the child matches the values in Table 3, then the child is considered normal and the weight number is set to 2. If the height of the child is greater than the referred value, it is considered high and the weight number is set to 3. The same rules are used to determine the high number for each child.
| Factors | Female | Male | ||||||||
|---|---|---|---|---|---|---|---|---|---|---|
| Age (years) | 1 | 2 | 3 | 4 | 5 | 1 | 2 | 3 | 4 | 5 |
| Weight (kg) | 9.2 | 12 | 14.2 | 15.4 | 17.9 | 9.6 | 12.5 | 14 | 16.3 | 18.4 |
| Height (cm) | 74.1 | 85.5 | 94 | 100 | 107 | 75.7 | 86.8 | 95.2 | 102.3 | 109.2 |
| Parameters | Values | |
|---|---|---|
| Age | Between 10 - 90 years | |
| Gender | 0 (Male) | 1 (Female) |
| Red Blood Cells (RBC) | 4.7 - 6.1 million cells/µL | 4.2 - 5.4 million cells/µL |
| Packed Cell Volume ( PCV) | 38.3 - 48.6% | 35.5 - 44.9% |
| Mean Corpuscular Volume ( MCV) | 80 - 100 fL | |
| Mean Corpuscular Hemoglobin ( MCH) | 27 - 32 pg | |
| Mean Corpuscular Hemoglobin Concentration ( MCHC) | 32 - 26 g/dL | |
| Red cell Distribution Width (RDW) | 11.8 - 14.5% | 12.2 - 16.1% |
| Total Leukocyte Count ( TLC) | 4 - 11 *109/L | |
| Plateleds (PLT) | 150 - 450 *109/L | |
| Hemoglobin (HGB) | 13.8 - 17.2 g/dL | 12.1 - 15.1 g/dL |
Again, in MUAC, while measuring in the tape, if the arm circumference is less than 11cm, then the value is inputted as 1, if the arm circumference falls between 11 and 13.5cm then the value is inputted as 2 and if the arm circumference is higher than 13.5 then the value inputted is 3. Even the same applies to the WAZ, HAZ, WHZ, and Interactivity. The Z-score value here is considered by referring to WHO-declared values which can be accessed on their official website [ 44]. In Table 3, the parameters used in anemia prediction are explained with their clinical values which are accepted globally.
When these algorithms were loaded with these training and testing datasets as input, it was found that NBC provided an accuracy of 94.47% with 5.52% of incorrectly classified datasets and DT provided 85% accuracy with 15% of the incorrectly classified dataset.
Similarly, 1799 anemia datasets were considered for anemia prediction and the RF provided an accuracy of 95.49% and k-NN provided an accuracy of 63.15%. When the NBC and DT algorithms were executed for 1430(90%) training datasets and 159(10%) testing datasets, it was observed that the NBC algorithm took 7.86 sec for execution and provided an accuracy of 94.47% with specificity of 95.33%, sensitivity of 91.66% and F-score of 96.73%. The DT algorithm took an execution time of 4.10 sec providing an accuracy of 85% with specificity of 92.41%, sensitivity of 76.62% and F-score of 91.54%. Similarly, for anemia, 1619 (90%) training datasets and 180(10%) testing datasets were utilized and when observed, the RF algorithm performed well with an execution time of 2.66 sec and an accuracy of 95.49% with a specificity of 98.76%, sensitivity of 93.92% and F-score of 97.36% whereas the k-NN algorithm took 3.34 sec for execution and provided an accuracy of 63.15% with specificity of 91.68%, sensitivity of 79.13% and F-score of 77.67%, which can be observed in Tables 4 and 5.
To calculate the accuracy, the results obtained by the test dataset are compared with the outputs of the actual dataset. The performance measure also includes the time consumed for execution. To observe the time consumption and accuracy with respect to all four algorithms, many iterations were conducted for varying sizes of training datasets and testing datasets. Initially, 90%-10% division of the datasets was considered as training datasets and testing datasets. When the division size of the datasets varied like 80%-20%, 70%-30%, 60%-40% or 5-%-50% of training and testing datasets, the following results were observed which are shown in Tables 6 and 7.
| Algorithms | Training Data-set Size | Testing Data-set Size | Accuracy (%) | Specificity (%) | Sensitivity (%) | F -score (%) | Execution Time (sec) |
|---|---|---|---|---|---|---|---|
| NBC | 1430 | 159 | 94.47 | 95.33 | 91.66 | 96.73 | 7.86 |
| DT | 1430 | 159 | 85 | 92.41 | 76.62 | 91.54 | 4.10 |
| Algorithms | Training Data-set Size | Testing Data-set Size | Accuracy (%) | Specificity (%) | Sensitivity (%) | F -score (%) | Execution Time (sec) |
|---|---|---|---|---|---|---|---|
| RF | 1619 | 180 | 95.49 | 98.76 | 93.92 | 97.36 | 2.66 |
| k-NN | 1619 | 180 | 63.15 | 91.68 | 79.13 | 77.67 | 3.34 |
| Algorithms | Training Data-set Size | Testing Data-set Size | Accuracy (%) | Execution Time (sec) |
|---|---|---|---|---|
| NBC | 1271(80%) | 318(20%) | 95.00 | 11.64 |
| DT | 85.59 | 05.97 | ||
| NBC | 1112(70%) | 477(30%) | 94.75 | 24.03 |
| DT | 85.43 | 11.94 | ||
| NBC | 953(60%) | 636(40%) | 94.66 | 36.94 |
| DT | 85.53 | 27.10 | ||
| NBC | 795(50%) | 794(50%) | 94.70 | 49.08 |
| DT | 85.00 | 33.62 |
| Algorithms | Training Data-set Size | Testing Data-set Size | Accuracy (%) | Execution Time (sec) |
|---|---|---|---|---|
| RF | 1439(80%) | 360(20%) | 95.75 | 4.26 |
| k-NN | 63.17 | 4.97 | ||
| RF | 1259(70%) | 540(30%) | 95.64 | 7.56 |
| k-NN | 64.32 | 9.96 | ||
| RF | 1079(60%) | 720(40%) | 95.72 | 11.45 |
| k-NN | 63.83 | 14.89 | ||
| RF | 900(50%) | 899(50%) | 95.50 | 15.53 |
| k-NN | 63.57 | 19.82 |
| Sl. No. | Datasets | Algorithms | Accuracy | Limitations |
|---|---|---|---|---|
| [ 7] | 5,147 training data sets and 1,716 test data sets | LDA, k-NN, SVM, RF and LR | k-NN - 65.13%,
LDA - 68.40%, SVM - 67.64%, RF - 68.51%, LR - 68.22% |
Accuracy is quite low. |
| [ 12] | 530 data sets | Naïve Bayes and C4.5 | NBC - 88.60%,
C4.5 - 89.53% |
The data sets considered are less. |
| [ 15] | 8,479 data sets | MUST-Plus | 76.4% | The accuracy of MUST-Plus is less than the previous technique MUST. |
| [ 18] | 113 data sets | Macro-lens, Hbmeter | The accuracy is not mentioned but it is said it provided good results | There were doubtful outputs obtained in the confusion matrix. |
| [ 22] | 102 data sets | ROSE and SMOTE | ROSE-98.0%,
SMOTE- 98.2% |
The data set considered is small, and the patient had to buy the device to get the prediction. |
| [ 32] | 176 data sets | SVM | Sensitivity-96.89%,
Specificity-94.56% |
The data set considered is small, and if the outcome is less than 8 g/dL, then the result is not known. |
| [ 35] | 300 data sets | Digital Camera-based Spectrometer | A low-cost device was obtained to predict anemia. | The data samples considered are small. |
| [ 38] | 1,583 data sets | Two-Layer
Stack of Regressor |
This model provided 57.13% accuracy | The performance of the model must be improved. |
| Proposed
System |
Malnutrition-1589
Anemia- 1799 |
Naïve Bayes, C4.5, Random Forest, k-NN | NBC-94.47%
C4.5- 85% RF-95.48% k-NN-63.15% |
Time taken for execution is more when large real-time data sets are used. |
Referring to Tables 4 and 5, it can be observed that in malnutrition prediction, even though the NBC is more accurate than DT, the execution time is higher in the NBC algorithm. But on the contrary, in anemia prediction, the RF shows more accuracy and takes less time for execution than the k-NN algorithm.
4.2. Comparative Analysis
Different methods used to predict malnutrition and anemia are compared in Table 8. Talukder et al. [ 7] proposed the usage of five different supervised classification learning techniques like k-NN, LDA, SVM, RF, LR, but the RF classification technique was considered a better performing algorithm with an accuracy of 68.51% and sensitivity of 94.66%. In the work proposed by Ridwan et al. [ 18] two classification algorithms, Naïve Bayes classifier, and C4.5 were compared and it was observed that the C4.5 algorithm performed better than the Naïve Bayes classifier with an accuracy of 89.53%. Timsina et al. [ 15] proposed a method that was an improvised version of the existing MUST called MUST-Plus. It used the RF classification technique to predict malnutrition and even though MUST-Plus provided good sensitivity, its accuracy was less than MUST. Giovanni et al. [ 18] proposed a non-invasive method that used microlens to capture the picture of the conjunctiva and then using those images, the concentration of hemoglobin was calculated and the k-NN algorithm was used to classify if the patient was anemic or healthy or maybe anemic (doubtful).
To overcome this imbalance in the previous method, Giovanni et al. [ 22] again proposed a new method that involved balancing algorithms called SMOTE and ROSE. A manual selection of conjunctiva with both SMOTE and ROSE algorithms was done over many classification algorithms. As a result, the k-NN algorithm performed well for both SMOTE and ROSE, but the results derived from k-NN with SMOTE algorithm had a higher accuracy of 98.2% than the ROSE algorithm. Santovelli et al. [ 32] proposed a device that uses microwave frequencies considering the dielectric property of blood to find the concentration of hemoglobin. The SVM algorithm and 10-fold cross-validation were applied to train and test the blood samples and results with 96.89% sensitivity were obtained. Halder et al. [ 35] proposed a digital camera-based spectrometry method that involved a PoC for detection of anemia and it also used linear regression for classification. It was found that this method worked well in finding out if the patient had anemia or not. Finally, Acharya et al. [ 38] proposed a non-invasive method that uses PPG and two-layered Stacked Regressors to estimate hemoglobin concentration and it was observed that it provided efficient results.
In the proposed system, we can observe that the NCB provided 94.47% accuracy which is greater than the NBC algorithm that has been discussed by Ridwan et al. [ 12] but as discussed earlier when the comparison was done between the NBC and DT performance it was found that the DT algorithm took around half the time taken by NBC. Even though the NBC provides good accuracy, it takes more time for execution, which can be considered as a limitation as the proposed approach is a real-time application wherein the execution time acts as a major factor.
CONCLUSION
The main objective of this application is to predict malnutrition and anemia. Machine learning algorithms like Naïve Bayes Classifier, Decision Tree, K-Nearest Neighbor, and Random Forest are used for prediction. As we have seen above Naïve Bayes Classifier and Random Forest algorithm have shown results with high accuracy for malnutrition and anemia prediction, respectively. A web application is designed to make the usage of the application user-friendly. This application can be used in all hospitals by doctors, nutritionists, and even health workers with computer knowledge can easily use this application even without the assistance of doctors or nutritionists and it does not require a dedicated lab as it can be easily accessed on mobile phone, desktop or laptop. Once the disease is predicted, a diet recommendation is also recommended which contains the list of food that can help the patient to overcome the disease.
For future enhancement, a greater number of algorithms can be used and compare those algorithms to identify the efficient algorithm, and more training datasets can be used for prediction. The number of datasets considered for prediction in the proposed system is quite small, to improve the performance, a greater number of datasets can be used to train the algorithms.
ETHICS APPROVAL AND CONSENT TO PARTICIPATE
Not applicable.
HUMAN AND ANIMAL RIGHTS
Not applicable.
CONSENT FOR PUBLICATION
Not applicable.
AVAILABILITY OF DATA AND MATERIALS
All data generated or analyzed during this study are included in this published article.
FUNDING
None.
CONFLICT OF INTEREST
Dr. Vinayakumar Ravi is the associate editorial board member of The Open Bioinformatics Journal.
ACKNOWLEDGEMENTS
Declared none.

