
The Clinical Relevance of ECG Parameters in the Prediction of Cardiac Mortality: A Comprehensive Review
Abstract
About half of all heart disease deaths are caused by cardiac arrest, making it one of the major causes of mortality in prosperous countries. When confronted with potentially fatal arrhythmias, implanted preventive cardioverter defibrillators significantly improve survival chances. However, this is only possible if high-risk patients who are prone to spontaneous cardiac arrest are identified beforehand. The current analysis examines the most recent findings regarding the use of surface electrocardiogram (ECG) data to predict sudden cardiac arrest. Here, we provide a comprehensive overview of the literature on non-invasive ECG techniques for predicting these kinds of cardiovascular crises. Several electrocardiographic risk stratification methods, including T-wave alternans, signal-averaged ECG, T-peak-to-end variation, early repolarization, an extension of the QT interval, QRS duration, QRS cluster patterns, and Holter monitoring, have been reviewed and analysed. These ECG results have shown to be useful as first screening instruments. Nonetheless, no single ECG measure has shown to be an effective technique for classifying individuals based on their risk of sudden cardiac arrest to date. Nevertheless, one or more of these prospective SEM metrics might potentially be important in intricate risk categorization schemes.
1. INTRODUCTION
Cardiovascular diseases are the leading worldwide cause of mortality. The electrocardiogram serves as an indispensable diagnostic tool and screening methodology in clinical evaluations and preliminary diagnostic investi- gations, conferring a substantial, reliable, accessible, and cost-effective approach in cardiac-related treatment. The aim of this paper has been to survey critical ECG parameters related to cardiac death and the hidden affiliated components, providing important leads for clinical practice in everyone and competitors. The primary electrocardiography parameters related to cardiac death under scrutiny majorly involve the wave-P (length, interatrial square, and profound end point pessimism of the wave-P in V1), Hiring’s of QT and Tpitch-Tend postponed, Stretching back QRS and fracture, packfilial square, ST section misery and height, waves-T (altered, wave-T tomahawks), dimensional edges among QRS and T-vectors, untimely venous compressions, and Criteria for electrocardiography fat loss.
Sudden heart demise is a significant medical issue, and the majority of the cases occur apart from the emergency clinic, except if the symptoms are previously diagnosed [1, 2]. Auxiliary and cardiac variations from the norm go about as prominent inclining components towards heart failure [3]. The electrocardiogram, the set-up account of a heartbeat, is normally utilized in diagnostic practice for clinical conclusion and forecasting, yet additional diagnostic parameters, i.e. the electrocardiography symptoms related to cardiac death and the affiliating components, provide fundamental investigation ideas for diagnostic practice in everybody and competitors [1, 4]. A few important electrocardiography factors related to cardiac death are shown in Fig. (1).
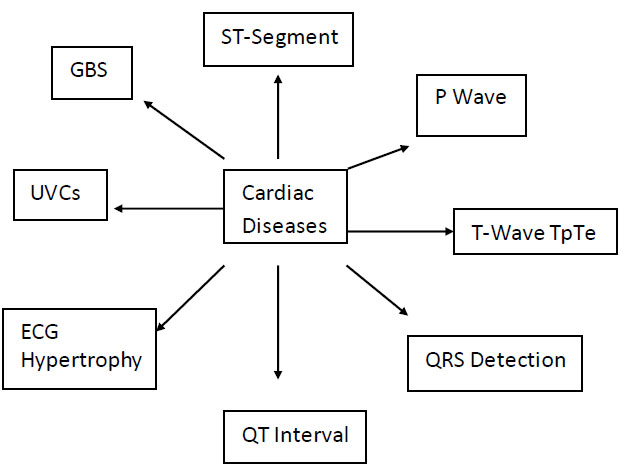
Electrocardiographic indicators of cardiac diseases.
2. WAVE-P
Wave-P reveals the atrial depolarization and conduction of the atria. Among the wave-P data from conventional electrocardiography that shed light on atrial electrical development are wave-P shape, abundance, and range. The drawn-out wave-P term, which is linked to atrial fibrillation and can cause heart illness and even stroke mortality, indicates the interatrial square, a conduction delay between the left and right atria. Interatrial square has been linked to classic cardiac risk factors such as smoking, amenorrhoea, hyper- cholesterolemia, obesity, advanced age, and sedentary lifestyle, as well as coronary artery disease, because of endothelial degradation and interatrial conduction delay caused by bloodlessness.
Similar findings were noted for patients with reduced left atrial beat volume, dynamic imperativeness, left atrial width, and electromechanical brokenness, which may account for an excess of atrial blood clots. Physical activity can raise the risk of fatal cardiac arrest and other catastrophic cardiac incidents, even if it has many benefits for physical growth [4]. Due to arterial sclerosis illness, unexpected heart death-typically the significant clinical manifestation of a cardiac problem-is dynamically unavoidable in candidates who have been prepared for longer than 35 years [4, 5]. The primary cause of unusual cardiac events in a growing number of young individuals is characteristic or acquired cardiac varieties from the standard, such as obesity, prolonged or myocardiopathy and heart attack course abnormalities, inconvenient coronary artery disease, inflammatory cardiomyopathy, Marfan's disease, valvulopathy, wolf-parkinson-white syndrome, or vehicle diacal canalopathy, and Arrhythmias might be triggered by heavy physical activities [3-8]. Not every competitor at significant risk may be identified by cardiac screening; however, in spite of quiet heart irregularities, a few indicators are unmistakable on the ECG. Certain categories are more likely to have cardiovascular problems than others, including persons, those who are more settled, Afro-Caribbean relatives, b-athletes, joggers or long-distance races, and endurance competitors [5, 9]. Regular exercise lowers the chance of myocardial restricted dysfunction and unexpected cardiac mortality; in otherwise well-prepared persons, however, strenuous exercise raises the risk of cardiac events. This phenomenon, known as “contender's heart,” or corporal cardiac adaptation to increased physical exertion, causes certain common ECG abnormalities, such as sinus bradycardia, that are not linked to an increased risk of cardiovascular disease, first-degree atrioventricular square, early repolarization, prolonged parasympathetic nerve tone, absent right congregational branch square, and a prolonged QRS voltage due to physiologic left venous fatness are the causes of these anomalies [5, 9]. Guidelines for evaluating ECGs like those of the European Society of Cardiology [10], the “Seattle criteria” [11] and, relatively more recent the “Refined Criteria for ECG Interpretation” [12, 13]. These were specified to eliminate results that might be false positives. Periphery modifications were also depicted, in addition to the planning-related common revelations, and preparations were made for immaterial anomalous disclosures. Over a follow-up period of eighteen years, it was observed that in patients without a history of major cardiovascular diseases, delayed P frequency was related to prolonged stroke casuality, independent of common cardiovascular risk factors like treatment of diabetes and its diversity, proteinuria, heartbeat, left ventricular hypertrophy, and glycemic control. The assessment included 739 centres and developed type 2 diabetic patients with no previous record of any major cardiovascular disorder reports [14-17]. In a massive report comprising 8,143 people with a follow-up period of over 13 years reports a significant indication of P-wave in V1 (PTPV1), a marker of atrial fluctuation from the standard, was linked to an extended threat of death considering cardiovascular disease and ischemic coronary illness. It is evident that the P-wave is biphasic in V1, with the negative P prime measuring more than 1 mm, in a resting 12-lead ECG. Furthermore, in the 15,375 ARIC (Atherosclerosis Risk in Communities) participants, DTNPV1 was associated with an elevated risk of non-lethal events (atrial fibrillation, cardiovascular breakdown, coronary disease, and stroke) as well as an extended risk of unexpected cardiovascular fatality after 14 years of follow-up [18-22]. To sum up, delayed P-wave range, interatrial square, and marked aggressiveness of the P-wave in V1 are the most notable atrial ECG indicators of cardiopathy. Left and right atrial enlarge- ments are considered minor, unpredictable revelations and are occasional in both contenders and patients with myocardiopathy, according to the “Refined Criteria for ECG Interpretation” for elite competitors [9]. Other ECG abnormalities associated with hypertrophic cardio- myopathy, such as Q waves, T-wave inversion, and ST divide distress, are connected with left atrial development [13].
3. QT-INTERVAL
The heart's extraventricular movement potential terms are represented by the QT interval, which stretches from the T-wave to the shockingly early point of the QRS [23]. A few studies have looked at the correlation between postponed QT intervals and adverse cardiovascular events. The limitations of the QT between periods include difficulties in depicting the T-wave's completeness, varying throughout the day, fluctuations due to system and methodology, and variability within and between observers. As the Bazett condition undercorrects at lower beats and overcorrects at higher beats, and is, in a sense, appropriate for physiological heartbeats, it presents another difficult aspect of the QT interval-especially since it is typically used for a significant portion of clinical practice and research. It appears that there is an individual correlation between QT interval and HR [24]. A few factors can cause variations in the QT-interval: age, gender, medication use, autonomic changes, dyslipidemia, weight fluctuations, myocardial ischemia, diabetes, smoking, cardiovascular disease, hypertension, stroke, liver cirrhosis, frustrated renal limit, and electrolyte imbalance [25]. Precisely confirming the T-wave's completion might be difficult, particularly when the T-wave is level, atypical, or has other peculiar character- istics. Heartbeat revised QT break term (QTc) from PAREPET (Prediction of Arrhythmic Events with Positron Emission Tomography) indicated a rapid cardiac collapse in patients with defective left ventricular dispatch division and ischemic cardiomyopathy [26]. In certain patients with delayed QT intervals, torsade de pointes does not occur if the repolarization hold is typical or if the transmural dissipating of repolarization is not prolonged [27]. Cardiovascular event indicators that are progressively unstable are required. A heartbeat-updated QT interval of 470 ms or more is considered a distinctive result and a sign of readiness in top competitors. Planning separated ECG variations from the standard in candidates is observed for both long and short QT intervals [9, 13].
4. QRS-DURATION AND FRAGMENTED QRS
For patients with hypertension, those with left ventricular abnormalities, and cardiovascular mortality in all patients, the QRS length is an extrapolation of death. This finding was drawn from an analysis of 46,399 patients and a mean follow-up of six years [28, 29]. An 18% increase in cardiovascular risk was associated with every 10 ms lengthening of the QRS expression [29]. A reduction in isolated QRS is associated with intraventricular conduction delays because of the irregular start of the ventricles caused by ventricular depolarization, impaired sign transduction, myocardial ischemia and fibrosis, and scarring of the heart [30-34]. In an assessment of 355 hospitalised patients in a coronary crisis clinic, isolated QRS was found to predict severe heart events, decline, larger myocardial infarct size, and low left ventricular release parcel in individuals with serious coronary issues. how many leads have distinct QRS counts and how far apart the divided QRS is [33, 35]. In individuals with prior myocardial dead tissue, the proximity of three leads with separated QRS, at any rate, was found to be a free indication of cardiovascular destruction or hospitalisation for cardiovascular breakdown [35]. In an assessment comprising 879 patients over a follow-up of 29 months, a partitioned QRS inside viewing a huge QRS, over 120 ms, is also a symptom of myocardial scar. This is in addition to being a free predictor of mortality in patients with coronary disease. Potential explanations for unsettling outcomes in patients with separated broad QRS include cardiac or arrhythmic events, or scar-related progression of cardiovascular collapse [32]. Individualised QRS were used to predict the death rates of patients with coronary heart disease, implanted cardioverter defibrillators, ischemic cardiomyopathy, arrhythmogenic right ventri- cular cardiomyopathy, Brugada disease, and coronary conductor evade join the clinical system [34, 36]. Several types of divided QRS were represented in the composition: separated the two-way pack branch square, divided QRS linked with ST-segment height, RSR structure, additional R waves, and indents for the R or S wave [31, 33, 34]. Many generous or closed severe cardiac illnesses, including arrhythmogenic right ventricular dysplasia and the Brugada issue, are associated with the rSr configuration in drives V1–V2. Moreover, it occurred to robust, asymptomatic youth and contenders as well as when drives V1 and V2 were adjusted higher. It was most usually associated with syncope or cardiovascular breakdown [37]. Similar correlations may be seen between hyperkalemia, right ventricular hypertrophy, a few cases of ventricular preexcitation, and an R configuration in drives V1 and V2 [37]. The parameters of Q, R, and S wave, in particular, the range, amplitude, and indent in ten healthy ECG leads comprised the QRS score that Strauss et al. utilised to identify and assess scars in patients with ischemic and non-ischemic cardiomyopathy [38, 39]. Additionally, they believed that patients with lower QRS scores often had fewer ventricular arrhythmias. While Brugada-like early repolarization is important in preparing irregular ECG abnormalities in contenders, scored QRS in V1 is linked to the traditional, planning-related ECG abnormalities in contenders [9]. Thus, distinct QRS patterns suggest auto-vascular death in patients with arrhythmogenic right ventricular dysplasia, Brugada syndrome, extraordinary coronary disease, and left ventricular days work, but not in contenders.
5. GATHERING BRANCH SQUARE (GBS)
With rigorous treatment of myocardial restricted rot with early coronary revascularization and thrombolytic drugs, the rate of Q wave myocardial dead tissue decreased and the length of non-Q myocardial limited rot rose [32, 40]. Consequently, the assurance of an old myocardial dead tissue inside of seeing a pack branch square became increasingly challenging. Myocardial confined putrefaction inside an absolute left pack branch square was demonstrated by the following symptoms: Q waves in any two leads at any time (I, aVL, V5, and V6), R wave slide back from V1 to V4, and basic STT changes in any two adjacent leads at any time. The S wave late indenting was observed in all eight leads (V1–V4) [41]. Another left pack branch square could envision an extreme myocardial dead tissue with an affectability of forty-two percent and an identity of sixty-five percent in one hundred eighty-two patients with left gathering branch square (Thirteen percent with an extraordinary myocardial confined corruption) [42]. The left gathering branch square's indenting of the S wave notwithstanding the scored R wave was identified as “partitioned left pack branch ruin,” a significant indicator of mortality and limited putrefaction scarring in the heart [32]. A right-pack branch square, which has a stronger theory than a left-gathering branch square, may be able to treat a shoddy divider or myocardial scar that is organised in the right ventricle [32]. Decreased enunciation or misalignment of connections during left ventricular hypertrophy can cause uncoupling in the left ventricular working myocardium; this can be explained by a left-gathering branch square model with a low abundance of the QRS complex. Some people may react negatively to cardiovascular resynchronization treatment [43]. Whole BBBs, whether left or right, are considered sporadic disclosures and are not really related to getting ready for front-runners [13]. Naturally, a left or right extended ventricular mass may directly cause a deficiency in the right BBB and a rise in QRS voltages owing to rising discouragement estimations and divider thickness, which are linked to the candidate's heart's physiological electrocardiographic changes [9]. A full-pack branch square on the right or left is a planning-unimportant ECG variation from the typical contender. In conclusion, a right gathering branch prevents a myocardial mark in the right ventricle, whereas a left pack branch square may indicate an exceptional myocardial limited putrefaction.
6. ST-SEGMENT DEPRESSION OR ELEVATION
A number of diseases, such as severe myocardial confined rot, Brugada disease, early repolarization, and extraordinary pericarditis, have been linked to ST parcel increase. A reduction in the risk of sudden cardiac death has been associated with an increase in the height of the ST region at the point of J, in lead V3, II, and aVF, as well as at 60 ms after the J point, in both the ARIC trial and the CHS [1]. As certain molecular channels might only be active in particular cases, hence, in every single case examination of STJ and ST60 was performed. ST split stature indicates an ethnicity-related consequence that is largely inevitable in any dull person who pays little attention to sports planning [44]. In a more than ten-year follow-up study, withdrawing minor unclear ST section and T-wave anomalies (like the up-sloping ST divide misery and level or adjusted T-waves) were meaningfully linked to an elevated risk of coronary passing and basic arrhythmic casualty. These findings are customary in asymptomatic, increasingly prepared patients [45]. In older individuals, there has been a correlation found between coronary disease mortality and ambiguous ST section and T-wave abnormalities [46-48]. Although it was proposed that variations in the standard T-wave and unclear ST portion could indicate either left ventricular hypertrophy [47], or subclinical coronary disease. Since accounting for left ventricular hypertrophy or preclinical atherosclerosis did not alter the link between the STT alterations and cardiovascular events, arrhythmias may have occurred in the CHS [45]. In addition to the standard conditions pertaining to left ventricular development, electrolyte imbalances, drug or athletic limit use, cardiovascular breakdown, and dietary intake, isolated minor obscure STT anomalies are linked to physiological marvels such as uneasy weight, altered posture, hyperventilation, or central tactile framework wounds; none of these, though, could account for the association with deadly cardiovascular events [45]. Thus, at the most fundamental level, alterations in STT that are consistent and unclear-rather than those resulting from sporadic physiological phenomena-are linked to cardiovascular death [45, 49]. Regular focused exercise is linked to repolarization alterations that impact the shape of the T-wave and the ST-segment [44]. Competitive disclosures of anomalous irregularities are likely to occur in the ST divide problem and the Brugada-like model, particularly when Caucasian competitors' excessive Q waves and T-wave inversions beyond V1 are brought into play [13]. On the other hand, a prolonged vagal tone or even a loss of consciousness due to physiological ECG abnormalities in the candidate's heart may cause early repolarization, sinus bradycardia, and first- and second-degree atrioventricular blocks [9]. The STJ/ST80 extension (ST piece swells at J point/ST divide at 80 ms after the J point) may be used to differentiate early repolarization from the Brugada problem in humans [50]. In patients with Brugada issues, the ST-segment arrangement was downsloping (STJ/ST80 >1) and the ST-structure was upsloping (STJ/ST80 < 1) with good investigation accuracy for early repolarization [50]. In a nutshell, ST piece despair is an unusual observation in candidates and indicates arrhythmic and coronary damage.
7. T-WAVE
The usefulness of repolarization subintervals is not well understood. The transmural dissipating of repolari- zation or T-peak tend interim (TpTe), is a measure of ventricular arrhythmia deficiency [51, 52]. The biggest obstacle to the TpTe is the lack of a reasonable agreement regarding customary characteristics. In a thirteen-year follow-up study, abnormally aroused T-wave and delayed QTc, prolonged heartbeat, and hypertension were found to be more reliable indicators of unexpected cardiovascular death risk than coronary disease in an assessment involving eighteen thousand four hundred ninety-seven individuals who were initially free of coronary illness. T-wave inversion, QRS range, and QRS/T point were linked to the chance of sudden cardiac arrest and ranged from all causes, and past conventional cardiovascular alerting signs, according to an evaluation involving 1,949 men who were followed up for a significant period of time [53]. Severe ischemia does not cause negative T-waves; rather, they emerge in ischemia that is continuing or has disappeared. Depending on their relevance, positive or negative U waves might join the negative ischemic T waves, which even display mirror patterns [54]. T-wave inversion, QT break prolongation, and dangerous arrhythmias in patients with Takotsubo cardiomyopathy are caused by myocardial edoema rather than systolic brokenness. The Wellness ECG configuration (negative T-wave and deferred QT interval) pays little attention to the causative mechanism in these patients [55-57]. The common ECG deviation from the standard of hypertrophy and arrhythmogenic right ventricular cardiomyopathy -the primary cause of abrupt cardiac arrest in contenders-is T-wave inversion in any of the two neighbouring leads [9, 57] Afro-Caribbean contestants logically exhibit T-wave inversion in front leads, as it distinguishes them from white contenders and refers to the ethnic diversity of their hearts, especially in relation to an angled ST division increase [44]. T-wave inversion in the sidelong leads may be an indication of hypertrophic cardiomyopathy, requiring further cardiovascular assessment and monitoring. T-wave inversion, ST-segment depression, furious Q waves, and ventricle pre-excitation are thought to be the primary, planning irrelevant ECG variations from the usual in competitors.9 Disease Indices Positive T-waves in lead aVR were associated with a prolonged in-crisis centre cardiovascular death in 139 consecutive patients with impressive ST-segment elevation myocardial limited rot and uncomplicated percutaneous coronary intervention. Negative T-waves are not the sole signs of a poor prognosis [58]. As a result of the beat-to-thump change in movement potential length at the level of heart myocytes, the T-wave alternant arises, representing the heterogeneity of repolarization, acting as an arrhythmogenic-sister instrument, and causing fatal ventricular arrhythmias by immobilising the heart muscle. It also repeats the Ababa arbitrariness plan in the morphology and adequateness of the T-wave [59]. Though it is called “T-wave alternans” (TWA), the ST bit and U wave may also be included. Visual evaluation's low adequacy means that TWA may not always be seen; however, automatic filtering and forced ECG study involve its assessment. It is possible to reduce walking ECG recording-based TWA in twenty-four-hour Holter tales by taking small steps, figuring out the peak TWA value, and doing optical examinations to verify the proximity and sufficiency of TWA [60]. Similar to this, T-wave tomahawks were linked to higher fatality rates [61, 62]. The signs of cardiovascular mortality consist of T-wave tomahawks, positive T-waves in aVR, delayed TpTe intervals, and altered T-waves.
8. SPATIAL ANGLES
Strong free indicators of coronary disease and overall mortality include the spatial T centre point of the ECG and the frontal and spatial borders between the QRS and T vectors [14]. Several research found that wide QRS/T margins were linked to an increased risk of mortality [63, 64]. The spatial edge between the T-peak and average repolarization reference vector was the most reliable predictor of coronary disease mortality and sudden cardiac death in males, according to the ARIC trial. The most important variables in women with cardiovascular disease (CVD) were T beginning and T-peak vector significance extent, as well as T adequacy in aVR [65]. Among all subgroups, transcatheter aortic valve replacement (T AVR) plentifulness antagonism decreased to less than 150 V, which was the most reliable indicator of mortality [65]. The spatial limits between the mean QRS and T vectors and between the T-peak and standard R reference vectors are additional characteristics that influence ventricular repolarization. It was discovered that T in V1 was a startling reduction in cardiovascular health and a free marker of coronary disease [66]. The spatial point between the mean QRS and T vectors represents the degree of the general deviation edge between the depolarization and repolarization groups, and the spatial edge between the T-peak and common R reference vectors represents the degree of the repolarization bearing's departure from the reference course during commonplace repolarization of the left-ventricular sidelong divider. A prolonged desynchrony of repolarization in addition to a subclinical coronary sickness may be suggested by the modified direction of the repolarization game plan, which may indicate severe subepicardial myocardial ischemia. The entire spatial edge between the T-peak and traditional R reference vector [66]. Furthermore, in the Health Initiative study for females, 52,994 postmenopausal women were observed. The spatial position between T-peak and standard R reference vectors and TAVR abundance was found to be connected to coronary disease mortality [67]. The requirement for modified electronic ECG sign assessment and revamping even leads is the most significant constraint of the mentioned records [14].
9. UNFAVORABLE VENTRICULAR COMPRESSIONS (UVCS) AND ABSENTIA OF SUSTAINED VENTRICULAR TACHYCARDIA
Risky arrhythmias that are typically linked to heart illness are ventricular arrhythmias. The morphology of the ventricular beats that are not optimal can be useful in predicting outcomes [32]. When a Q wave above 40 ms was present, indenting the uncomfortable ventricular architecture was examined to determine whether a QR or QRS configuration could be reached, as well as myocardial dead tissue [68]. In individuals with hypertrophic cardiomyopathy who have a high risk of an untimely cardiac death, scenes of no continuous ventricular tachycardia can be seen by Holter electrocardiographic imaging [69]. Candidates without coronary disease do not have contradicting occurrences of opportune ventricular compressions [70]. Unusual physical development during contests can occasionally cause sudden death in competitors. These conditions include hidden heart molecule channelopathies, arrhythmogenic right ventri- cular cardiomyopathy, hypertrophic cardiomyopathy, or cardiovascular arrhythmogenic reconstructing as a result of prolonged training, all of which validate clinical concern [71-73]. Either way, the latest guidelines show that candidates with atrial or ventricular arrhythmias and two PVCs per 10 seconds are deemed to be getting ready for minimal masochist ECG abnormalities [13]. In a study involving 5,112 participants and a seven-year follow-up, exercise-induced tachyarrhythmia in exceptionally well-prepared candidates without a significant coronary disease-including less-than-ideal ventricular throbs-was good and unrelated to fatal events or the improvement of coronary illness [73].
10. ECG VENTRICULAR HYPERTROPHY
A number of ECG criteria, such as the Cornell item, the Romhilt-Estes scoring system, and the Mazzaro score, as well as traditional voltage criteria, including the Sokolow-Lyon criteria, which are the sum of the S wave in V1 and the R wave in V5 or V6 ≥35 mm, were developed for left ventricular hypertrophy [74-77]. ECG left ventricular hypertrophy criteria are significant risk markers for the evaluation of disease transmission and the prognosis of cardiovascular illnesses, especially sudden cardiac death, despite their limited affectability. In patients with hypertension, left ventricular hypertrophy is a clear sign of myocardial confined putrefaction, congestive cardiovascular breakdown, and abrupt cardiovascular death. It also suggests harm to the target organ [78-80]. Both Cornell and Sokolow-Lyon's criteria for left ventricular hypertrophy were revealed to be risk factors for stroke, even in those with normal blood pressure, in sizable research of the Japanese population [81]. Over a 4.3-year follow-up period, heart rate, Q waves, and the Cornell voltage-range item were found to be positively associated with the cardiovascular decline in 1,473 patients with asymptomatic aortic stenosis [82]. Sokolow-Lyon voltage criteria, Cornell thing criteria, LIFE trial (Losartan Intervention for Endpoint Reduction in Hypertension), or ECG strain improved hypothesis of cardiovascular events for ECG LVH all indicated that a better outcome, free from beat deterioration, was linked to backsliding of ECG LVH following antihypertensive medication [83]. Electrocardiographic features such as QRS prolongation (false negative LVH-ECG status), modest STT irregularities, or severe electrocardiographic abnormalities are linked to errors in the ECG and heart-appealing reverberation imaging heart failure outcomes [84]. The classical perspective on left ventricular hypertrophy in the ECG demonstrates that QRS voltages are prolonged by physiological left ventricular hypertrophy brought on by prolonged physical activity. Whether an isometric or isotonic movement occurs determines the divider thickness [85]. Twelve female competitors showed a decrease in QRS size following twenty-one months of intense aerobatic training, in addition to an increase in height and weight of the female participants. This result was consistent with the idea of voltage shortage throughout the initial stages of left ventricular hypertrophy [86]. Current ECG regulations for contenders see restricted R and S wave amplitudes surpassing established requirements for LVH as a physiological response to preparation (physiologic LVH), rather than as a predictor of cardiovascular death [9, 13]. The division of physiologic left ventricular hypertrophy (resulting from maintained physical planning) from pathologic LVH (resulting from hypertrophic cardio- myopathy, associated with sudden cardiovascular mortality) is the guideline concern in tip-top candidates [87]. Studies have shown that the revised standards for evaluating candidates' ECGs increased the precision of identifying hypertrophic cardiomyopathy in both Arabic and dull candidates. Later research has shown that an extraordinary amount of practice breaks the right ventricle rather than the left, with a noticeable full flashing recovery; nonetheless, in certain candidates, the right ventricle had obvious functional and structural alterations [72]. The significant decrease in right ventricular limit increased with race length and was linked to troponin I and B-type natriuretic peptide, two biomarkers of myocardial damage. In a post-race and weeks later, an examination of forty competitors who were taught at design revealed no movements of the left ventricular limit. Given that candidates seeking an increasingly expanded length showed progressively critical reductions in the right ventricular limit, it was proposed that the heart's ability to sustain an extended cardiovascular yield is limited. The planning level also affects myocardial damage and the decrease in the right ventricular limit [72]. For endurance athletes, stroke volume can be increased to over 75% of maximal oxygen uptake; this can be done voluntarily for extended diastolic filling and ventricular cleaning, as well as for momentarily increasing cardiac yield [88]. Deferred, irrational volume over-trouble may cause the right ventricle to become overwhelmed, leading to right ventricular brokenness and broadening of the atrium and ventricles. When severe fatigue is combined with excessive dilatation of the passing chamber, primitive cardiac fibrosis can develop. This can be a precursor to ventricular tachyarrhythmia and no ischemia rapid arrhythmic fate [6, 88]. Phidippides cardiomyopathy is the term for a sustained increase in cardiovascular yield that causes transient chamber enlargement and concomitant heart fibrosis in tilted individuals. Ultimately, it is cardiac arrhythmogenic overhauling due to delayed intense activity. Only male participants met the voltage requirements for right ventricular hypertrophy because their hearts changed more significantly than those of female competitors. These parameters showed no correlation with cardiovascular pathology in asymptomatic candidates [9]. Hypertrophic cardiomyopathy, which has a less dramatic appearance and a lower risk of arrhythmia, may be detected in people with normal electrocardiograms or narrow QRS voltage criterion for left ventricular hypertrophy [89]. ECG LVH is a marker for myocardial dead tissue, congestive cardiovascular breakdown, stroke, and unexpected cardiovascular death. It can also indicate a relapse in LVH as a result of improved treatment outcomes. Prolonged physical activity, as opposed to hypertrophic cardiomyopathy, results in natural left ventricular enlargement and decreases right ventricular function. Isolate QRS voltage criteria for left or right ventricular hypertrophy. Planning-related ECG abnormalities from the norm in candidates are typical [9].
11. COMPARATIVE ANALYSIS OF ECG VARIABLES DATA AND ITS INTERPRETATION
To improve the accuracy of interpreting electrocardiograms (ECGs), streamline healthcare decision-making, and reduce costs, computerized ECG interpretation has been developed. Globally, millions of ECGs are recorded each year, with the majority automatically analyzed and interpreted right away. Despite ongoing improvements in ECG algorithms, there are still limitations in the accuracy of computerized interpretation. Unfortunately, doctors who aren't trained in interpreting ECGs may overlook interpretation errors and simply trust the automated diagnosis. This could result in improper patient management, risking unnecessary treatments or investigations. Consequently, experts consistently stress the importance of thoroughly reviewing and validating computerized interpretations by skilled ECG readers. It is equally critical to effectively incorporate new ECG information into clinical practice [90].
11.4. Parameters of Heart Rate Variability (HRV)
11.4.1. Benefits
Reflects activity of the autonomic nervous system, which is helpful in monitoring cardiac health.
11.4.2. Drawbacks
Numerous factors, including age, medication, and degree of activity, influence interpretation.
Key technical considerations for digital ECG programs providing diagnostic interpretation include the following aspects of signal processing: acquisition, translation of analog to digital signals, and noise reduction filtering (e.g., myopotentials, movement artifacts, baseline wandering associated with breathing). Effective filtering of ECG data holds considerable influence over the ultimate processed signal, underscoring its indispensability in the process. Most automated systems now capture all ECG leads simultaneously. They generate an average complex for each lead by creating representative template complexes (dominant complexes) without premature beats. This process involves identifying waveforms accurately, including the P-wave, QRS complex, and T-wave onset and offset. Aligning and overlaying the representative complex for each lead allows for more precise labeling of waveform onset and offset. Measure- ments of amplitude parameters and intervals (PR, QRS, and QT) are conducted, with global interval measures typically yielding higher values than single lead measurements due to the elimination of isoelectric intervals found in individual leads. While this process is straightforward in normal sinus rhythm, it becomes more complex in the presence of atrial arrhythmias, often requiring time-domain or spectral analysis to recognize and differentiate rapid electrical atrial activity. Variations in manufacturers' algorithms for identifying wave start and end points also result in periodic variations in QRS duration and variations in QT interval interfering with precise analysis [91, 92].
11.5. Measures to Improve Sensitivity of ECG Data Analysis
1. Examining how various ECG parameter types function in particular clinical settings as ischemia, arrhythmia diagnosis, etc.
2. Analyzing in detail the advantages and disadvantages of each sort of parameter, including sensitivity, specificity, interpretability, etc.
3. Drawing attention to any new developments or patterns generated in ECG parameter analysis.
CONCLUSION
Globally, cardiovascular diseases (CVDs) constitute the primary cause of mortality. For CVDs, the electro- cardiogram (ECG) is a commonly utilised diagnostic instrument. CVDs are linked to several ECG character- istics, including wave-P, QT interval, QRS duration, bundle branch block (BBB), T-wave, and spatial angles. Atrial depolarization and conduction are indicated by Wave-P. Atrial fibrillation is associated with delayed P-wave length, which can lead to heart disease and potentially stroke death. Heart illness can result from the interatrial block, a conduction delay that occurs between the left and right atria and is also associated with atrial fibrillation. The extraventricular movement potential terms of the heart are represented by the QT interval. Because of ventricular depolarization, poor signal transduction, myocardial ischemia and fibrosis, and heart scarring, the ventricles start irregularly, which is why shortened QT intervals are associated with intraventricular conduction delays. The length of the QRS indicates how long it takes for the ventricles to depolarize completely. Due to irregular ventricle start induced by ventricular depolarization, poor signal transduction, myocardial ischemia and fibrosis, and heart scarring, prolonged QRS duration is linked to intraventricular conduction delays. BBB is a disorder where the heart's electrical signals do not pass through the conduction system of the heart correctly. An elevated risk of cardiovascular mortality is linked to BBB. The electrical activity of the heart changes when there is an elevation or depression in the ST-segment. Myocardial infarction is linked to ST-segment depression. Early repolarization, pericarditis, and Brugada syndrome are linked to ST-segment elevation. Contraction of the ventricles is represented by the T-wave. Arrhythmogenic right ventricular cardiomyopathy and hypertrophic cardiomyopathy are linked to T-wave inversion. Higher death rates have also been connected to T-wave tomahawks. Another crucial ECG parameter is spatial angles. Strong free indications of coronary disease and overall mortality include the frontal and spatial borders between the QRS and T vectors, as well as the spatial T centre point of the ECG. To sum up, the ECG is a useful diagnostic tool for cardiovascular diseases. CVDs are linked to several ECG characteristics, including wave-P, QT interval, QRS duration, BBB, ST-segment depression or elevation, T-wave, and spatial angles. Healthcare practitioners can more accurately detect and treat CVDs by being aware of certain ECG characteristics.
Patients who are at high risk of unfavourable outcomes can be identified non-invasively thanks to basic ECG signs. Assessing risk in both symptomatic and asymptomatic patients is crucial for identifying who can benefit from more targeted management of cardiovascular risk factors and preventative interventions. Heart failure is associated with a number of factors, such as irregular heart rhythms, extended QT and T-peak-Tend intervals, spatial correlations between QRS and T vectors, ventricular arrhythmias, ECG hypertrophy criteria, and P-wave features (like interatrial block, length, and significant terminal positivity of the P-wave in V1). Even still, more research is required on the majority of these ECG variables.
AUTHORS' CONTRIBUTIONS
It is hereby acknowledged that all authors have accepted responsibility for the manuscript's content and consented to its submission. They have meticulously reviewed all results and unanimously approved the final version of the manuscript.
LIST OF ABBREVIATIONS
| ECG | = Electrocardiogram |
| QTc | = QT break term |
| PAREPET | = Prediction of Arrhythmic Events with Positron Emission Tomography |
| GBS | = Gathering Branch Square |
| CVD | = Cardiovascular Disease |

