Role and Impact of Method Noise on CT Image Denoising
Abstract
Background
The main emphasis of this study is on the medical Computed Tomography (CT) imaging denoising technique, which plays a major role in interpreting patient illness information for medical diagnosis. CT imaging is indispensable for accurate disease diagnosis, but image quality is affected by noise and other artifacts. The primary objective is to improve the accuracy of denoising algorithms, which consequently increases early disease prediction and enhances the accuracy of diagnostic outcomes.
Objective
The major objective was to examine the performance of method noise-based Low-dose CT (LDCT) image denoising technique using a Convolutional Neural Network (CNN) in medical imaging. This method aims to suppress noise, improve image quality, and effectively minimize radiation exposure. This method enhances the accuracy of the denoising algorithm, enabling more precise disease diagnosis. Method noise, or residual noise, plays a major role in denoising CT images while preserving fine details and minimizing other artifacts generated during the denoising process. Method noise includes the omitted structural features and other minute artifacts, which are resolved through CNN-based denoising techniques. This approach elevates the overall imaging quality and clarity, resulting in better diagnostic accuracy.
Methods
The study includes a systematic, method noise-based approach to determine the performance of denoising algorithms in diagnosing various diseases from medical CT images that are often affected by Gaussian noise. It involves selecting a comprehensive dataset, applying a method noise approach using CNN, and evaluating the outcomes through quantitative measures, such as PSNR, SNR, and SSIM. This comparison aims to assess diagnostic interpretation, thereby improving the accuracy and efficacy of the method noise-based technique in CT medical imaging.
Results
The results illustrate the differential accuracy and performance of CT image denoising techniques when compared to standard filtering methods, as well as after the application of method noise-based denoising techniques. Implementing quantitative measures, such as PSNR, SNR, and SSIM, aims to improve healthcare diagnostics.
Conclusion
The study concludes that method noise-based CT image denoising algorithms effectively mitigate noise and artifacts while retaining the corners, contours, and precise details of CT images, subsequently improving the efficiency and accuracy of predicting diagnostic results.
1. INTRODUCTION
CT imaging is an advanced radiological imaging practice that diagnoses different diseases in a more effective manner. However, the increasing use of CT images is associated with increased radiation risk [1, 2]. The CT imaging quality is influenced by the x-ray radiation dose. A higher radiation dose yields better results but poses adverse effects on patients. In contrast, low-dose tomographical images are susceptible to noise, blurriness in edges, and other artifacts that affect image clarity. The major sources of distortion or noise interference in CT images occur during the image acquisition and trans- mission process. CT image noise represents random changes in pixel-intensity values. Therefore, CT image denoising techniques are necessary to obtain high-quality images using low radiation. The denoising methods are essential for suppressing noise from affected areas in images, enabling precise restoration of clean images and detailed diagnosis of health concerns. However, noise in CT images, such as blurriness, edges, and sharp features, can impact image clarity, making it difficult to discriminate noisy factors during the denoising process. The enhanced images can result in the loss of critical data. Gaussian noise often influences CT images [3]. Gaussian or statistical noise occurs in image processing due to sensor noise and analog electronic circuitry interference. The noise distribution in tomographical images is characterized using noise variance and an image reconstruction algorithm. After analyzing noise variance in noisy CT images, various denoising methods were applied to improve image quality. These approaches include spatial domain filtering techniques, frequency domain filtering techniques [4], total variation methods, Non-Local Means filtering method (NLM) [5] and Block-Matching 3D filtering method (BM3D) [6], Weighted Nuclear-Norm Minimization method (WNNM) [7], and K-singular value decomposition method (KSVD) [8].
CT image denoising is mainly categorized into sinogram filtering methods, iterative reconstruction, post-processing, and Deep learning-based denoising methods. Sinogram filtering methods [9-11] operate on raw data, known as sinograms, which are filtered before the image reconstruction process. These techniques primarily suppress Gaussian, Poisson noise, and other artifacts from multiple projections (sinograms) before the filter-back projection process. For example, sinogram filtering techniques include the Wiener and Total Variation filters, which accurately process noise statistics. However, sinogram filtering methods often suffer from a lack of projection information and loss of spatial resolution, leading to low contrast, blurred edges, and loss of fine details in the filtered images.
Iterative reconstruction methods, such as those described in previous studies [12, 13], reconstruct high-quality CT images by iteratively optimizing the results and minimizing the difference between measured and estimated projection information. These methods integrate projection characteristics with prior information about the image to achieve better spatial resolution while effectively suppressing noise and other artifacts. Examples of iterative reconstruction techniques include non-local means and Total Variation-based priors, both of which significantly reduce noise and artifacts. However, the frequent iterations between the sinogram and image domains, along with limited reconstruction speed, hinder the efficient acquisition of sinogram information.
Post-processing methods are proficient at effectively denoising noisy CT images by processing reconstructed images without relying on projection information. Examples include the block-matching 3D filtering method [14], the Dictionary Learning method [15], and the Adaptive NLM filtering method [5].
In the modern era, deep learning denoising techniques have been utilized to resolve the difficulties of LDCT denoising. The DnCNN architecture is a progressive model for CT imaging in which an end-to-end deep neural network approach directly extracts image features and learns from noisy images to elevate clean images. Deep learning-based denoising methods enable models to automatically extract and learn all features from designated input information without human intervention [16]. In particular, recent developments in deep learning denoising techniques have been significant in solving LDCT denoising issues. For example, deep CNN is widely applied in the medical field of LDCT image denoising, providing faster execution speed and learnability. However, it often results in over-smoothing, resulting in the erosion of structural information.
CNN-related super-resolution imaging has especially been opted for a low-dose CT image denoising approach [17]. Residual Encoder-Decoder CNN (REDCNN) and wavelet networks were introduced to address the denoising challenges in LDCT images, with REDCNN replacing the pooling layers of U-Net with convolutional-deconvolutional layers. REDCNN effectively enhances noise reduction, structural preservation, and lesion detection. Additionally, DnCNN methods reduce noise, blurriness, and other artifacts, thereby improving patient diagnostic outcomes.
1.1. Major Contributions
The major objective of the research interpretation is to effectively incorporate the method noise concept for CT image denoising. The method noise-based CT imaging denoising technique is a combination of a CNN-based approach and the application of method-noise. The method of noise serves as a post-processing approach, mainly used for suppressing noise, edge preservation, structural preservation, and fine detail preservation.
The paper is classified into five sections. In Section 1, an introduction is presented. Section 2 describes the related work. Section 3 describes the use of method noise in CT image denoising. Section 4 describes the experi- mental analysis of the study, and section 5 describes the conclusion of the paper and explains future challenges.
2. LITERATURE REVIEW
CT image denoising plays a crucial role in reducing noise in CT images while preserving edges, sharp features, and fine details to enhance image quality and maintain diagnostic precision. The literature review focuses on both the strengths and limitations of each denoising technique.
Singh et al. [11] proposed a method noise-based CNN architecture for denoising low-dose CT images, where method noise was applied during the training of the CNN model. This approach automatically extracts features from images to denoise noisy CT images, with the noise method primarily used in training, where noise is explicitly added to the CT images. The CNN architecture eliminates the need for manual feature extraction, and the DnCNN architecture has demonstrated improved performance in challenging CT image denoising tasks. However, the suggested method is constrained in its ability to effectively analyze complex noise patterns.
Diwakar et al. [18] introduced a new method aimed at enhancing LDCT imaging quality with lower radiation doses, thereby improving diagnostic accuracy. The study demonstrated that an NLM filter with wavelet thre- sholding could be used to suppress noise while preserving detailed information. The NLM filter operates on a patch-based approach to reduce noise and other minute artifacts, while method noise is employed as a post-processing technique to ensure edge preservation, improved CT image quality, and superior denoising performance. However, training the CNN model for denoising remains computationally intensive.
Diwakar [3] provided an overview of various denoising approaches for low-dose CT images aimed at enhancing image quality and clarity. The comprehensive survey covered different noise patterns, characteristics, and denoising methods. The study highlighted several denoising techniques designed to improve diagnostic accuracy by enhancing the visibility of detailed anatomical structures. However, challenges in preserving edges and fine details during the denoising process remain a key limitation.
Trung et al. [19] investigated various deep-learning techniques related to patch-based and CNN methods for denoising noisy low-dose tomographic images. The novel method employs a dilated CNN to extract the global features of CT images by expanding the receptive field, while a preprocessing method is utilized to enhance image feature extraction, and a post-processing method effectively refines the denoised CT images. This study proposes a lightweight model that is computationally efficient and reduces blur, noise, and loss of structural information. In real-world scenarios, maintaining patient’s medical information introduces additional challenges that may affect image quality. A primary limitation is hyperparameter tuning, which complicates the attainment of satisfactory denoising results.
Zhang et al. [20] focused on minimizing radiation exposure during low-radiation CT scans while maintaining the diagnostic quality of reconstructed low-radiation tomo- graphic images by reducing noise and other artifacts. The study compares various denoising deep learning network models, including CNN models, encoder-decoder models, generative adversarial networks (GANs), and transformer models, to achieve improved denoising performance. The CNN model yields better denoising results, while the GAN method produces denoised CT images that exhibit perceptual similarity to standard-dose CT images. Transformer-based methods capture global contextual information about images. The trade-off between computational cost and denoising efficacy remains crucial.
Li et al. [21] developed an image domain denoising approach utilizing a Cycle Consistent Generative Adversarial Network (Cycle-GAN) for LDCT imaging. The proposed study introduces Cycle-GAN, Identity-GAN, and GAN-CIRCLE to enhance the computational performance and capability of LDCT image denoising, evaluating per- formance using PSNR and SSIM metrics. A literature review demonstrated improved denoising performance with reduced computational time.
Park et al. [22] suggested a Fidelity GAN (f-GAN) deep learning denoising approach to reduce noise in LDCT imaging by utilizing unpaired training data. The f-GAN generates an accurate generator by minimizing the weighted sum of two losses: Kullback-Leibler divergence between the distributions of generated and standard-dose CT data and L2 loss between low-radiation-dose CT images and generated images. This method ensures the preservation of typical features while mitigating noise. The study emphasizes that deep learning approaches are heavily reliant on computational resources.
Deep learning methods require substantial compu- tational resources for denoising LDCT images. Yang et al. [23] proposed a denoising approach based on GANs that incorporates Wasserstein distance and similarity in perceptual features to improve diagnostic accuracy. The study proposes Wasserstein distance, improving GAN performance and perceptual loss to mitigate noise in LDCT imaging. The study focuses on noise suppression, artifact minimization, and structural fine-detail preser- vation, yielding promising results in medical CT imaging. However, the method may not handle all types of noise, and their characteristics exist in low-dose images.
Li et al. [24] proposed the Progressive Cyclical Convo- lutional Neural Network (PCCNN) approach that effectively suppresses noisy areas and other artifacts in unpaired data, reducing the use of paired NDCT and LDCT image pairs. The PCCNN includes a noise transmission model that transfers noise from low-dose images to normal-dose images, and a multistage denoising frame- work exploits the progressive module, which comprises multistage wavelet transform to suppress noise from LDCT images. The PCCNN does not introduce new artifacts like blurriness, owing to its high resolution and complete image fine detail preservation. The efficacious noise suppression is achieved through the multistage wavelet transform approach. However, the main limitation is that the medical data evaluation relies only on one dataset from the American Association of Physicists in Medicine (AAPM), requiring further investigation to determine its generalizability.
Ziyad et al. [25] proposed a framework intended to improve the early detection of lung cancer in low-dose CT images. The PCCNN network encompasses a noise transfer model to transfer noise that exists in LDCT images to normal-dose images. Furthermore, the multistage denoising network effectively utilizes a progressive module comprising a multistage wavelet transform to suppress noise from LDCT images. This hybrid approach does not result in significant new artifacts, such as blurriness, due to its high resolution and complete preservation of fine image details.
3. METHOD
It is assumed that the original computed tomographic images are generally contaminated with Gaussian noise. In this context, the CT imaging noise is typically evenly distributed across the image surface, following a normal Gaussian distribution. A denoising convolutional network (CNN) is implemented to suppress additive white Gaussian noise (AWGN), resulting in improved quality of low-dose CT (LDCT) images. The ensemble approach influences the method noise-based CT image denoising by applying a convolutional neural network to preserve edges and structural details.
The generalized noise model in the CT image is interpreted as (Eq. 1):
 |
(1) |
Where Y1 is the distorted or noisy CT image, X1 is the original or clean image, T is the transform function that distorts the original image, N1 denotes additive white Gaussian noise, and sigma (σ) is the standard deviation. Typically, noise in CT images follows a Gaussian distribution. Method noise is a post-processing approach that can be applied after image acquisition and transmission to preserve edges and structural information (Eq. 2):
 |
(2) |
The differentiation between the noisy CT images and the processed (denoised) output image serves as method noise. The basic assumption is that CT images are distorted by Gaussian noise. Noisy or distorted images are denoised using the Wiener filter, and the resulting image is considered as the denoised CT image. However, the denoised tomographic images still experience blurring, noise, and minor artifacts. Therefore, applying the method noise-based CNN image features to the previously denoised image will yield superior results in reducing noise while preserving more structural details.
3.1. Schematic Diagram of Methodology
The schematic diagram of the methodology is described in Fig. (1).
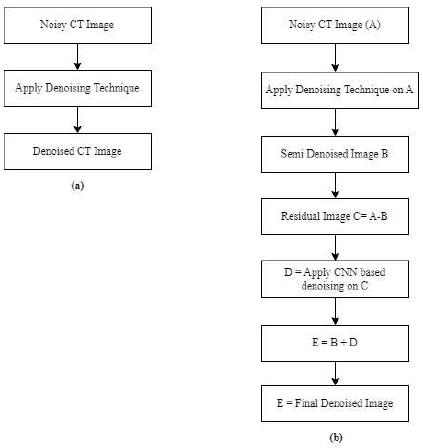
CT image denoising.
(1a). Denoising technique, (1b). Denoising technique using method noise.
3.2. Step-by-step Procedure of Methodology
Input: Read noisy CT image (A).
Output: Final denoised CT image (E).
Step 1: Apply any denoising technique on CT image (A).
Step 2: Apply the wiener filter to the noisy CT image (A).
Step 3: Display denoised CT image (B).
Step 4: Calculate Residual image C = A - B.
Step 5: Calculate image D by applying CNN-based architecture to Residual Image C.
Step 7: Calculate image E = B+D.
Step 8: E denotes the final denoised (enhanced) CT image.
Here, A denotes the original distorted image, C is the residual image, and E is the final denoised CT image.
Method noise-based denoising is a multistep approach for denoising noisy CT images. The first step involves reading a noisy CT image (A). Typically, most of the CT images suffer from Gaussian noise, which often degrades image clarity and quality. Initially, any denoising tech- nique is applied to the noisy CT image (A). A Wiener filter is then used on the noisy image (A) to minimize noise and other minor artifacts, resulting in the filtered CT image (B). However, the filtered or denoised image typically retains high-frequency components and minor artifacts, which may impact diagnostic accuracy.
The noise-making method involves identifying the omitted noise patterns in the denoised CT image (B), which is achieved by subtracting the denoised CT image (B) from the source noisy CT image (A) to calculate the residual image (C). This residual image reveals the remaining noisy patterns. By applying a CNN architecture to the residual image (C), the CNN effectively captures and distinguishes complex noise patterns and relevant image features, enabling the removal of noise while preserving important information in the CT image (D). Finally, the denoised CT image (B) is combined with the generated noise-captured image (D) to create the final denoised CT image (E). This final denoised CT image, produced using the noise method with CNN, guarantees comprehensive noise reduction, thereby improving the quality of the CT image and enhancing the accuracy of diagnostic imaging analysis.
3.3. Significance of Methodology
CT images are commonly affected by Gaussian noise and other minute artifacts, which significantly suppress image quality, complicate image analysis and restoration, and weaken diagnostic accuracy. During the acquisition process, random fluctuations in radiation levels or interference from electronic circuitry frequently cause Gaussian noise. This noise typically impairs the quality and clarity of CT images, ultimately reducing patient diag- nostic outcomes, unlike traditional denoising approaches, which may struggle to differentiate between noise and important structural details. These methods frequently fail to handle complex noise patterns, resulting in over-smoothing and artifacts, such as metal artifacts or photon starvation.
Traditional denoising techniques may face constraints in effectively suppressing noise in CT images while preserving edges and structural information. Various conventional techniques, including Wiener, mean, median, non-local means (NLM), Gaussian filter, discrete wavelet, curvelet, contourlet, and shearlet transform, have been applied to denoise noisy CT images. However, these images often still exhibit blurriness, noise, and other artifacts.
In contrast, the ensemble method, combined with method noise-based CNN approach, effectively denoises noisy CT images while preserving crucial diagnostic information. Method noise serves as a post-processing technique that captures residual noise patterns remaining in an image after denoising. It represents the disparity between the noisy image and the enhanced CT image. Applying the method noise approach using CNNs to denoised CT images enhances clarity and quality compared to conventional techniques. Thus, the method noise approach yields improved denoising results, leading to better image quality for accurate patient diagnosis.
4. RESULT AND DISCUSSION
The following section presents the experimental outcomes related to the denoising technique before and after utilizing the method noise-based denoising technique using CNN on noisy CT images to evaluate denoising effectiveness. The CT images were obtained from the ECLAP public lung image database [26]. The proposed approach was validated using performance metrics, such as Peak Signal-to-Noise Ratio (PSNR), Signal-to-Noise Ratio (SNR), and Structural Similarity Index Measure (SSIM). Graphical evaluations of the CT images are provided as evidence to enhance their efficacy. The images shown in Figs. (1-3) are represented as grayscale images using MATLAB 2022b.
Fig. (4a) illustrates the original clean CT images. The clean CT image was corrupted by adding Gaussian noise, as represented in Fig. (4b), with various noise variances (σ = 5, 10, 15, 20). This addition of Gaussian noise leads to blurriness in the clean CT image.
During the experimental process, Gaussian noise was applied to the CT scan images, resulting in a noise distribution that followed a Gaussian pattern. The purpose of the qualitative analysis is to test the quality of computed tomographic images to provide accurate diagnostic results and to examine the performance and accuracy of the denoising technique at different noise variances. Denoising was performed on a noisy CT image with a size of (512x512) to substantiate the efficiency of the method noise-based denoising technique and to improve qualitative and quantitative assessment. Initially, a standard Wiener filter was employed for denoising the noisy CT images, followed by an evaluation of the performance between the traditional filter method and the method noise-based denoising technique using CNN. Here, PSNR, SNR, and SSIM metrics were applied to measure performance.

CT original noise-free image dataset.

Gaussian noisy CT image dataset.

Outcomes of the impact of wiener-filter without and with method noise-based CT image denoising using CNN with noise variance (σ=5).
The PSNR was utilized to evaluate the performance of the denoising approach effectively. Simulated CT images were used for quantitative analysis, where higher PSNR values indicated better denoising results. PSNR is calculated as (Eq. 3,4):
 |
(3) |
 |
(4) |
Where MSE indicates the mean-square-error among clean CT image in conjunction with denoised CT image.
p(i,j) denotes the clean CT image.
q(i,j) denotes the denoised CT image.
u x v denotes pixel’s size of clean and denoised CT image.
In medical imaging, SNR is a fundamental concept used to measure the quality of CT scan images. It quantifies the relationship between the desired signal and the noisy information.
In the context of denoising CT images, SNR can be calculated as follows (Eq. 5):
 |
(5) |
The signal denotes the intensity strength of the given CT images, while noise signifies the strength of the unwanted variations in the normal pixel values present in the images.
SSIM quantifies the similarity between the denoised CT image and the original CT image. It is primarily based on three determinants: contrast, luminance, and structure. Furthermore, the range of SSIM values is from -1 to 1 (Eq. 6):
 |
(6) |
x illustrates the original or clean CT image.
y illustrates the filtered or denoised CT image.
µx and µy represent the mean and σxy is covariance of x and y and σx, σy represents standard deviation of x and y, respectively, C1=(m1D)2, C2=(m2D)2 are constants to maintain stability during division with zeros, and D is the dynamic variation in the range of pixel’s intensity values between 2bits-per-pixel -1 and m1= 0.01 and m2 = 0.03.
Gaussian noise variance (σ = 5, 10, 15, 20) was applied to the original CT image to test the denoising at different noise levels. After obtaining the noisy CT images, they were denoised using a Wiener filter and compared with the results from the method noise-based CNN technique, as shown in Figs. (4-7).
In the context of the wiener filter, the method noise-based approach evaluates performance using PSNR, which shows good results, no new artifacts are generated, and fine detail preservation is done effectively at noise variance σ = 5 (before method noise PSNR =26.7258 dB, after method noise PSNR =36.0159), σ=10 (before method noise PSNR = 21.5199 dB, after method noise PSNR = 36.5476dB), σ = 15 (before method noise PSNR =18.4166 dB, after method noise PSNR =36.8506 dB), and σ =20 (before method noise PSNR =17.1852, after method noise PSNR = 36.3446 dB) (Tables 1-4).
In the context of evaluating SNR in a wiener filter, CT imaging quality is measured by estimating the ratio of existing signal strength to noise intensity level. Quantitative analysis of SNR takes place at different noise variances, for instance, at σ = 5 (before method noise SNR=20.4936 after method noise SNR=27.0069), σ=10 (before method noise SNR= 16.0766, after method noise SNR=27.5345), σ=15 (before method noise SNR= 13.2027, after method noise SNR=27.8361), and σ=20 (before method noise SNR=11.9811, after method noise SNR=27.3301).

Outcomes of the impact of wiener-filter without and with method noise-based CT image denoising using CNN with noise variance (σ=10).

Outcomes of the impact of wiener-filter without and with method noise-based CT image denoising using CNN with noise variance (σ=15).

Outcomes of the impact of the wiener-filter without and with method noise-based CT image denoising approach using CNN, with a noise variance (σ = 20).
| Noise Level | Without Method Noise | With Method Noise | Without Method Noise | With Method Noise | Without Method Noise | With Method Noise |
|---|---|---|---|---|---|---|
| PSNR | PSNR | SNR | SNR | SSIM | SSIM | |
| 5 | 26.7258 | 36.0519 | 20.4936 | 27.0069 | 0.81056 | 0.9045 |
| 10 | 21.5199 | 36.5476 | 16.0766 | 27.5345 | 0.75017 | 0.91955 |
| 15 | 18.4166 | 36.8506 | 13.2027 | 27.8361 | 0.68607 | 0.92601 |
| 20 | 17.1852 | 36.3466 | 11.9811 | 27.3301 | 0.6178 | 0.91633 |
| PSNR | ||||||||
|---|---|---|---|---|---|---|---|---|
| Gaussian Noise at Different Intensities | ||||||||
| Noise variance (σ) | 5 | 10 | 15 | 20 | ||||
| Denoising Technique | Without Method Noise | With Method Noise | Without Method Noise | With Method Noise | Without Method Noise | With Method Noise | Without Method Noise | With Method Noise |
| Mean [9] | 26.0529 | 35.1902 | 21.1500 | 36.1468 | 18.3205 | 36.9291 | 16.0248 | 37.7658 |
| Median [3] | 27.1834 | 34.9312 | 21.8863 | 35.3494 | 18.7096 | 35.8488 | 16.2900 | 36.3849 |
| Gaussian [27] | 20.3523 | 36.5518 | 16.5739 | 37.4813 | 15.2431 | 37.4031 | 13.3729 | 37.7327 |
| Wiener [10] | 26.7258 | 36.0159 | 21.5199 | 36.5476 | 18.4166 | 36.8506 | 17.1852 | 36.3446 |
| NLM [5] | 27.0700 | 39.7800 | 21.8700 | 38.4300 | 20.0600 | 38.2400 | 17.8200 | 38.7300 |
| DWT [9] | 34.7791 | 53.5667 | 30.4699 | 52.3177 | 28.2170 | 51.5375 | 26.5655 | 50.7858 |
| Curvelet Transform [4] | 27.5145 | 53.0083 | 19.3993 | 45.4610 | 15.1998 | 41.3716 | 14.0099 | 40.2282 |
| Contourlet Transform [28] | 27.0568 | 53.0261 | 19.3171 | 45.4123 | 15.1500 | 41.3616 | 14.0064 | 40.2205 |
| Shearlet Transform [29] | 35.4502 | 37.2012 | 28.1213 | 35.4545 | 24.7320 | 33.5540 | 22.8103 | 32.1602 |
In the context of evaluating SSIM to measure similarity among two images, i.e., the clean or original image and the denoised CT image, quantitative analysis of SSIM is carried out at different noise variances, such as at σ = 5 (before method noise SSIM=0.8105, after method noise SSIM=0.9040), σ=10 (before method noise SSIM=0.7501, after method noise SSIM=0.9195), σ=15 (before method noise SSIM=0.6860, after method noise SSIM=0.9260), and σ=20(before method noise SSIM=0.6178, after method noise SSIM=0.9163). The method noise-based denoising technique gives improvised SSIM results in terms of how well the image-denoising method preserves structural details and perceptual quality.
The performance of various denoising techniques was compared with and without the method noise-based approach. A detailed quantitative analysis evaluated standard denoising techniques using PSNR, SNR, and SSIM, as shown in Figs. (8-13). In this comparative study, different denoising techniques were analyzed, and their performance was assessed under various Gaussian noise levels (σ = 5, 10, 15, and 20), which typically degrade their effectiveness.
| SNR | ||||||||
|---|---|---|---|---|---|---|---|---|
| Gaussian Noise at Different Intensities | ||||||||
| Noise Variance (σ) | 5 | 10 | 15 | 20 | ||||
| Denoising Technique | Without Method Noise | With Method Noise | Without Method Noise | With Method Noise | Without Method Noise | With Method Noise | Without Method Noise | With Method Noise |
| Mean [9] | 21.2511 | 30.3884 | 16.3481 | 31.3450 | 13.5187 | 32.1273 | 11.2230 | 32.9639 |
| Median [3] | 22.3815 | 30.1293 | 17.0844 | 30.5476 | 13.9078 | 31.0470 | 11.4882 | 31.5830 |
| Gaussian [27] | 11.9456 | 27.5597 | 8.6754 | 28.4881 | 7.2412 | 28.4135 | 5.7235 | 28.7356 |
| Wiener [10] | 20.4936 | 27.0069 | 16.0766 | 27.5345 | 13.2027 | 27.8361 | 11.9833 | 27.3301 |
| NLM [5] | 22.2600 | 34.9800 | 17.0700 | 33.6300 | 14.5800 | 15.2600 | 13.0200 | 33.9300 |
| DWT [9] | 29.9779 | 48.7648 | 25.6681 | 47.5159 | 23.4152 | 46.7356 | 21.7637 | 45.9840 |
| Curvelet Transform [4] | 22.7126 | 48.2065 | 14.5975 | 40.6592 | 10.3981 | 36.5698 | 9.2081 | 40.2282 |
| Contourlet Transform [28] | 22.7666 | 48.2242 | 14.5152 | 40.6105 | 10.3481 | 36.5598 | 9.2045 | 40.2206 |
| Shearlet Transform [29] | 31.7083 | 35.0912 | 24.3712 | 31.7124 | 20.8742 | 29.8119 | 18.3733 | 28.7910 |
| - | - | - | - | - | - | - | - | - |
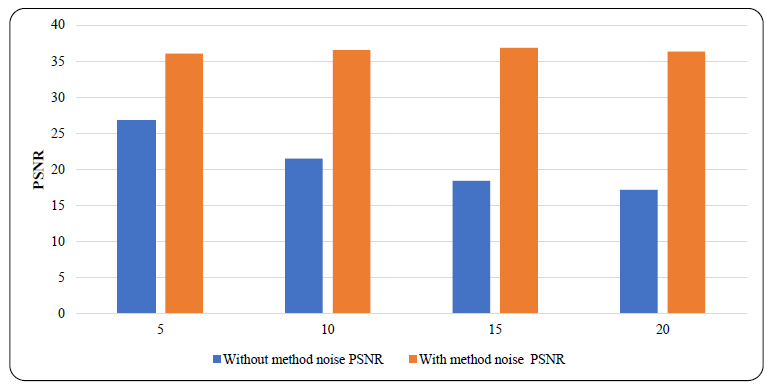
Comparison of PSNR values without and with method noise-based denoising approach using wiener filter by applying various Gaussian noise levels(σ=5,10,15,20).
| SSIM | |||||||||
|---|---|---|---|---|---|---|---|---|---|
| Gaussian Noise at Different Intensities | |||||||||
| Noise Variance (σ) | 5 | 10 | 15 | 20 | |||||
| Denoising Technique | Without Method Noise | With Method Noise | Without Method Noise | With Method Noise | Without Method Noise | With Method Noise | Without Method Noise | With Method Noise | |
| Mean [9] | 0.7874 | 0.8976 | 0.7254 | 0.9166 | 0.6624 | 0.9280 | 0.6070 | 0.9381 | |
| Median [3] | 0.7827 | 0.8874 | 0.7072 | 0.8947 | 0.6339 | 0.9006 | 0.5687 | 0.9069 | |
| Gaussian [27] | 0.5946 | 0.9303 | 0.5246 | 0.9479 | 0.4883 | 0.9521 | 0.4590 | 0.9536 | |
| Wiener [10] | 0.8105 | 0.9040 | 0.7501 | 0.9195 | 0.6860 | 0.9260 | 0.6178 | 0.9163 | |
| NLM [5] | 0.8934 | 0.9607 | 0.8183 | 0.9543 | 0.7697 | 0.9531 | 0.7318 | 0.9567 | |
| DWT [9] | 0.6057 | 0.8216 | 0.4344 | 0.8196 | 0.3386 | 0.8183 | 0.2856 | 0.8167 | |
| Curvelet Transform [4] | 0.5494 | 0.9963 | 0.2350 | 0.9748 | 0.1329 | 0.9436 | 0.1101 | 0.9298 | |
| Contourlet Transform [28] | 0.5515 | 0.9962 | 0.2336 | 0.9751 | 0.1300 | 0.9446 | 0.1091 | 0.9300 | |
| Shearlet Transform [29] | 0.8685 | 0.9253 | 0.5350 | 0.8692 | 0.3753 | 0.8256 | 0.2817 | 0.7910 | |
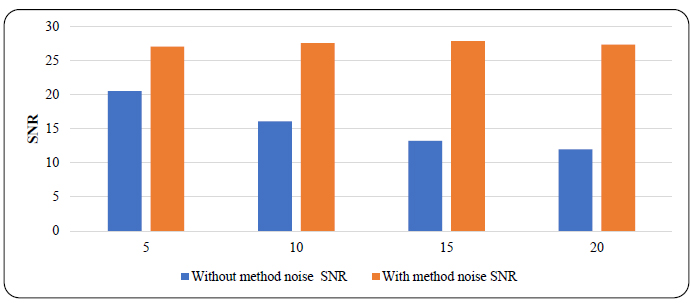
Comparison of SNR values without and with method noise-based denoising technique by applying various Gaussian noise levels (σ=5,10,15,20).
After applying the method noise-based approach, improvements in the quality of the denoised images were observed. This approach consistently enhanced image quality, even at higher Gaussian noise levels. PSNR was used to evaluate the imaging quality of the denoised images compared to the original noise-free images, with higher PSNR values indicating better imaging quality. For example, the outcome of the Wiener filter is shown in Fig. (8). It was observed that, without the method noise approach, the PSNR values decrease significantly as noise levels (σ) increase. Specifically, the PSNR was 26.7258 dB for σ = 5, dropping to 17.87 dB for σ = 20. However, when the method noise-based approach was applied, a notice- able improvement in the PSNR values of the medical images occurred. For σ values of 5, 10, 15, and 20, the PSNR values were 36.0159 dB, 36.5476 dB, 36.8506 dB, and 36.3446 dB, respectively. The method noise-based approach not only enhanced the PSNR but also ensured a more consistent increase in PSNR, even as noise levels rose.
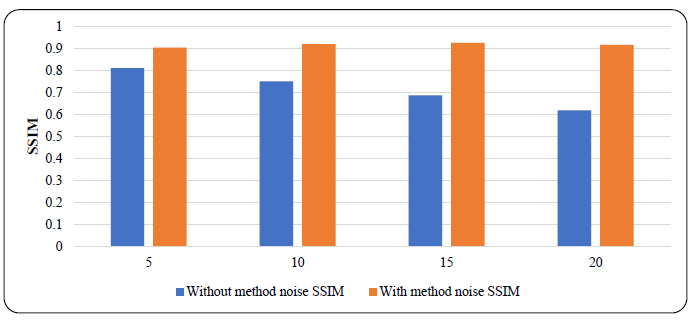
Comparison of SSIM values without and with method noise denoising approach using wiener filter by applying various Gaussian noise levels(σ=5,10,15,20).
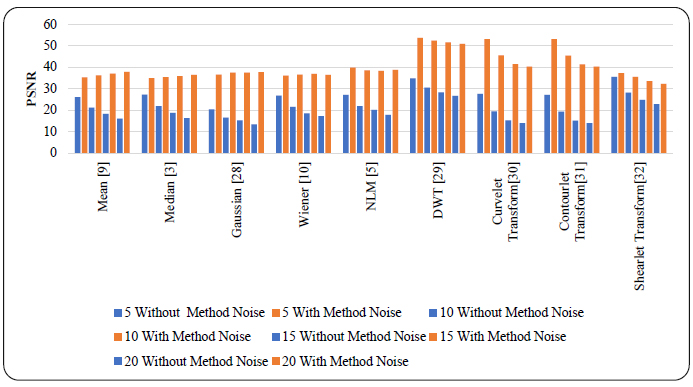
Comparison of PSNR values for various denoising techniques at different gaussian noise intensity levels (σ=5,10,15,20) for CT images, without and with a method noise-based approach.
The SNR was used to evaluate the strength of the signal compared to the noise present in an image. A higher SNR indicated a better-quality image with less noise. For instance, without the method noise-based approach, the standard Wiener filter showed an SNR value of 20.4936 dB for σ = 5, which dropped to 11.9833 dB for σ = 20. In contrast, when the method noise-based approach was applied, a significant increase in SNR was observed as noise levels rose, as shown in Fig. (9). The SNR values were 27.0069 dB for σ = 5, 27.5345 dB for σ = 10, 27.8361 dB for σ = 15, and 27.3301 dB for σ = 20.
Similarly, the SSIM values showed notable improvements at different noise levels. SSIM was used to evaluate perceptual image quality by comparing structural information, contrast, and luminance between two images. SSIM indicates the similarity between two images, with values ranging from 0 to 1, where 1 signifies complete similarity between the original and distorted images, and 0 indicates no similarity. The SSIM values before the method noise-based approach was applied to the Wiener filter were 0.8105 for σ = 5 and 0.6178 for σ = 20. In contrast, after applying the method noise-based approach, the SSIM values for σ = 5, 10, 15, and 20 were 0.9040, 0.9195, 0.9260, and 0.9163, respectively, indicating improved structural similarity despite increased noise levels, as shown in Fig. (10). Furthermore, after the method noise-based approach was implemented, the PSNR, SNR, and SSIM values not only stable but also consistently increased with higher noise levels.
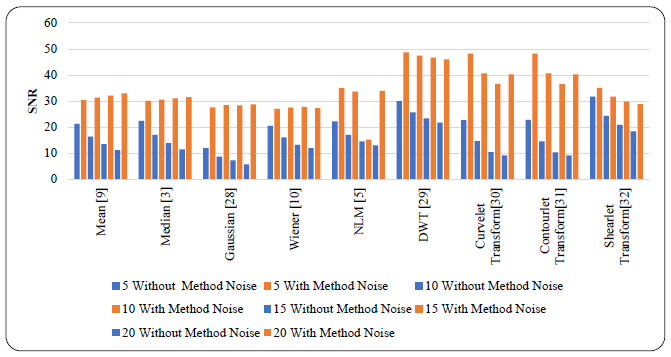
Comparison of SNR values for different denoising methods at various gaussian noise intensity levels (σ=5,10,15,20) for CT images, without and with a method noise-based approach.
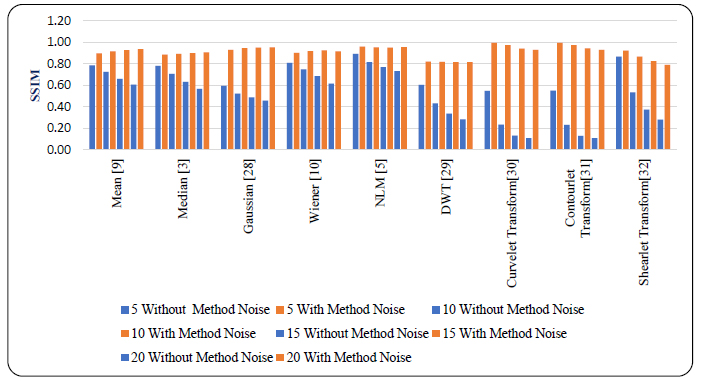
Comparison of SSIM values for various denoising techniques at different Gaussian noise intensity levels (σ=5,10,15,20) for CT images, without and with method noise-based approach.
Overall, the quantitative analysis from Figs. (8-13) demonstrates that the method noise-based approach is highly effective at managing higher noise levels and maintaining fine image details while improving PSNR, SNR, and SSIM values as noise levels rise. The comparative results of this study emphasize that the method noise-based technique is an efficient approach for superior denoising in CT images, ultimately enhancing diagnostic accuracy.
CONCLUSION
Denoising CT images in the medical imaging process is difficult, particularly in CT imaging, where minute anatomical features must be maintained. These images contain a lot of information, which makes noise reduction difficult. The method noise approach, implemented as a post-processing step using CNNs, outperforms classic denoising algorithms. This two-step approach includes twice filtering the noisy CT images, which efficiently reduces noise to a higher degree. Method noise-based denoising improves precision, reducing blurriness and minute artifacts. This method greatly maintains the structural information of the image, sharp edges, and fine details, making it especially useful for a variety of medical imaging applications. The denoised image obtained after the method noise has greater noise reduction and smoothness without adding additional artifacts. The use of the method noise approach with CNNs improves the denoising process, resulting in improved results and diagnostic accuracy for patients by conserving crucial image information.
CT imaging has played a significant role in the medical diagnostic imaging field over the last decade. It is commonly used to diagnose various diseases in detail. However, repeated exposure to radiation may increase the risk of cancer, making it necessary to limit radiation exposure. LDCT image denoising is essential to mitigate this radiation risk. While various denoising methods typically assume Gaussian noise in real-world CT images, these images may also be affected by complex noise patterns. Therefore, developing denoising techniques that address diverse noise sources is a major challenge.
AUTHORS’ CONTRIBUTIONS
It is hereby acknowledged that all authors have accepted responsibility for the manuscript's content and consented to its submission. They have meticulously reviewed all results and unanimously approved the final version of the manuscript.
LIST OF ABBREVIATIONS
| CT | = Computed Tomography |
| CNN | = Convolutional Neural Network |
| NLM | = Non-Local Means filtering method |
| BM3D | = Block-Matching 3D filtering method |
| WNNM | = Weighted Nuclear-Norm Minimization method |
| KSVD | = K-singular value decomposition method |
| REDCNN | = Residual Encoder-Decoder CNN |
| PCCNN | = Progressive Cyclical Convolutional Neural Network |

