
Patterns of Transposable Element Distribution around Chromatin Ligation Points Revealed by Micro-C Data Analysis
Authors Info & Affiliations
Abstract
Background
Transposable elements constitute a significant portion of eukaryotic genomes, yet their role in chromatin organization remains poorly understood.
Methods
This study aimed to computationally investigate the density patterns of transposons around chromatin contact points identified from public Micro-C chromatin conformation data from human cell culture. The density peak patterns of various transposable families and subfamilies were studied within a 100kb window centered on contact points. The analysis was focused on the most abundant transposons, such as Alu and LINE-1.
Results
The computational analysis revealed highly pronounced, non-random density patterns of transposons around the chromatin contact points. The patterns were produced by aligning all ligation points and plotting the average density around them. The patterns were strikingly different between transposable element families and substantially different between the members of the families. The patterns were found to be reproducible across independent studies and biological replicates. Among major families and subfamilies, no members were found to have reproducible density patterns around the contact points. Randomly generated coordinates produced less pronounced patterns, which were not correlated between replicates as expected for the negative control.
Conclusion
Some families showed enrichment, and others demonstrated depletion at contact points, while 100Kb window-wide patterns remained correlated between biological replicates. The patterns were asymmetric relative to the chromosomal orientation. Additionally, the patterns were oriented relative to the transposon sequence direction.
1. INTRODUCTION
Transposable elements (TEs) constitute a significant portion of eukaryotic genomes, often comprising more than half of the genomic content in many species. Once considered “junk DNA”, these mobile genetic elements have been increasingly implicated in various aspects of genome function and evolution [1, 2]. Previously, we have emphasized that transposable elements can serve an important positive biological function as anchors and regulators of chromatin folding [3-10]. Recent advancements in chromosome conformation capture techniques, particularly Micro-C and Hi-C, have enabled high-resolution mapping of chromatin interactions [11], revealing the three-dimensional organization of the genome.
The rationale behind our investigation stems from the hypothesis that repetitive elements, due to their sequence homology, might provide sequence-specific anchors for chromatin folding. This aligns with emerging views of spatial-temporal genome regulation, where chromatin organization plays a key role in cellular responses [12]. This hypothesis is based on the idea that homologous sequence structures may form homologous contacts in the nucleoplasm. In other words, two identical double helices would adhere to each other. Since TEs are highly repetitive, we hypothesized that they form adhesive contact points in chromatin folding. To test this, we examined the distribution of TEs around the chromatin contact points identified through micro-C experiments. Since the contact points are measured via ligation and sequencing, the exact positions of ligation points (LPs) can be reconstructed from the Micro-C data. Then, we mapped the density patterns of various families and subfamilies of TEs.
Our study mainly focused on two of the most abundant TE families in the human genome: Alu elements, short interspersed nuclear elements (SINEs) approximately 300 base pairs in length, and LINE-1 (L1) elements, long interspersed nuclear elements that can span several kilobases. However, additional families were also studied.
2. METHODS
2.1. Public Chromatin Conformation Capture Datasets
We analyzed chromatin interaction data from four independent datasets to identify ligation points (LPs). Dataset 1 (DS1) and Dataset 2 (DS2) were produced by Micro-C: SRR12625672 and SRR12625674 (biological replicates from HUDEP cell line, ~43M paired-end reads each, 150nt; https://www.ncbi.nlm.nih.gov /sra/SRR1 2625672). The Micro-C protocol employs micrococcal nuclease digestion, achieving nucleosome-level (~200bp) resolution.
Datasets 3 and 4 (DS3 and DS4) were produced by Hi-C: SRR27906244 and SRR27906243 from the GM13977 cell line (~75M paired-end reads each). Hi-C libraries were constructed using a standard protocol with restriction enzyme digestion (MboI, MseI, or NlaIII), which typically produces 2-6 kilobase fragments, followed by biotin incorporation and proximity ligation. The Hi-C data were obtained from NCBI Bioproject PRJNA1074296 (https://www.ncbi.nlm.nih.gov /bioproject /1074296) and processed using JuicerTools v1.14.08. Despite the methodological differences between Micro-C and Hi-C, all datasets were analyzed using identical parameters for TE density patterns and correlations.
2.2. Identification of Ligation Points
Although contact points in the chromatin conformation capture are called points, they are imprecisely defined and are actually represented by short fragments. Yet, it is possible to define precisely to a single nucleotide which sequences were ligated in the assay. The first step in the analysis was to identify the exact positions of the ligation points on the genome. The method identifies ligation points with single-nucleotide precision by using the alignment of paired-end reads to the genome. In Micro-C, most paired reads overlap, forming a continuous sequence. This sequence corresponds to the real physical fragment (ligated_fragment) produced by ligation in chromatin conformation capture. For each paired read, we reconstructed the ligated_fragment sequence by aligning paired reads. Next, we aligned the ligated_fragment against the genome. Only those paired reads were retained where two parts of the ligated_fragments (called here arms) aligned to the same chromosome and were positioned at least 1Kb apart. Once the arms were aligned, the exact position of coordinates of the chromosomes that were ligated to each other in the assay were identified (LP1 and LP2). The pipeline for the identification of the ligation points was called LigP_finder_v2 (the Python code for LigP_finder_v2 can be downloaded from: https://github.com/maxrempel /DRRF/tree/ main/LigP_ finder-main).
All datasets were processed using whole-genome alignment in LigP_finder_v2.
When applied to Hi-C datasets, the program produced fewer ligation points since the reads in Hi-C did not overlap, but the number of found ligation points was sufficient to produce TE density pattern plots and correlations. In general, the amount of data from the experiments was in excess since the plots did not visually deteriorate even when a single small chromosome was used for pattern plotting. The pattern was consistent across chromosomes, although the density of ligation points varied widely, about 10-fold between chromosomes, reflecting variable compaction of chromosomes in given cell lines.
To test whether the program was correct, we ran tests using synthetic data and performed a spot-check of the results. Also, the final program was described in English algorithm, and reprogrammed from scratch by another remote programmer. The recreated program produced identical results, demonstrating that both programs were correct.
The ligation points, LPs, were obtained with hg38, unmasked version from: https://hgdownload.soe.ucsc.edu /goldenPath /hg38/bigZips /hg38.fa.gz.
We used the hg38 transposable element (TE) annotation from UCSC (https://hgdownload.soe.ucsc.edu /goldenPath /hg38/bigZips /hg38.fa.out.gz).
2.3. Plotting Density Patterns
For each identified LP, we examined the genomic regions extending 50kb in both directions, which we termed “exbors” (from EXtended harBORS). Within these regions, we cataloged the density of transposable elements using bedtools and function intersect. In that, the rigth and left-oriented elements were analysed separately. We focused on the most abundant TE families and subfamilies based on their genomic copy numbers.
To quantify TE density patterns, we calculated TE density in 1kb bins across the 100kb window centered on each LP. Importantly, we conducted separate analyses for elements on the plus and minus strands to investigate potential strand-specific (same as orientation-specific) patterns. To visualize these density patterns, we smoothed the density curves with the Kernel Density Estimation (KDE) smoothing method.
For negative controls, we performed random control analyses. This involved generating random LP positions across the genome in excess and selecting those random coordinates that were located in non-repeat-masked (unique) regions across the whole genome. Then, real and random coordinates of LPs were compared using density and correlation plots. To control for programming errors, three programmers (DO, AV, and MM) reproduced the prlots independently, and the plots came out identical. Correlations between density pattern plots were calculated using the Pearson correlation and visualized as diagonal heatmaps. The Python code for LigP_finder_v2 also contains TE density pattern plotting with KDE smoothing (https:// github.com /maxrempel /DRRF/ tree/ main /LigP_ finder- main).
Some plots are shown in the results section, and others are shown in the supplementary materials pdf file.
2.4. Analysis of Harbor Homology
To measure sequence similarity between harbor pairs, we extracted ±5 Kb sequences around each ligation point (10kb total harbor size). Sequence alignment was performed using minimap2 with the 'sr' preset and minimum 70% identity threshold. To compare within-pair versus between-pair homology, we analyzed sequence similarity between harbors from the same ligation point pair (REAL) versus harbors from different ligation point pairs (CONTROL). Both unique/low-copy sequences (regions remaining after repeat masking) and total sequences (unmasked) were analyzed. Pairs with overlapping harbors (distance < 10kb) were excluded from the analysis. The Python code for homology analysis is available at https:// github.com /maxrempel /DRRF/ tree/main /LigP_ finder- main.
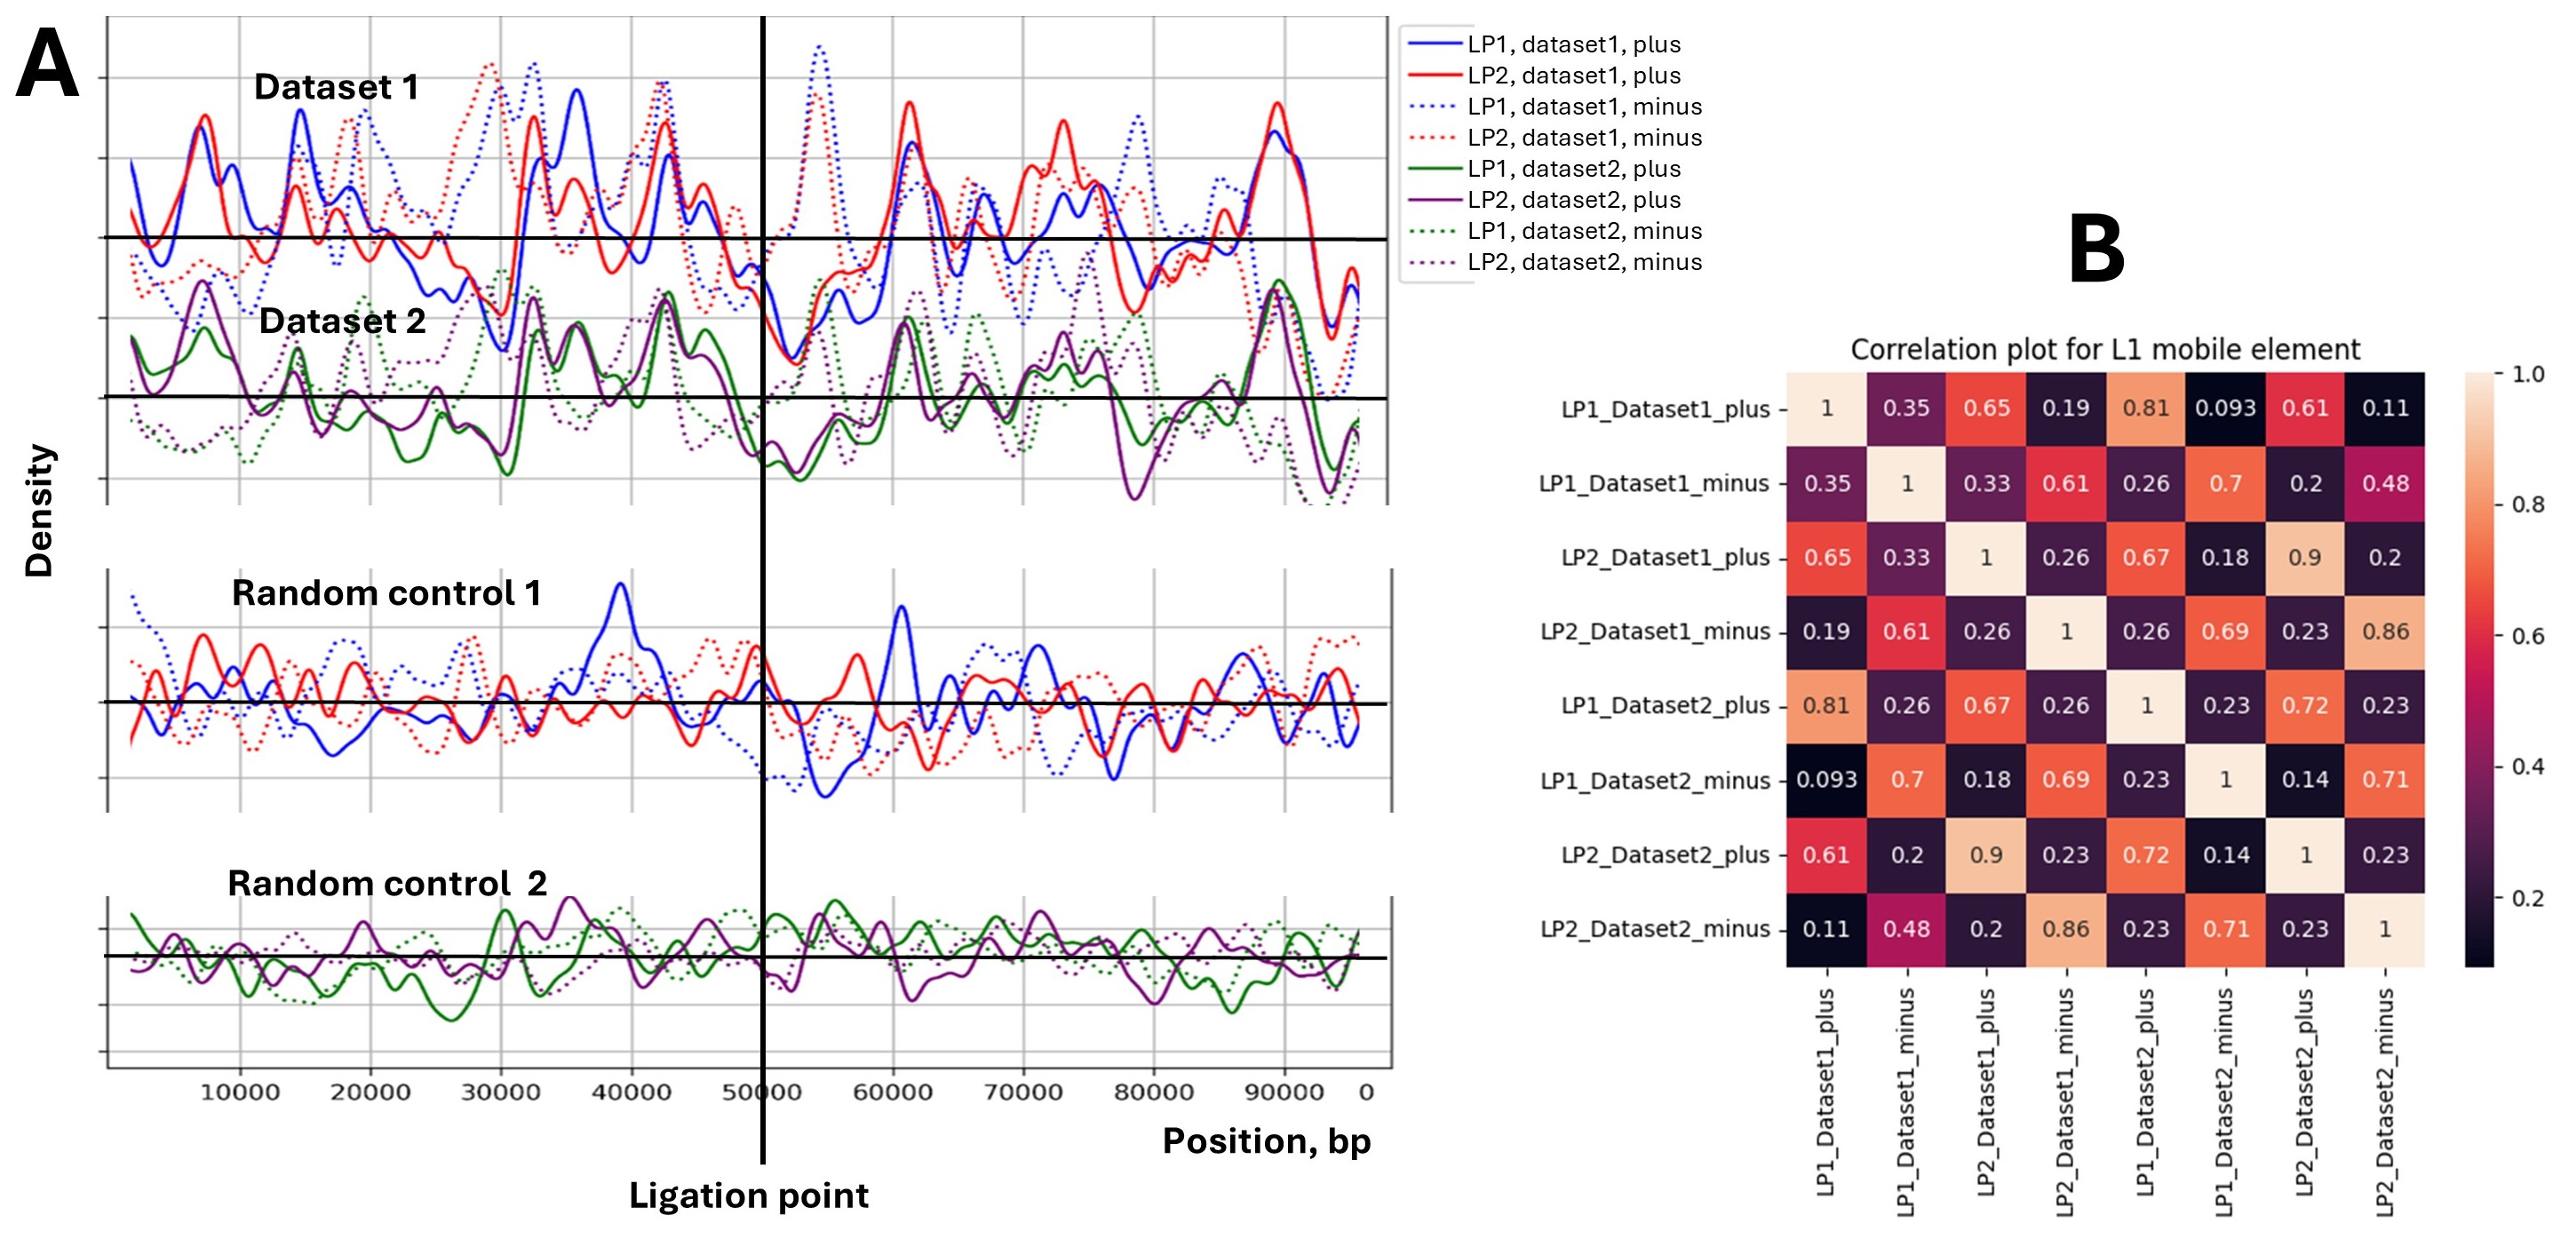
Distribution of L1 transposable elements around chromatin ligation point. Panel A. The density of L1 elements (a major subfamily of Long Interspersed Nuclear Elements or LINEs) relative to chromatin ligation points (LPs) in two experimental Micro-C datasets and their corresponding random controls. The x-axis represents the position relative to the LP (vertical black line at 50,000 bp), spanning 100 kb. The y-axis shows the density of L1 elements (count of L1 elements divided by the bin size, bp). Solid lines represent L1 elements in the plus strand (therefore oriented left to right), and dotted lines represent the opposite-oriented L1 elements labeled as the minus strand. Dataset 1 (blue/red) and Dataset 2 (green/purple) show experimental data for LP1 and LP2 regions. LP1 and LP2 ligation points are numbered from left (start) to right (end) of the chromosome. Random controls 1 and 2 correspond to Datasets 1 and 2, respectively, generated using randomized LP positions. The graphs are oriented from left to right on the chromosome. Panel B shows a correlation heatmap comparing L1 element density patterns between different datasets and strands. The color intensity represents the Pearson correlation coefficient, with lighter colors indicating stronger correlations. The heatmap reveals strong correlations between biological replicates (Dataset1 and Dataset2) for the same strand orientation, while plus and minus strands show notably weaker correlations, quantitatively confirming the strand bias observed in panel A.
3. RESULTS
For each tested transposable element (TE) family, we produced TE density patterns in 100 Kb windows (“harbors”) around chromatin ligation points (called LPs) identified in Micro-C and Hi-C chromatin conformation assays. We examined the density of six major transposable element (TE) families: Alu, L1 (LINE-1), L2 (LINE-2), Medium Reiterated Frequency Repeat (MER), Mammalian-Wide Interspersed Repeats (MIR), and Mammalian Long Terminal repeat (MLT) elements, as well as the most frequent subfamilies and the most frequent TEs: L1 and Alu. Fig. (1) presents the distribution of L1 elements around LPs (ligation points).
Fig. (1) presents a view of L1 transposable element distribution around chromatin ligation points (LPs) identified through Micro-C experiments. L1, or LINE-1, is a major subfamily of Long Interspersed Nuclear Elements (LINEs) comprising about 20% of the human genome. The data reveal patterns that suggest a non-random association between L1 elements and chromatin structure.
Key observations from the figure include:
- Pattern reproducibility: Panel A shows a similarity in the distribution patterns between Dataset 1 and Dataset 2. This consistency across independent datasets strengthens the biological significance of the observed patterns, which is quantitatively confirmed in Panel B by high correlation coefficients (>0.8) between datasets for corresponding strands.
- Strand-specific patterns: The plus and minus strands show distinct patterns (Panel A), which is quantitatively supported by the low correlation coefficients (0.2-0.4) between the plus and minus strands in Panel B.
- Depletion at the ligation point: There is a noticeable dip in L1 density directly at the ligation point (50,000 bp). This depletion indicates the exclusion of L1 elements from immediate chromatin contact points.
- Random controls: The random control datasets in Panel A show markedly different patterns characterized by less pronounced fluctuations and lack of correlations between datasets and within pairs of ligation points. This contrast underscores the biological significance of the patterns observed in the experimental data.
These findings suggest a sequence-specific role of L1 elements in chromatin folding, with patterns indicating their selective retention in specific chromatin environments. Future studies should focus on understanding the mechanisms driving these distribution patterns.
Fig. (2) presents the distribution of Alu elements around chromatin ligation points (LPs) identified through Micro-C experiments. Alu elements, the most abundant member of Short Interspersed Nuclear Elements (SINEs), comprise approximately 11% of the human genome.
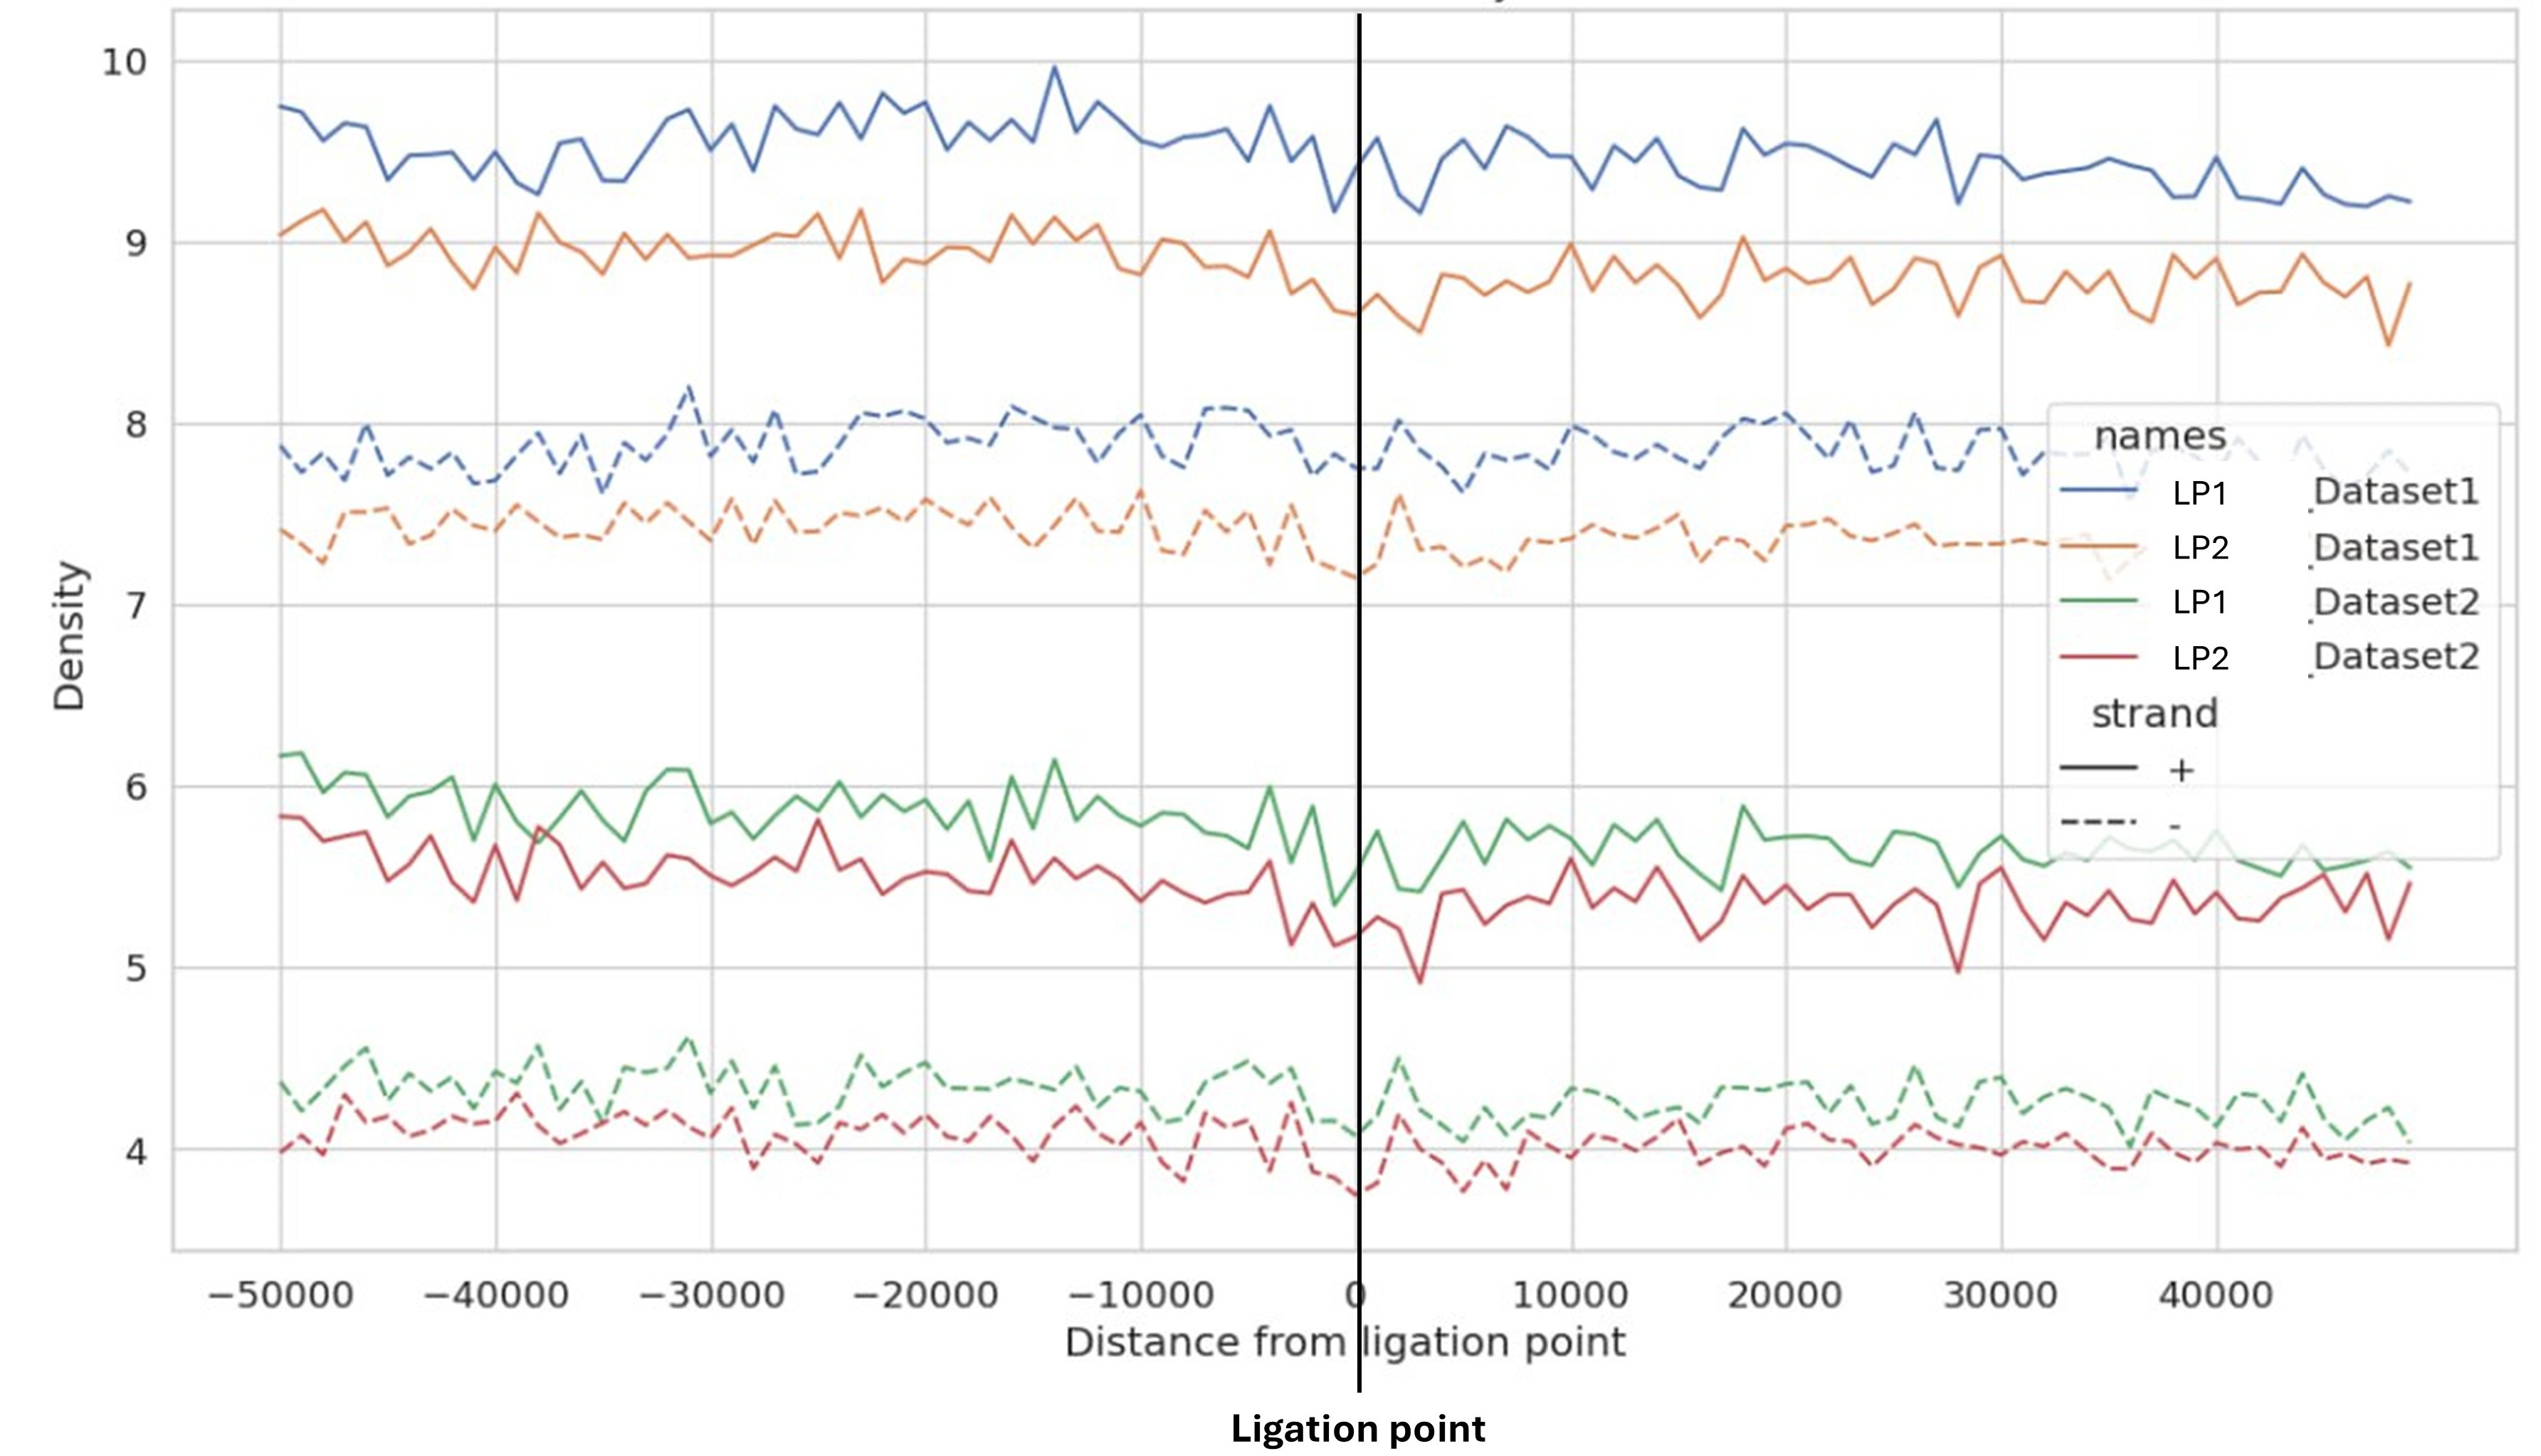
Distribution of Alu transposable elements around chromatin ligation points. The density of Alu elements (a subfamily of Short Interspersed Nuclear Elements or SINEs) relative to chromatin ligation points (LPs) in two experimental datasets. The x-axis represents the distance from the LP (at 0), spanning 100 kb (-50,000 to +50,000 bp). The y-axis shows the density of Alu elements. Solid lines represent the plus strand, and dotted lines represent the minus strand. Dataset 1 (blue/orange) and Dataset 2 (green/red) show data for LP1 and LP2 regions. The y-axis shifts are added artificially to prevent overlap of the curves.
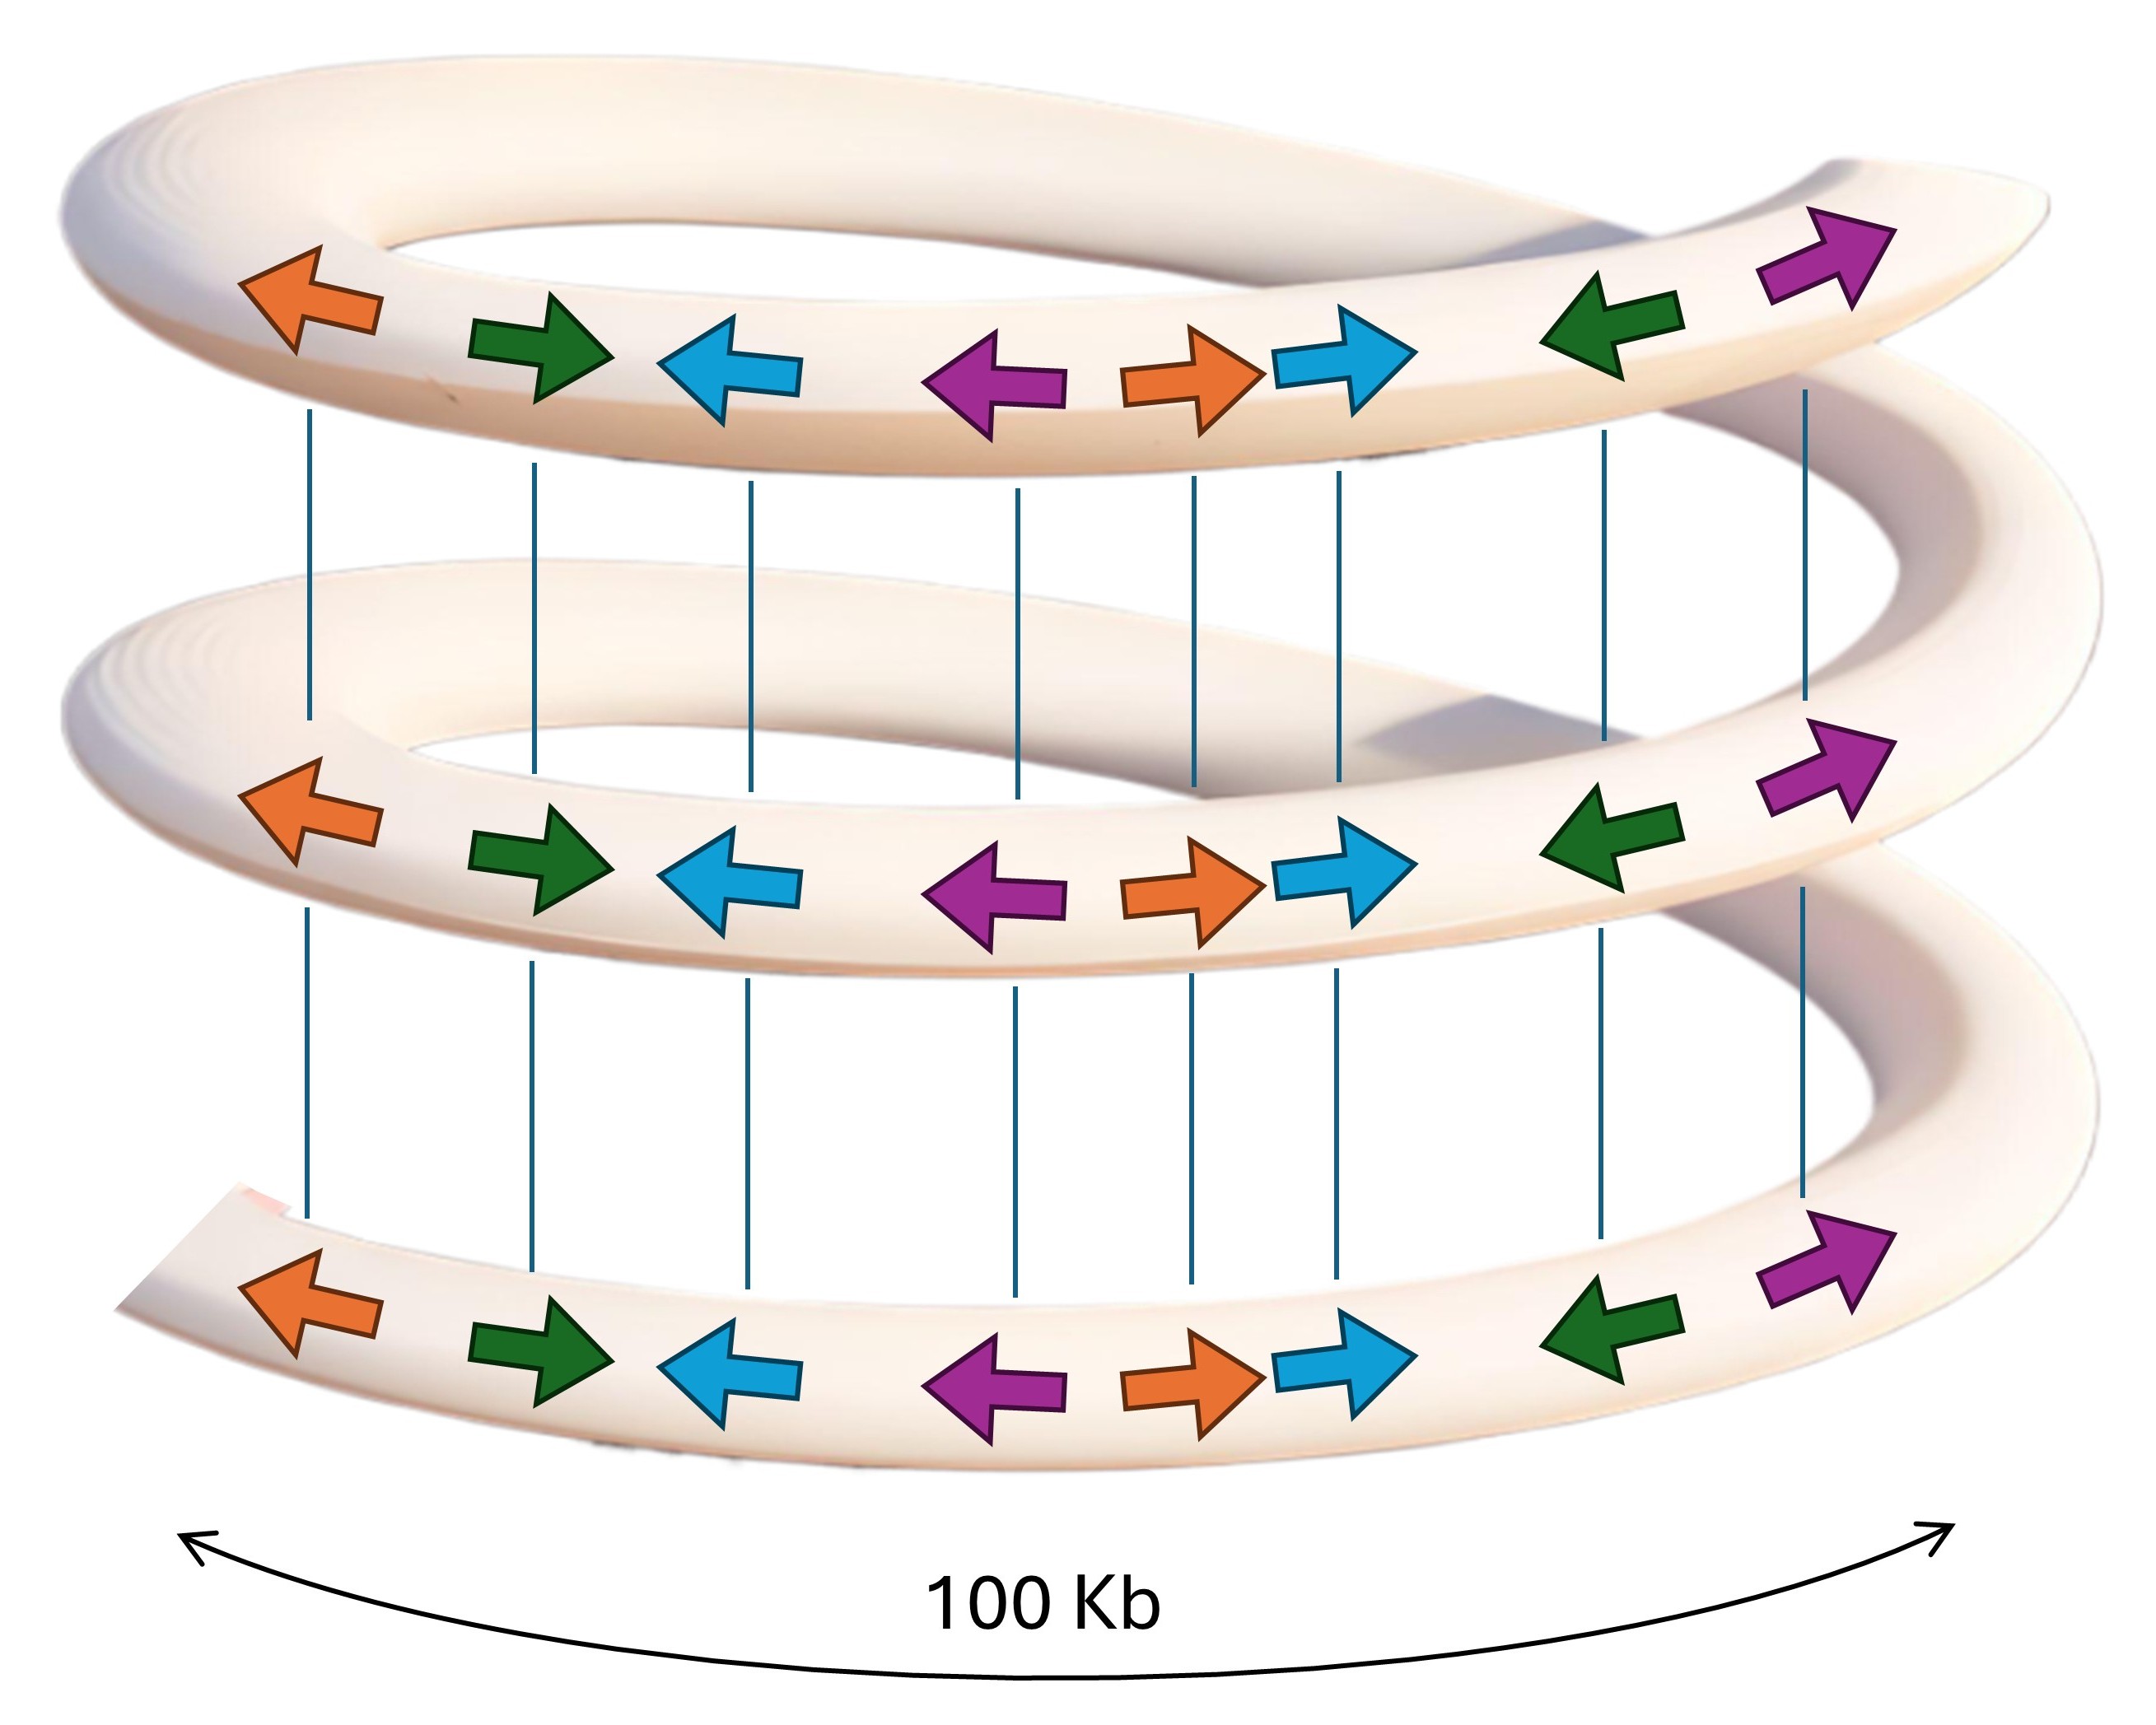
Model of homological adhesion in chromatin folding.
Key observations from Fig. (2) reveal consistent patterns in Alu element distribution around chromatin ligation points. The patterns are consistent across datasets and ligation points. As for other TEs, a strand difference was observed, with the plus strand (represented by solid lines) displaying different density patterns compared to the minus strand (dotted lines). This asymmetry was consistent in all tested datasets and was observed in every other tested TE family.
3.1. Additional Transposable Elements
Our analysis of transposable element (TE) distribution around chromatin ligation points (LPs) revealed that each TE family and subfamily has a distinct density pattern around ligation points. We examined the density of six major TE families: Alu, L1, L2, MER, MIR, and MLT elements, as well as several subfamilies within these groups, within a 100 kb window centered on LPs identified through Micro-C experiments (Fig. 1 for L1, Fig. 2 for Alu; Supplementary Figures for all tested TE families and subfamilies).
The distribution patterns observed in every examined TE family had very similar trends to the trends observed for L1 elements (Fig. 1). However, the density patterns around the ligation points were unique for each tested TE family and subfamily.
Moreover, the patterns for all the TE families and subfamilies were asymmetric relative to the ligation points, oriented with respect to chromosome direction (with the short arm (p) positioned towards the left, following standard genomic convention). This asymmetry indicates that transposon directionality relative to chromosome orientation participates in chromatin folding. The consistency of these patterns suggests that the evolutionary selection of transposon placement produced long-range chromosome-wide orientations of transposons. Such large-scale genomic patterns may represent fundamental principles of chromosome organization that persist through evolution.
Since every tested TE family and subfamily produced consistent density patterns around the ligation points, this suggests the fundamental role of transposable elements in sequence-specific chromatin folding that transcends the specific characteristics of individual TE types. The observed strand biases and dataset-specific variations appear to be general features of how TEs are distributed relative to chromatin contact sites.
To exclude potential methodological artifacts, we utilized Hi-C data (Datasets 3 and 4) to validate our findings. While both Hi-C and Micro-C capture chromatin conformation, they differ fundamentally in their digestion methods; Hi-C uses restriction enzymes producing fragments of several kilobases, while Micro-C employs micrococcal nuclease digestion, achieving nucleosome-level (~200bp) resolution. Despite this resolution difference, Hi-C data reproduced the key patterns of transposable element distribution around contact points, with correlation coefficients between biological replicates reaching 0.7-0.8 for same-strand comparisons and remaining below 0.2 for opposite strands (Supplementary Figures). This cross-method validation confirms the strand-specific organization of transposable elements around chromatin contact points. While absolute correlation values between datasets from different laboratories and cell lines were not expected due to the tissue-specific nature of chromatin organization, the fundamental patterns were consistently reproduced: strong correlations between biological replicates and between members of ligation point pairs and strong strand asymmetry. These patterns were reproduced despite using cell lines from different blood lineages (HUDEP erythroid progenitors (datasets 1 and 2) vs. GM13977 lymphoblastoid cells (datasets 3 and 4)), suggesting that the results reflect a common principle in chromatin organization.
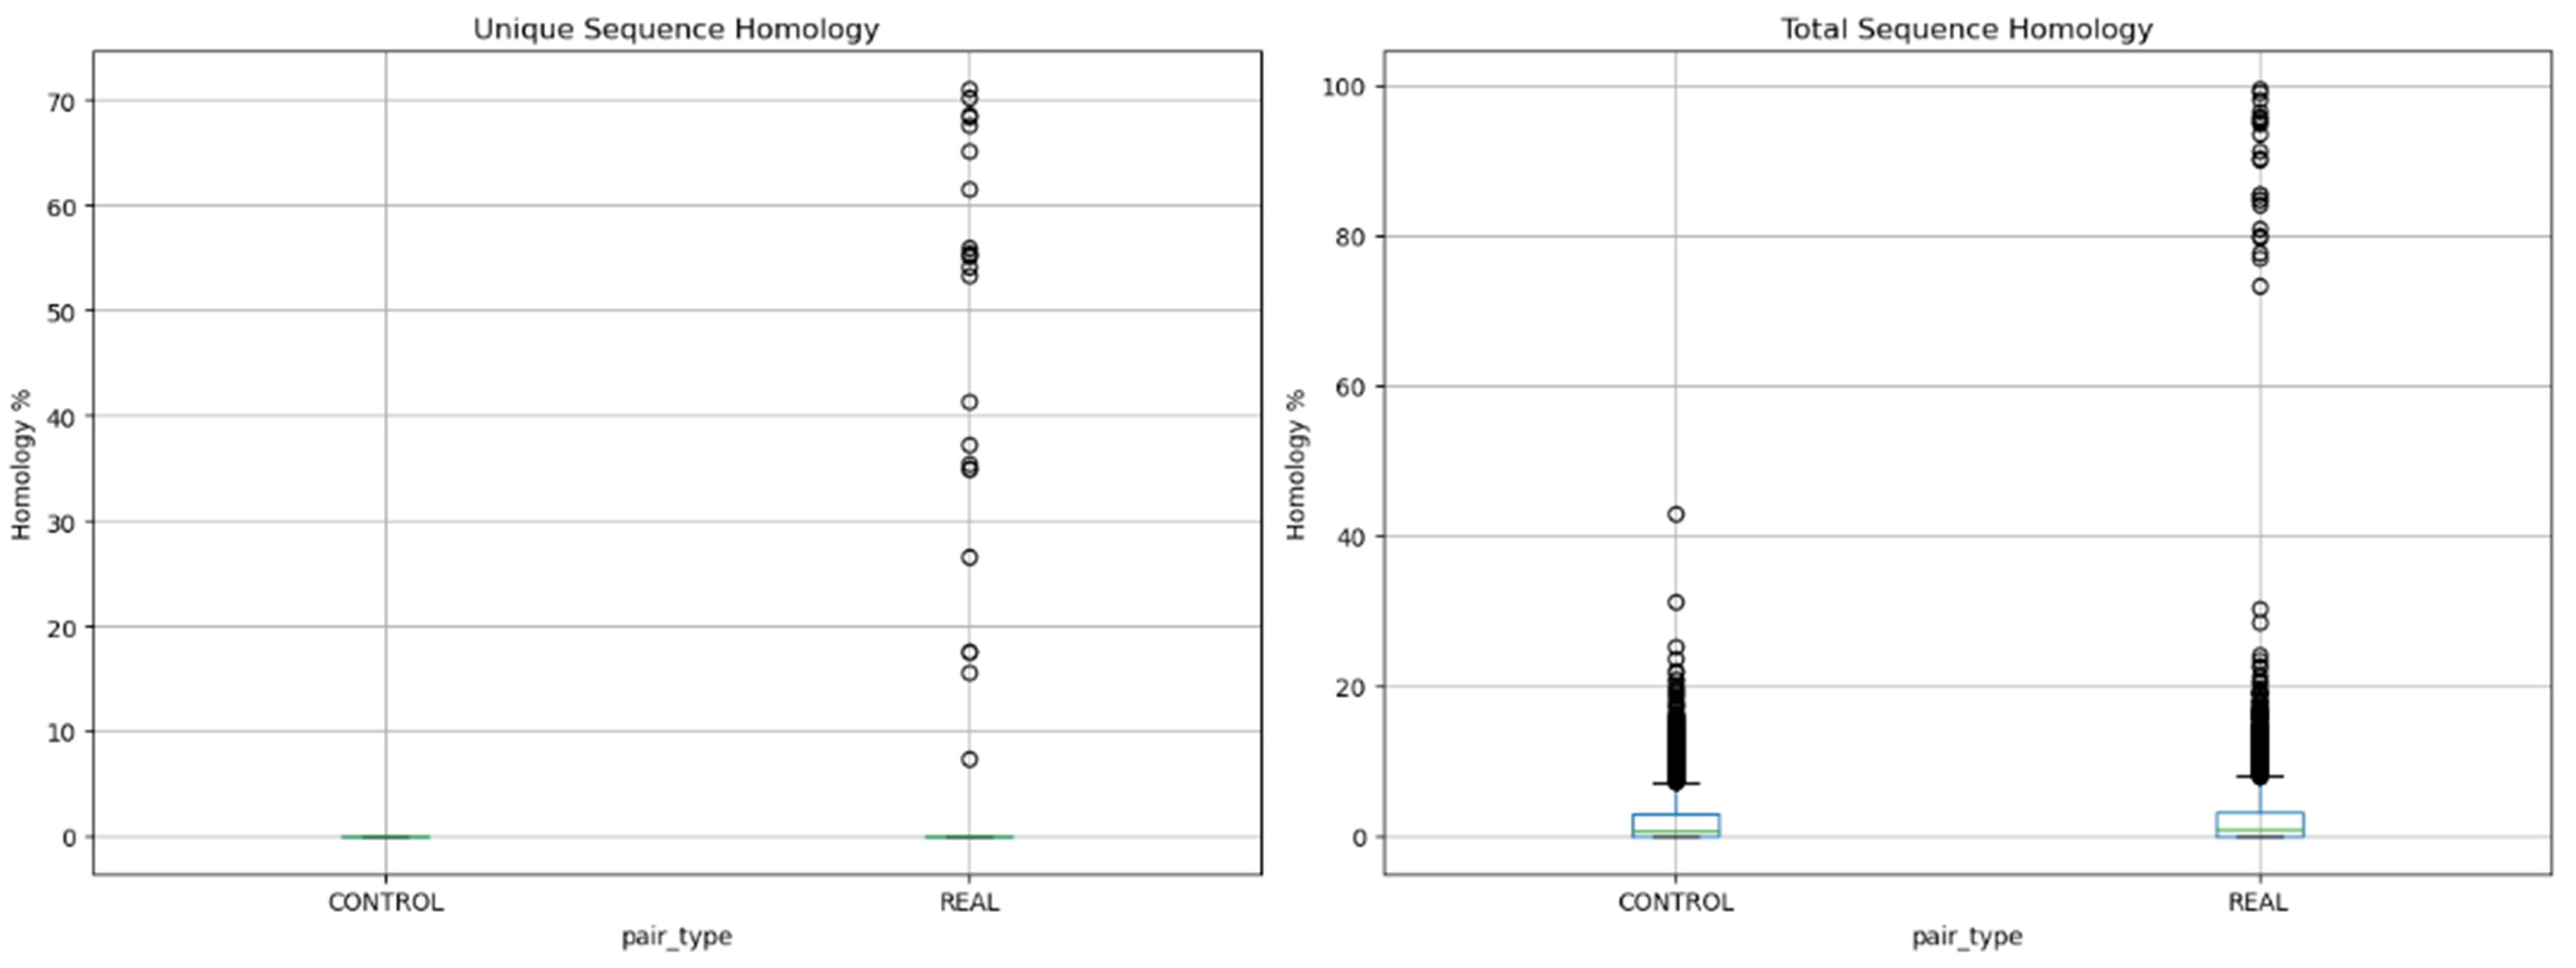
Distribution of sequence homology within and between ligation point pairs. Panel A shows homology in unique and low-copy sequences left after masking. Panel B shows total sequence homology from the unmasked sequence. For real comparisons, we measured homology between two harbors from the same ligation point pair (within the LP pair). For control comparisons, we measured homology between harbors from different ligation point pairs (between LP pairs).
3.2. Asymmetric Distribution Suggests Homological Adhesion
We noticed that the asymmetry of transposable element density patterns relative to chromosome orientation suggests tandem-like organization. However, we found no periodic repetition of these patterns, suggesting an aperiodic repetition of patterns that maintains directional consistency. Coincidentally, this aligns with Schrödinger's description of the hereditary material as aperiodic crystal [13].
The figure shows how patterns of identical transposon sequences (arbitrarily placed colored arrows) can serve as contact points through sequence-specific homological adhesion. The 100 Kb window demonstrates the alignment of identical transposons creating interactions between distant chromatin regions (Fig. 3).
We propose that this aperiodic but directional repetition of TE patterns functions in chromatin architecture through homological adhesion, where identical sequences, particularly transposable elements, can form contact points through sequence-specific adhesion of identical sequences. Here, we propose for the first time that two parallel double helices of DNA can adhere to each other when their sequences are identical, forming the molecular basis for homological adhesion. The density plots reveal that the patterns are asymmetric and face in one direction on chromosomes. Since they face in one direction on chromosomes, they could serve as specific anchors for homological adhesion and the formation of large-scale helices (Fig. 4).
We next tested if the sequences that come together in chromatin display homology. As a negative control, we measured homology between unpaired unligated harbors from different harbor pairs. Comparing harbors (ligated fragments) from the same harbor pair versus different pairs revealed strong enrichment of homology in ligated regions. In unique and low-copy sequences, within-pair homology reached 70%, while between-pair homology remained near zero (mean 0.47% vs 0.02%). The signal persisted in an unmasked sequence, with within-pair homology reaching 100% compared to a maximum of 40% between pairs. This provides quantitative evidence for sequence-specific homological dsDNA-dsDNA adhesion in chromatin contacts.
4. DISCUSSION
The patterns of TE distribution around chromatin ligation points observed here provide insight into the potential role of TEs in chromatin folding. We discovered consistent strand asymmetry across TE families, which indicates systematic evolutionary pressures governing transposon organization. While general principles of transposon insertion have been described [14], this chromosome-wide directional bias has not been previously reported.
The density patterns around ligation points were distinct for each TE family. Alu elements showed proportionally scaled patterns with multiple peaks, reflecting their higher copy number, while L1 elements displayed fewer but more pronounced peaks.
4.1. Homological Adhesion
The discovery of the density patterns of transposable elements around the chromatin contact sites and of the homology between contacting DNA sequences offers support for homological adhesion. This is referred to as “homadhesion” for brevity. Homadhesion is the adhesion of two DNA duplexes (double helixes) to each other if they have similar sequences.
Several studies provide support for sequence-dependent attraction between DNA duplexes. Yoo et al. [15] demonstrated sequence-dependent attraction between double-stranded DNA molecules using molecular dynamics simulations and single-molecule FRET experiments. They showed that DNA duplexes can attract each other over distances up to 2-3 nm in the presence of polyamines like spermine. Importantly, AT-rich sequences showed stronger attraction than GC-rich sequences, and DNA methylation enhanced these interactions.
Lee et al. [16] provided theoretical support for sequence-dependent attraction between intact DNA duplexes. Their model incorporated electrostatic forces and sequence-dependent DNA shape variations, predicting lower interaction energies for pairs of DNA fragments with parallel homologous sequences compared to those with uncorrelated sequences. This interaction was modeled without strand separation, considering the aqueous environment through parameters that account for electrostatic screening in solution.
Barzel and Kupiec reviewed the evidence for the pairing of similar DNA sequences across different organisms [17]. They noted that in yeast, matching DNA sequences can locate each other and recombine efficiently even when in different genomic locations despite the large amount of genomic DNA present. Their review suggested that similar sequences are paired as part of the genome's basic organization.
For the adhesion mechanism itself, several forces could be considered: electrostatic (including ionic), hydrophilic-hydrophobic, hydrogen bonding, van der Waals, and other weak forces. The dynamic nature of chromatin condensation and decondensation suggests that DNA duplexes remain nearly intact during these interactions. While hydrated DNA structure may be primary in mediating adhesion, other nucleoplasmic components likely participate, including histones, other proteins, and low molecular weight chemicals. The highly negatively charged DNA duplexes must overcome electrostatic repulsion to adhere. This requires neutralization by positive ions present in the nucleoplasm, including protons (H+), hydronium ions (H3O+), positively charged histones and other proteins, and ions such as Na+, K+, Mg2+, and polyamines like spermine and spermidine.
CONCLUSION
This discovery of consistent density patterns in transposable elements around chromatin contact points suggests a functional involvement of TEs in sequence-specific chromatin folding and homological adhesion. The observed asymmetry of patterns relative to chromosome orientation and transposon orientation suggests the existence of chromosome-scale sequence organization that was not previously known.
This opens new opportunities for research into the role of transposable elements in sequence-specific chromatin folding and, through that, in genome regulation. The organization of chromatin through networks of interacting domains has been previously described [18], though not through the lens of transposon-mediated interactions we report in this study. Future work should focus on elucidating the mechanisms underlying the observed density patterns and investigating their potential implications for genome regulation and function. Exploring these patterns across different cell types, developmental stages, and organisms could provide valuable insights into the evolutionary conservation and functional significance of TEs in chromatin folding [19].
The sequence-specific principles of genome organization are known to operate across multiple scales, from local loop formation to chromosome territories. Dixon et al. [20] demonstrated how chromatin organization changes systematically during cellular differentiation. The importance of repetitive elements in nuclear organization was highlighted by Cournac et al. [21], showing correlations between similar repetitive elements and 3D folding patterns. Studies on chromosome territories by Cremer et al. [22] revealed principles of nuclear organization. Moreover, Rowley et al. [23] established evolutionarily conserved principles of 3D chromatin organization. The emerging picture of genome architecture was developed by Bonev et al. [24], who mapped dynamic changes in genome organization during development. Our finding of chromosome-orientation-dependent patterns in TE densities around contact points suggests an additional layer of sequence-encoded structural information that may help explain these organizational principles.
As our understanding of genome organization continues to evolve, it is becoming increasingly clear that a comprehensive view of genomic function must include consideration of transposable elements. This work lays the foundation for future investigations into the role of transposable elements in chromatin folding.
AUTHORS’ CONTRIBUTIONS
The authors confirm their contribution to the paper as follows: data analysis and interpretation of results: AVV; visualization: MMR and MVMR; investigation: OOP; draft manuscript: IVS, AAV, and AYS. All authors reviewed the results and approved the final version of the manuscript.
LIST OF ABBREVIATIONS
| TEs | = Transposable elements |
| LPs | = Ligation points |
| SINEs | = Short Interspersed Nuclear Elements |
| TE | = Transposable element |
AVAILABILITY OF DATA AND MATERIAL
All the data and supporting information are provided within the article.
FUNDING
The work and the DNA Resonance Research Foundation (DRRF) were funded by MM. The publication fee was paid with AV's reviewer's vouchers.
ACKNOWLEDGEMENTS
The authors would like to thank Jekaterina Erenpreisa for providing valuable suggestions. AV would like to acknowledge the support provided by the RUDN USAL Program.

