
Enhancing Early Diagnosis of Type II Diabetes through Feature Selection and Hybrid Metaheuristic Optimization Techniques
Abstract
Introduction
Type-II Diabetes Mellitus (T2DM) is a chronic metabolic disorder characterized by elevated blood glucose levels, posing a critical global health challenge. It is largely attributed to lifestyle changes, unhealthy dietary habits, and lack of awareness. If not diagnosed early, T2DM can lead to severe complications, including damage to vital organs such as the kidneys, heart, and nerves. While timely and accurate diagnosis is crucial, current diagnostic procedures are often costly and time-consuming, necessitating innovative approaches to improve early detection. This study aimed to enhance the early prediction of T2DM by leveraging advanced hybrid metaheuristic optimization algorithms to improve model efficiency, accuracy, and computational time. The objective of this study is to develop a robust and interpretable hybrid machine learning framework that combines feature selection and metaheuristic optimization techniques to enable early, accurate, and computationally efficient diagnosis of T2DM.
Method
The methodology employed in this study involved three key steps: feature selection and refinement, model optimization, and evaluation. For feature selection, SHAP (SHapley Additive exPlanations) was integrated with Support Vector Machines (SVMs) to identify the most significant predictive features. This was followed by Particle Swarm Optimization (PSO), which was utilized for feature refinement, ensuring a concise yet highly informative feature set. In the model optimization phase, Genetic Algorithms (GAs) were applied to optimize the hyperparameters of machine learning models, including Artificial Neural Networks (ANNs), Random Forest (RF), and SVM. Bayesian Optimization (BO) was then employed to further refine these hyperparameters, enhancing overall model performance. Finally, the models were evaluated using key classification metrics, such as accuracy, Receiver Operating Characteristic (ROC) curves, and F1 scores, to ensure the robustness and reliability of the proposed approach.
Result
Among all models, the hybrid Random Forest model incorporating SHAP, PSO, GA, and BO demonstrated superior performance with 99.0% accuracy, a 94.8% F1-score, and an AUC of 1.00. The model also maintained high performance on the PIDD dataset, confirming its robustness and generalizability.
Discussion
The hybrid metaheuristic framework significantly improved prediction accuracy and efficiency for early T2DM diagnosis compared to conventional models. These findings support the growing evidence for integrating feature selection and optimization in clinical prediction. However, the study is limited by the use of publicly available datasets and lacks clinical validation, which should be addressed in future work.
Conclusion
The proposed hybrid metaheuristic framework offers a reliable and scalable solution for early diabetes prediction. It advances the application of AI in healthcare by improving diagnostic accuracy and supporting timely medical interventions. Future work should include clinical deployment, real-time validation, and dataset expansion for greater generalizability.
1. INTRODUCTION
Diabetes Mellitus Type II is a long-lasting metabolic disease characterized by high glucose in the blood due to the body not working correctly with insulin or does not produce enough insulin [1]. Due to its rapid rise, which is mostly caused by dietary changes, physical inactivity, and rising obesity rates, this condition has become a major global health challenge. According to a World Health Organization report, millions of people worldwide suffer from this disease [2]. Many health-related issues, such as cardiovascular disease, neuropathy, and kidney disease, are significantly increased by these complications [3]. T2DM has been a global health concern over the past three decades. The diabetes population went up from 108 million in 1980 to 800 million in 2024, and was a cause of death for 1.5 million people in 2019 [4, 5]. Genetic predisposition, lifestyle decisions, levels of physical activity, and dietary practices all impact the condition. Early detection lowers the risk of complications like vision loss and heart or kidney disease by enabling prompt intervention. Early diagnosis is also more cost-effective and significantly improves the quality of life for affected individuals. Timely and precise assessment of this disease is critical for mitigating risks and enabling appropriate interventions. A delayed diabetes diagnosis may require additional tests, such as random plasma glucose, glycated hemoglobin (A1C), and fasting plasma glucose. However, many individuals postpone these tests until they develop symptoms like polyuria, polydipsia, and polyphagia [6]. Conventional diagnostic techniques, such as oral glucose tolerance testing and fasting glucose testing, are frequently expensive, slow, and prone to errors, especially in the earlier stages of the disease. Machine learning (ML) and advanced computational methods have appeared as promising solutions to improve the accuracy and efficiency of diabetes prediction models [7]. ML can process large datasets rapidly, enabling prior prognosis and management of diabetes [8]. Patients can now monitor their blood sugar levels in real-time using devices like continuous glucose monitoring devices, which improve diabetes care and quality of life. Researchers are leveraging machine learning models to analyze datasets and improve the accuracy of diabetes prognosis [9]. ML applications in healthcare range from robotic surgery to prescription drug recommendations. By using feature selection and metaheuristic optimization techniques, this research focuses on improving the prediction of type II diabetes. In ML, feature selection is one of the key steps, especially when working with high-dimensional medical datasets. It helps in data reduction while keeping the most pertinent data, which improves the interpretability and efficacy of models. In this research, SVC assists in the feature selection process, and SHAP values and PSO are utilized to evaluate feature importance. Metaheuristic techniques like GA are used to balance and optimize the parameters of models, such as SVM, RF, and ANN, to enhance model performance further. These methods make it possible to explore a larger search space for hyperparameter tuning, which produces more precise and effective predictions. Furthermore, hyperparameters are refined further using Bayesian optimization to guarantee the best possible model performance. A new method for type II diabetes predictive modeling is introduced by combining feature selection and metaheuristic optimization. The hybrid metaheuristic optimization model, integrating random forest with SHAP, PSO, GA, and Bayesian optimization, demonstrated superior performance and achieved the highest accuracy. According to this study's comparative analysis using metrics, such as ROC and accuracy scores, the model appeared as the most effective strategy, offering unparalleled accuracy, robustness, and computational efficiency. The findings of this study help in creating a scalable and trustworthy medical support system for early T2DM diagnosis.
The structure is such that a literature review is provided in Section 2, dataset and pre-processing are covered in Section 3, feature selection and hybrid model construction are covered in Section 4, results and performance evaluation are provided in Section 5, and the findings are concluded with future research directions in Section 6.
2. LITERATURE REVIEW
Diabetes is a global health concern, and in many parts of the world, more than 70% of the population suffers from diabetes. To predict and manage diabetes symptoms, many researchers have made use of machine learning and data mining methods. Pima Indians Diabetes Dataset is a dataset widely used in diabetes prediction in scientific research. Researchers have explored many methods, such as machine learning, neural networks, hybrid methods, and data mining, to forecast diabetes better. ANN is among the methods widely used in diabetes prediction models [10]. For instance, Swapna et al. [11] made diabetes predictions based on electrocardiogram information with the assistance of deep learning. Feature extraction in their study was dependent on a convolutional neural network (CNN), and an SVM was utilized later to fine-tune features. Their system was extremely accurate, with a rate of 95.7%. In addition, fuzzy cognitive maps were applied in knowledge-based systems to model diabetes-related knowledge, consequently improving the prediction ability in these models. Rastogi et al. [12] explored diabetes prediction using data mining techniques by applying Random Forest, SVM, logistic regression, and Naïve Bayes on a real dataset. It was found that logistic regression achieved the highest accuracy of 82.46% in comparison to other models. Sisodia et al. [13] made use of the Pima Indians Diabetes Dataset in designing three machine learning models, namely decision tree, support vector machine, and naive Bayes, to classify diabetes with naive Bayes having a classification rate of 76.3%. Data mining was used in a research paper presented by Wu et al. [14] to identify risk factors for developing type 2 diabetes with a classification rate of 95.42%. The results of their experiments were found to be sensitive to the initial seed point value, which had a direct effect on the outcomes. Zeinalnezhad et al. integrated data mining and meta-heuristic techniques to predict early readmission of diabetic patients within 30 days of discharge using a dataset from the UC Irvine Machine Learning Repository [15]. They employed classification algorithms, including Random Forest, neural network, and support vector machine, with a Genetic Algorithm (GA) for hyper-parameter tuning. Their results demonstrated that GA-SVM improved prediction accuracy by 1.12%, highlighting the potential of optimized models in managing diabetic patient readmissions. Dharmarathne et al. introduced a self-explanatory interface for diabetes diagnosis using machine learning, incorporating four classification models: Decision Tree, K-Nearest Neighbor, Support Vector Classification, and Extreme Gradient Boosting (XGB) [16]. SHAP was utilized to interpret model predictions, with XGB demonstrating the highest accuracy. The integrated interface not only predicted diabetes but also provided transparent explanations, enhancing user awareness and supporting medical professionals in decision-making. Mumjudar and Vaidehi were interested in the prediction of diabetes using machine learning classifiers. Logistic regression emerged as the best-performing model based on classification metrics without pipelining [17]. When a pipeline was utilized to control and automate workflow, the AdaBoost classifier outperformed other models in diabetes prediction, especially in the Pima Indian Diabetes Dataset. Nicolucci et al. constructed diabetes complications prediction models based on electronic medical record information [18]. Their supervised machine learning model trained on data on 148 patients over a 15-year observation horizon in 23 centers was able to identify high-risk diabetes complications successfully. Ganie and Malik explored the prediction of diabetes independent of insulin based on life and biological predictors [19]. They made a machine learning ensemble with synthetic minority oversampling (SMOTE) to address a dataset with a sample size of 1,939 and 11 life and biological predictors. Their study identified urination as a prominent feature in the prediction of diabetes independent of insulin, with a bagged decision tree classifier performing better than other models. Bhat et al. reported a diabetes prediction and risk analysis using the SMOTE technique on the PIMA Indian Diabetes Dataset [20]. They identified diabetes risk contributors like blood pressure, glucose level, and diabetes pedigree function, with weight being the least contributor. Decision tree was the best performing among the classifiers used, with precision (96%), accuracy (91%), recall (92%), and F1-score (94%). Since more than 60% of diabetic patients are unaware of their conditions, early diagnosis is important to reduce laboratory visits and in-hospital admissions. Singh et al. analyzed the impact of data preparation on machine learning algorithms for type 2 diabetes prediction using two datasets: LS (locally developed) and PIMA (from Kaggle) [21]. They evaluated five machine learning models with eight scaling strategies, observing that PIMA dataset accuracy improved from 46.99–69.88% (without preprocessing) to 77.92% (with scaling). Similarly, Arvind et al. [22] explored the integration of feature selection techniques with machine learning algorithms for diabetes classification by applying SVM, Random Forest, KNN, and Naïve Bayes after genetic algorithm-based feature selection. Their proposed ensemble model achieved a classification accuracy of 93.82%, demonstrating its effectiveness in improving prediction accuracy. In another research, Reza et al. proposed two stacking-based models for diabetes classification using the PIMA Indian Diabetes dataset, simulated data, and locally collected healthcare data [23]. They combined classical and deep neural network stacking ensemble methods, achieving the highest accuracy of 95.50% with a 5-fold CV on the simulation study. Their findings highlight the effectiveness of stacking ensembles in enhancing diabetes prediction accuracy and robustness. Similarly, Upadhyay et al. developed a web-based hybrid machine-learning model for diabetes prediction using a dataset from a reputed Indian hospital [24]. They proposed two hybrid models: one combining Support Vector Machine with bootstrap bagging and Reduced Error Pruning (SVMBBREP) and another integrating SVM with a genetic algorithm, with feature selection performed using the MRMR method. The SVMBBREP model achieved the highest accuracy of 99.67% and was incorporated into a web-based system, enabling real-time diabetes risk assessment and aiding early detection and management. Patile et al. proposed an ML-based framework, Improved Ensemble Learning with Dimensionality Reduction Model (IELDR), for early type 2 diabetes prediction [25]. The IELDR model, integrating an autoencoder-based feature extraction method with ensemble learning, was evaluated using the LS_diabetes dataset and validated on the Diabetes_2019 and PIMA diabetes datasets. The model achieved a high accuracy of 98.67%, outperforming other datasets, and demonstrated its effectiveness in predicting diabetes risk based on lifestyle patterns, aiding in early diagnosis and prevention. Nadesh and Arivuselvan developed a deep neural network and reported a performance level of 94.16% by employing feature reduction and feature selection to remove features with a potential negative contribution to the execution time. Feature importance was determined with decision trees and random forest models [26]. Spearman’s correlation was adopted by Olisah et al. to select the most significant features in the PIMA dataset in a quest to improve the performance level of their diabetes prediction system [27]. However, it was found that Spearman’s correlation was not efficient in treating nonlinear relations and multiple feature combinations. Ejiyi et al. addressed this limitation by using the SHAP algorithm to assess feature importance for diabetes prediction, achieving an accuracy of 94% on the limited dataset with eight attributes [28]. This highlights the critical role of feature selection in improving prediction models. Singh et al. developed a novel predictive model for diabetes, integrating advanced techniques to improve accuracy and robustness [29]. Their approach utilized IDBMI for missing value imputation, MFLOF for outlier detection, ASENN for class balancing, and a Multi-Model FusionNet Classifier for enhanced prediction. Validated on NHANES and PIMA Indian Diabetes datasets, the model achieved high accuracy (97.88% and 97.95%, respectively), demonstrating its effectiveness in addressing key challenges in diabetes detection (Table 1).
Due to its increasing prevalence, significant economic impact, and the enormous amount of data generated by its various forms and related complications, diabetes is predicted to become a major focus of future global health research. This emphasizes the necessity of effective techniques for handling and examining sizable datasets with lots of features. By using feature selection techniques and employing advanced metaheuristic optimization techniques, our study aimed to increase prediction accuracy. A thorough method was designed for big datasets to overcome the drawbacks mentioned in earlier studies and allow for the early diagnosis of T2D. Particle Swarm Optimization and SHAP were utilized for feature selection after pre-processing the data. By keeping only the most pertinent features, computational complexity was decreased, and productivity was increased. Afterward, hybrid models were created by combining machine learning methods with genetic algorithms and Bayesian optimization to optimize hyperparameters before prediction. After a thorough evaluation of these models, the algorithm with the best performance was chosen based on important performance indicators. The objective of this approach was to enhance the accuracy, reliability, and computational efficiency of the type II diabetes prognosis systems (Table 2).
| Authors/Refs. | Classifications Model | Feature Selection Methods | Accuracy (%) |
|---|---|---|---|
| Ananya et al. [30] | SVM, RF | Step forward and backward | 81.4 |
| Astuti et al. [31] | ANN, NB | BWOA | 70 |
| Amit et.al [32]. | LR, KNN, NB, RF, SVM | Fast correlation-based filter feature selection | 97.81 |
| Saxena et al. [33] | DT, KNN, RF | RF | 79 |
| Rubaiat et al. [34] | ANN | RF | 77 |
| Tuan et al. [35] | SVM, DT, KNN, NBC RFC, LR | Wrapper-based feature selection utilizing Grey Wolf Optimization and an Adaptive Particle Swam Optimization | 96 |
| Authors/Refs. | Data-processing | Feature selection methods | Classification models | Optimization method to find the best parameter | Hyperpara mater optimization | Hybrid model |
|---|---|---|---|---|---|---|
| Alam et al. [36] | Median, binning | PCA | RF, clustering, ANN, and association rule | NA | NA | NA |
| Kaur et al. [37] | KNN imputation, outlier removal | Boruta method | SVM (Linear), SVM- RBF, KNN, and ANN | NA | NA | NA |
| Zou et al. [38] | NA | PCA, mRMR | DT, RF, ANN | NA | NA | NA |
| Ahmed et al. [39] | Inter quartile range (IQR) and label encoding | Correlation and chi-square | DT, NB, KNN, RF, GB, LR, and SVM | NA | NA | NA |
| Selim et al. [40] | Min-max normalization | Data reduction unit | Gradient boosting machine | GBM-DRU | NA | Ensemble |
| Zhang et al. [41] | Mean, variance, median, quartile | Pearson correlation coefficient | RF, bagging, and boosting | Harmony search algorithm | NA | Hybrid |
| Ahmed et al. [42] | Pearson correlation, mutual information, SMOTE | Standardization, min max scaler, robust scaler | KNN, DT, RF, NB, LR, SVM, Ada boost, Extra Tree, Gradient boosting, LDA, ANN | NA | NA | Ensemble learning |
| Tanti et al. [43] | Mean, IQR | PCA | DT, GB, SVM, KNN, NB, RF | Cross-validation | NA | NA |
| Hossain et al. [44] | Median, outlier | mRMR, RFE | LR, RF, SVM, KNN, XGB | NA | NA | Hybrid |
| Gollapalli et al. [45] | Min max scaler, KNN imputer, SMOT | Correlation | SVM, RF, DT, KNN | NA | NA | Ensemble |
| Ganie et al. [46] | Outlier, SMOT | Correlation | Bagging, boosting, and voting | NA | NA | Bagging |
| Jamal et al. [47] | Mean, median | PCA | DT, RF, stochastic gradient boosting | Cross-validation | NA | NA |
| Our Research | Label encoding, correlation | SHAP, PSO | SVM, RF, ANN | GA | BO | Hybrid |
3. MATERIALS AND METHODOLOGY
3.1. Data Collection
The dataset (Tables 3-6) used in this study, sourced from a Kaggle repository, was comprised of 520 records with 17 attributes, where 16 features were categorical, and “age” was the only numeric variable. The target variable, “class,” indicated whether an individual has diabetes. The dataset included key attributes, such as age, sex, polyuria, polydipsia, sudden weight loss, weakness, polyphagia, genital thrush, visual blurring, itching, irritability, delayed healing, partial paresis, muscle incoordination, alopecia, obesity, and class, providing a comprehensive representation of diabetes-related symptoms. While the dataset offers valuable insights, its relatively small size may impact its generalizability. To enhance robustness, the Pima Indians Diabetes dataset was incorporated for external validation, allowing for a cross-dataset performance evaluation across diverse population groups. Stratified k-fold cross-validation (k=5) was also applied to improve model reliability and minimize dataset-dependent biases. To further strengthen the analysis, summary statistics and feature correlation analysis were carried out. They provided deeper insights into the dataset’s structure and relationships among features, ensuring a more rigorous assessment of the proposed hybrid metaheuristic optimization model.
3.2. Sample Size Determination
The adequacy of the sample size in this study is justified using stratified k-fold cross-validation (k=5), effect size considerations, and performance consistency analysis. Since the study relies on publicly available benchmark datasets, the Kaggle Diabetes Dataset (520 records, 17 features) and the Pima Indians Diabetes Dataset (768 records, 8 features), a formal power analysis was not conducted. However, the use of stratified k-fold cross-validation ensures that the dataset is effectively utilized, reducing variability in performance metrics and enhancing reliability. Additionally, the dataset size aligns with prior studies in machine learning-based diabetes prediction, where a moderate to high effect size (Cohen’s d) is expected due to the strong relationship between diabetes risk factors and classification outcomes. Furthermore, the performance consistency across validation splits was analyzed to confirm that the results were not overly dependent on specific dataset partitions. The minimal variance in accuracy, precision, recall, and AUC across different folds indicated that the dataset size was sufficient for statistical reliability. Future studies can further strengthen statistical justification by conducting a formal power analysis by applying bootstrapping techniques and validating results on larger, real-world clinical datasets to improve generalizability.
3.3. Clinical Relevance of AI-Based Diabetes Prediction
In clinical practice, a critical question is whether AI-based diagnostic methods provide a significant advantage over traditional tests like fasting blood sugar and HbA1c, which are widely used for diabetes detection. While these conventional tests are effective, they primarily diagnose diabetes at later stages, when symptoms have already developed. In contrast, AI-driven models, such as the proposed hybrid metaheuristic approach, enable the early identification of high-risk individuals before symptoms appear. This proactive approach supports preventive healthcare strategies, allowing for early intervention and potentially reducing long-term diabetes-related complications. Additionally, AI models have the capability to analyze large-scale patient data and detect hidden patterns that might not be evident through conventional testing. By integrating AI with clinical diagnostics, healthcare professionals can enhance risk stratification and ensure that individuals at higher risk receive timely and targeted interventions. Rather than replacing traditional
| Feature Name | Description | Data Type |
|---|---|---|
| Age | Age of the individual | Integer |
| Sex | Gender of the individual | Categorical |
| Polyuria | Frequent urination | Categorical |
| Polydipsia | Excessive thirst | Categorical |
| Sudden Weight Loss | Unexpected weight loss | Categorical |
| Weakness | Persistent weakness or fatigue | Categorical |
| Polyphagia | Excessive hunger | Categorical |
| Genital Thrush | Fungal infection in the genital area | Categorical |
| Visual Blurring | Blurry vision | Categorical |
| Itching | Persistent skin itching | Categorical |
| Irritability | Increased irritability | Categorical |
| Delayed Healing | Slow healing of wounds | Categorical |
| Partial Paresis | Muscle weakness or partial paralysis | Categorical |
| Muscle Steadiness | Lack of muscle control | Categorical |
| Alopecia | Hair loss | Categorical |
| Obesity | BMI indicates obesity | Categorical |
| Class (Target) | Diabetes diagnosis (Positive/Negative) | Categorical |
| - | Age | Gender | Polyuria | Polydipsia | Sudden Weight Loss | Weakness | Polyphagia | Genital Thrush | Visual Blurring | Itching | Irritability | Delayed Healing | Partial Paresis | Muscle Stiffness | Alopecia | Obesity | Class |
|---|---|---|---|---|---|---|---|---|---|---|---|---|---|---|---|---|---|
| Count | 520 | 520 | 520 | 520 | 520 | 520 | 520 | 520 | 520 | 520 | 520 | 520 | 520 | 520 | 520 | 520 | 520 |
| Mean | 48.03 | 0.63 | 0.50 | 0.45 | 0.42 | 0.59 | 0.46 | 0.22 | 0.45 | 0.49 | 0.24 | 0.46 | 0.43 | 0.38 | 0.34 | 0.17 | 0.62 |
| Std | 12.15 | 0.48 | 0.50 | 0.50 | 0.49 | 0.49 | 0.50 | 0.42 | 0.50 | 0.50 | 0.43 | 0.50 | 0.50 | 0.48 | 0.48 | 0.38 | 0.49 |
| Min | 16.00 | 0.00 | 0.00 | 0.00 | 0.00 | 0.00 | 0.00 | 0.00 | 0.00 | 0.00 | 0.00 | 0.00 | 0.00 | 0.00 | 0.00 | 0.00 | 0.00 |
| 0.25 | 39.00 | 0.00 | 0.00 | 0.00 | 0.00 | 0.00 | 0.00 | 0.00 | 0.00 | 0.00 | 0.00 | 0.00 | 0.00 | 0.00 | 0.00 | 0.00 | 0.00 |
| 0.50 | 47.50 | 1.00 | 0.00 | 0.00 | 0.00 | 1.00 | 0.00 | 0.00 | 0.00 | 0.00 | 0.00 | 0.00 | 0.00 | 0.00 | 0.00 | 0.00 | 1.00 |
| 0.75 | 57.00 | 1.00 | 1.00 | 1.00 | 1.00 | 1.00 | 1.00 | 0.00 | 1.00 | 1.00 | 0.00 | 1.00 | 1.00 | 1.00 | 1.00 | 0.00 | 1.00 |
| Max | 90.00 | 1.00 | 1.00 | 1.00 | 1.00 | 1.00 | 1.00 | 1.00 | 1.00 | 1.00 | 1.00 | 1.00 | 1.00 | 1.00 | 1.00 | 1.00 | 1.00 |
| Feature Name | Description | Data Type |
|---|---|---|
| Pregnancies | Number of times pregnant | Integer |
| Glucose | Plasma glucose concentration (mg/dL) | Numeric |
| Blood Pressure | Diastolic blood pressure (mm Hg) | Numeric |
| Skin Thickness | Triceps skinfold thickness (mm) | Numeric |
| Insulin | 2-Hour serum insulin (mu U/ml) | Numeric |
| BMI | Body Mass Index (kg/m2) | Numeric |
| Diabetes Pedigree | Diabetes pedigree function (Genetic Risk Factor) | Numeric |
| Age | Age of the individual (years) | Integer |
| Outcome (Target) | Diabetes diagnosis (0 = No, 1 = Yes) | Categorical |
| Feature | Count | Mean | Std Dev | Min | 0.25 | 0.50 | 0.75 | Max |
|---|---|---|---|---|---|---|---|---|
| Pregnancies | 768 | 3.85 | 3.37 | 0 | 1.00 | 3.00 | 6.00 | 17.00 |
| Glucose | 768 | 120.89 | 31.97 | 0 | 99.00 | 117.00 | 140.25 | 199.00 |
| Blood Pressure | 768 | 69.11 | 19.36 | 0 | 62.00 | 72.00 | 80.00 | 122.00 |
| Skin Thickness | 768 | 20.54 | 15.95 | 0 | 0.00 | 23.00 | 32.00 | 99.00 |
| Insulin | 768 | 79.80 | 115.24 | 0 | 0.00 | 30.50 | 127.25 | 846.00 |
| BMI | 768 | 31.99 | 7.88 | 0 | 27.30 | 32.00 | 36.60 | 67.10 |
| Diabetes Pedigree Function | 768 | 0.47 | 0.33 | 0.078 | 0.24 | 0.37 | 0.63 | 2.42 |
| Age | 768 | 33.24 | 11.76 | 21 | 24.00 | 29.00 | 41.00 | 81.00 |
| Outcome (Target) | 768 | 0.35 | 0.48 | 0 | 0.00 | 0.00 | 1.00 | 1.00 |
diagnostic tests, AI serves as a complementary tool that improves decision-making in diabetes screening, particularly in large-scale population studies and personalized medicine applications.
3.4. Data Pre-Processing
The data pre-processing phase ensures that the dataset is clean, balanced, and optimized for machine learning models. Since no missing values were found, imputation was not required. Categorical variables were converted into numerical representations using label encoding to facilitate model training. To address class imbalance, the Synthetic Minority Over-sampling Technique (SMOTE) was applied, generating synthetic samples for the minority class to enhance model performance and prevent biased predictions. Feature scaling was performed using min-max scaling to normalize the data within the range of [0,1], ensuring consistency across features. Additionally, correlation analysis using the Pearson correlation coefficient was conducted to identify and remove highly correlated features, thereby reducing redundancy and improving model efficiency. The correlation with diabetes (Fig. 1) indicates that polyuria and polydipsia are the most significant markers of diabetes. Conversely, features, such as gender and alopecia, appear to be weaker indicators and may negatively impact classification accuracy. For the PIMA Indian Diabetes dataset, similar pre-processing steps were applied to maintain consistency. Since the dataset primarily consisted of numerical values, min-max scaling was utilized to standardize feature distributions. Class imbalance was addressed using SMOTE to ensure an equal representation of positive and negative diabetes cases. Correlation analysis was also performed to eliminate redundant features, ensuring that only the most relevant attributes were retained for classification. These pre-processing steps enhanced data quality, leading to better generalization and improved performance of the machine learning models.
3.4.1. Synthetic Minority Over-sampling Technique (SMOTE)
Class imbalance is a common issue in medical datasets, where the number of positive (diabetic) and negative (non-diabetic) cases is significantly different. This imbalance can lead to biased model predictions, where the classifier favors the majority class. To address this issue, the Synthetic Minority Over-sampling Technique (SMOTE) was implemented in this study. Instead of merely duplicating instances of the minority class, SMOTE generates synthetic samples by interpolating feature values between existing minority class instances. This approach helps the model learn meaningful patterns from both classes, improving classification performance while preventing overfitting. By integrating SMOTE, the model can better distinguish between diabetic and non-diabetic cases, reducing bias and enhancing predictive performance (Fig. 2).
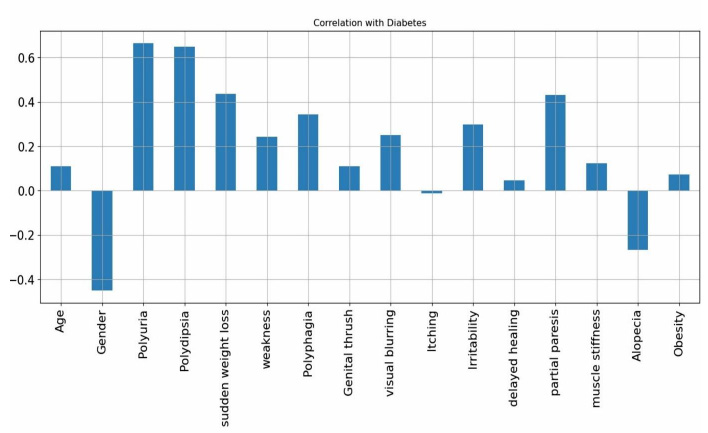
Correlation with diabetes.
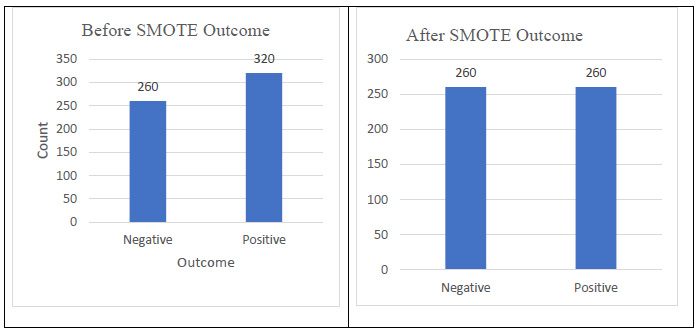
SMOTE Outcome: Before and after.
3.5. Feature Selection
A crucial phase in data analysis is feature selection. Choosing the most relevant features from the initial set by predetermined evaluation criteria entails lowering the dimensionality of a dataset. By removing unnecessary features, this procedure streamlines the dataset while preserving crucial information. The set of attributes N includes n attributes, {n1,n2,n3,…,nk} [48, 49]. It is the goal of feature selection to select k-relevant attributes from the set. Subset generation is the first of the three required procedures in the feature selection process. It is the process of constructing unique subsets of attributes from the given set. The evaluation phase follows, during which each subset's quality is evaluated based on predetermined evaluation criteria to ascertain its significance and relevance. When an ideal subset is found, the search is stopped using stopping rules, and the chosen features are then validated to make sure they are appropriate for the predictive model. This ends the process. By ensuring that only the most relevant features are used, this hierarchical method enhances the accuracy and productivity of the ensuing predictive model.
3.5.1. Features Selection by SHAP with SVM
Support Vector Machines, in conjunction with SHAP, allow for efficient feature selection by locating the most important dataset features. To maximize class separation, a hyperplane is optimized before an SVM model is trained on all features. Kernel SHAP, which measures each feature's contribution to predictions, is then used to calculate SHAP values [50]. A global ranking of feature importance is obtained by aggregating these values. The SVM model is retrained using the top k features, which lowers dimensionality and improves computational efficiency without compromising accuracy [51]. This integration highlights important aspects of decision-making and produces an accurate, interpretable model.
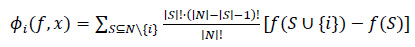
Mathematical notation is presented in Eq. (1), which is as follows:
 |
(1) |
Where: ϕi(f, x) is the SHAP value of the feature i for the prediction f (x), N is the set of all features, S is a subset of the features that exclude the feature i, | S |! is the factorial of the size of the subset S, ∣N∣! is the factorial of the total number of features, f(S∪ {i}) is the model's prediction using the features in S plus feature i, and f(S) is the model's prediction using only the features in S.
Feature selection with SHAP involves calculating the mean absolute SHAP values across all training examples, providing a global ranking of feature importance influencing the model's predictions (Eq. 2).
 |
(2) |
Where n is the total number of training instances, ϕi(f, xj) is the SHAP value of feature i, for instance xj, and f(xj) is the model's prediction, for instance xj.
According to the SHAP value displayed in Fig. (3), the top 10 features selected include polyuria, polydipsia, gender, partial paresis, itching, age, genital thrush, irritability, sudden weight loss, visual blurring, and weakness.
3.5.2. Particle Swarm Optimization Feature Selection Method
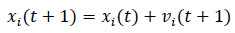
Particle Swarm Optimization, which finds the most relevant features in a dataset, was inspired by the collective behaviour of flocking birds. PSO effectively finds the best feature subsets to enhance the productivity of models, and it works especially well in high-dimensional spaces [52]. Each particle in the process represents a possible feature subset encoded as a binary vector (1 for selected features, 0 otherwise), and the population is initialized at random at the start of the process. Fitness scores obtained from model metrics, such as AUC, are used to assess particles. Particles explore the feature space and migrate toward the optimal subset for the optimal model's efficiency by iteratively updating their position as well as their velocity using their optimal position individually as well as the optimal position of the swarm (Eq. 3) [53].
 |
(3) |
Where, vi(t + 1) is the velocity of particle i at time t + 1, w is the inertia weight to control the exploration and exploitation balance, c1, c2 is the cognitive and social learning coefficients, controlling the influence of personal and global best positions, r1, r2 is the random value between 0 and 1, pbest,i is the personal best position of particle i, gbest is the best global position among all particles, and xi(t) is the current position of particle i.
The position (selected features) of each particle is updated based on the updated velocity (Eq. 4).
 |
(4) |
A sigmoid function is typically applied to convert continuous velocities to binary decisions for feature selection (Eq. 5).
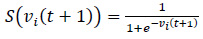 |
(5) |
The new position is determined by comparing S(vi(t + 1)) to a random number, with values closer to 1 leading to the feature being selected.
The process repeats for a fixed number of iterations or until convergence is achieved (i.e. when the particles no longer improve their positions significantly).
The top 10 features selected include gender, polyuria, polydipsia, weakness, polyphagia, itching, irritability, delayed healing, partial paresis, and muscle stiffness.
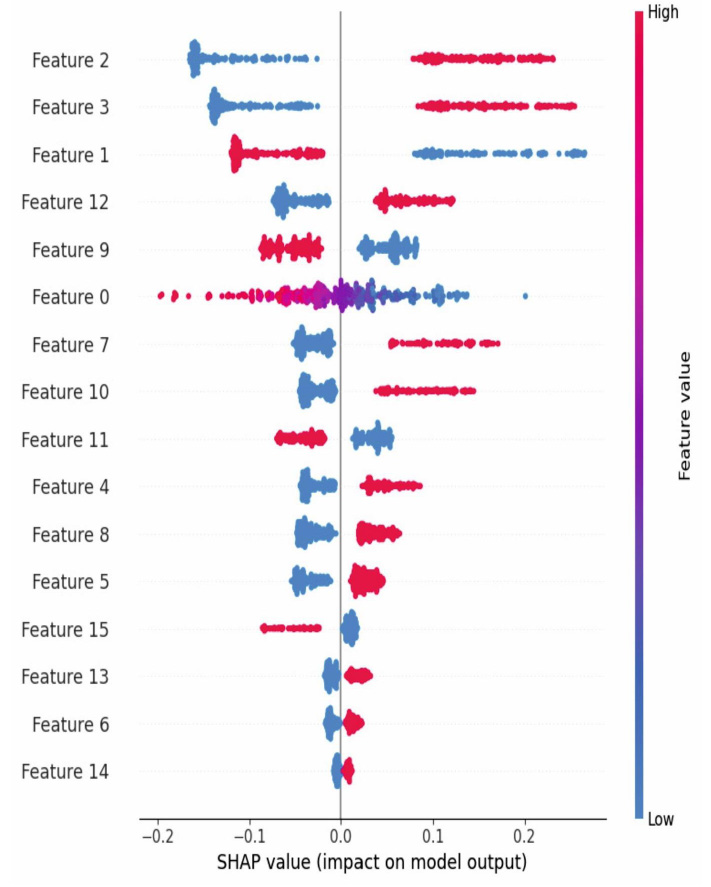
SHAP value for feature selection.
3.6. Framework of the Proposed Methodology
The proposed framework consists of six key stages: data collection, data pre-processing, feature selection, model optimization, classification modeling, and model evaluation, as illustrated in Fig. (4).
3.6.1. Step 1
Data Collection: Publicly available datasets, including the Kaggle Diabetes dataset and Pima Indians Diabetes Dataset, are used.
3.6.2. Step 2
Data Pre-processing: This includes handling missing values, encoding categorical variables, feature scaling, and class balancing using SMOTE. Correlation analysis is performed to remove redundant features.
3.6.3. Step 3
Step 3- Feature Selection: SHAP (SHapley Additive exPlanations) ranks feature importance, while Particle Swarm Optimization (PSO) selects the most relevant subset for model training.
3.6.4. Step 4
Step 4- Model Optimization: Genetic Algorithm (GA) and Bayesian Optimization refine model hyperparameters, while stratified k-fold cross-validation (k=5) ensures model reliability and reduces overfitting.
4. MACHINE LEARNING MODELS
4.1. Artificial Neural Network (ANN)
ANN is a type of model that imitates brain activity to process data and produce predictions. It is modeled after biological neural networks. The three fundamental elements include an output layer making the ultimate classifications or predictions, an input layer taking in the input data, and the hidden layers carrying out the intermediate transformations [54]. The layers are all connected with weights that adjust with the training process to maximize accuracy. During the learning of intricate patterns, every neuron calculates a weighted sum of the input along with utilizing an activation function. This creates non-linearity. ANNs reduce prediction errors through iterative training and optimization methods, gradually improving performance.
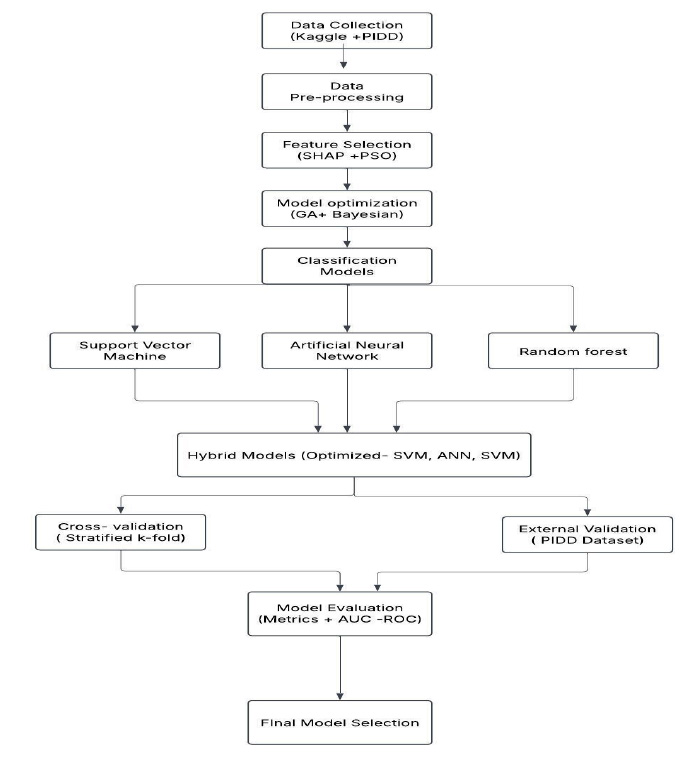
Proposed framework for model.
For calculating a neuron i in the hidden layer, Eq. (6) is used, which is as follows:
 |
(6) |
Where, xj is the input to the neuron, wij is the weight associated with the inputs, bi is the biased term, and zi is the weighted sum.
After computing the weighted sum, an activation function is applied to introduce non-linearity to the model. Common activation functions include Sigmoid, which is shown in Eq. (7).
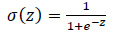 |
(7) |
Output: The final output is computed by applying the same process to the output layer. Training an ANN involves adjusting the weights and biases using backpropagation and an optimization method like gradient descent. The goal is to minimize the loss function. The weights are updated using the following Eq. (8):
 |
(8) |
4.2. Bayesian Optimization
This method is used for optimizing problems where the objective function is difficult to evaluate and has an unknown form. It is especially helpful for adjusting hyperparameters in machine learning. The surrogate model, acquisition function, and objective function are the three main elements of the process. A performance metric (such as accuracy or loss) that depends on hyperparameters x is represented by the objective function, f(x). This model uses a surrogate model to approximate the function based on previous evaluations because evaluating f(x) is computationally costly. To choose the next point, the acquisition function, such as the upper confidence bound or expected improvement, balances exploration and exploitation. The algorithm iteratively assesses f(x), updates the surrogate model, and refines the solution with each iteration [55].
Let f(x) be the objective function where x is the set of hyperparameters. Bayesian optimization aims to find the value of x that minimizes f(x) Eq. (9):
 |
(9) |
Since f(x) is expensive to compute, we model f(x) using a Gaussian Process g(x), and then choose the next point to evaluate by maximizing the acquisition function a(x) Eq. (10):
 |
(10) |
The acquisition function guides the search process, deciding where to explore next based on the current model's uncertainty and predictions.
4.3. Random Forest
A widely used ensemble learning algorithm for classification and regression tasks, Random Forest is widely used for its robustness and ability to handle high-dimensional data. Multiple decision trees are constructed during training, and the ultimate prediction is made using majority voting (for classification) or averaging (for regression) [56]. This ensemble approach helps reduce overfitting and improves accuracy. Two fundamental types of randomness are used to build each Random Forest decision tree: Random feature selection, which considers only an arbitrary portion of features at each split, and Bagging, which trains each tree on an arbitrary portion of the data. This reduces variance and strengthens the model by decorating the trees. Random feature selection further increases tree diversity, while bootstrapping guarantees that every tree is exposed to various subsets of data. With the majority voting for classification or averaging for regression, Random Forest merges the predictions of all trees in the final step, leading to a more robust and accurate model that performs very well on complex datasets [57].
Let hi(x) be the prediction of the i-th decision tree for input x, and let N be the number of trees. The final prediction for Random Forest is the majority vote, as shown in Eq. (11):
 |
(11) |
4.4. Genetic Algorithm
This is a natural selection-inspired enhancing method used to identify the best answers in challenging search spaces. It begins with a population of chromosomes, each representing a potential solution. Genes, which are decision variables and are frequently encoded as binary, integer, or real values, make up chromosomes [58]. Each person's performance is assessed by a fitness function, which favours those with higher fitness scores to guide selection. To produce children, a selected group of people (parents) go through crossover, exchanging chromosome segments. Small, random changes are introduced by mutation to preserve diversity. To effectively identify the best answers, this process iterates over generations, striking a balance between exploration and exploitation [59].
The mathematical representation of this process is as follows:
Chromosome: x = (x1,x2,...,xn), where each xi represents a gene (decision variable), Fitness Function: f(x), where f evaluates the quality of the solution x, Crossover: Two parent chromosomes x1 and x2 are combined to form offspring xnew, often using a point or uniform crossover, and Mutation: With a small probability, some genes in xnew are altered randomly.
4.5. Hybrid Metaheuristic Optimization Methods and Experimentation Process
This study explores three hybrid metaheuristic optimization techniques that enhance classification performance for diabetes prediction by integrating SHAP, Particle Swarm Optimization (PSO), Genetic Algorithm (GA), and Bayesian Optimization with Support Vector Machine (SVM), Artificial Neural Network (ANN), and Random Forest (RF). Each method follows a structured experimental process involving feature selection, feature refinement, and hyperparameter tuning.
4.5.1. Hybrid Metaheuristic Optimization Integrating SVM with SHAP, PSO, GA, and Bayesian Optimization
In the first approach, the hybrid metaheuristic optimization integrates SVM with SHAP, PSO, GA, and Bayesian Optimization to optimize diabetes classification. The process begins with SHAP, which analyzes feature importance using a linear SVM model, allowing the selection of the most relevant features. These selected features are then refined using PSO, where each particle represents a subset of features and is evaluated based on the AUC score of an SVM model trained on that subset. PSO iteratively converges to the best feature subset, improving classification performance. Next, GA is used to optimize hyperparameters, such as C and gamma, by evolving parameter sets across generations. Bayesian Optimization is then applied to fine-tune these hyperparameters, balancing exploration and exploitation to maximize the AUC score. The final optimized SVM model, trained with an RBF kernel, is evaluated using a Receiver Operating Characteristic (ROC) curve and classification metrics, including accuracy, precision, recall, and F1-score
4.5.1.1. Experimental Process
4.5.1.1.1. Feature Selection Using SHAP
A linear SVM model is trained, and SHAP (SHapley Additive exPlanations) values are computed to determine feature importance.
Only the most significant features are selected to reduce dimensionality and improve efficiency.
4.5.1.1.2. Feature Refinement Using PSO
Each particle represents a subset of features, and the fitness of each subset is evaluated using the AUC score of an SVM trained on it.
PSO iteratively converges toward the optimal feature subset for better classification.
4.5.1.1.3. Hyperparameter Optimization Using GA
The genetic algorithm is applied to optimize SVM hyperparameters (C and gamma).
The best hyperparameter sets are selected through iterative evolution, enhancing classification accuracy.
4.5.1.1.4. Fine-tuning with Bayesian Optimization
Bayesian Optimization further refines the hyperparameters, balancing exploration and exploitation to maximize AUC.
4.5.1.1.5. Model Evaluation
The final optimized SVM model (with an RBF kernel) is trained on the selected features and fine-tuned hyperparameters.
Performance is assessed using a Receiver Operating Characteristic (ROC) curve and classification metrics, including precision, recall, F1-score, and accuracy.
4.5.2. Hybrid Metaheuristic Optimization Integrating ANN with SHAP, PSO, GA, and Bayesian Optimization
The second approach enhances ANN performance using a similar hybrid metaheuristic optimization framework. Initially, SHAP is employed to rank feature importance in a linear SVM model, selecting the top 10 most relevant features. These features are further refined using PSO, where particles represent feature subsets, and their fitness is determined based on the AUC score of an ANN trained on them. Through iterative optimization, PSO identifies the best-performing feature subset. GA is then utilized to optimize key ANN hyperparameters such as the number of neurons, batch size, and learning rate by evolving parameter combinations over multiple generations. Bayesian Optimization further fine-tunes these hyperparameters to ensure optimal performance. The ANN model, trained with the optimized features and hyperparameters, is assessed using an AUC score, ROC curve, and classification report summarizing accuracy, precision, recall, and F1-score.
4.5.2.1. Experimental Process
4.5.2.1.1. Feature Selection using SHAP
A linear SVM model is trained, and SHAP values are computed to rank feature importance.
The top 10 most significant features are selected for better model efficiency.
4.5.2.1.2. Feature Refinement using PSO
Each particle represents a subset of features, and its fitness is determined by the AUC score of an ANN trained on that subset.
PSO iteratively searches for the optimal feature subset to enhance predictive performance.
4.5.2.1.3. Hyperparameter Optimization using GA
The Genetic Algorithm is employed to optimize key ANN parameters such as the number of neurons, batch size, and learning rate.
The most effective hyperparameter combinations are selected through evolutionary processes.
4.5.3. Hybrid Metaheuristic Optimization Integrating Random Forest with SHAP, PSO, GA, and Bayesian Optimization
The third approach integrates Random Forest with SHAP, PSO, GA, and Bayesian Optimization to enhance diabetes prediction. SHAP is first applied to a linear SVM model to determine feature importance, selecting the top 10 influential features. These features undergo further refinement through PSO, where each particle represents a subset, and its fitness is evaluated using the AUC score of a Random Forest model trained on that subset. PSO iteratively optimizes the feature selection process, leading to improved classification accuracy. GA is then applied to fine-tune Random Forest hyperparameters, such as the number of trees and maximum depth, by evolving optimal parameter sets. Finally, Bayesian Optimization further adjusts these hyperparameters, balancing exploration and exploitation for improved AUC scores. The final optimized Random Forest model is evaluated using the ROC curve, AUC score, and a classification report highlighting accuracy, precision, recall, and F1-score.
4.5.3.1. Experimental Process
4.5.3.1.1. Feature Selection Using SHAP
A linear SVM model is trained, and SHAP values are calculated to determine feature importance.
The top 10 most influential features are selected to reduce dimensionality while preserving model accuracy.
4.5.3.1.2. Feature Refinement Using PSO
Each particle represents a subset of features, and its fitness is evaluated based on the AUC score of a Random Forest model trained on that subset.
PSO iteratively optimizes the feature subset to improve classification performance.
4.5.3.1.3. Hyperparameter Optimization Using GA
Genetic Algorithm optimizes Random Forest hyperparameters, such as the number of trees and maximum depth.
Through multiple generations, GA selects the best-performing hyperparameter combinations.
5. RESULTS AND DISCUSSION
This section presents and discusses the outcomes obtained from the experimental setup using various models for diabetes prediction.
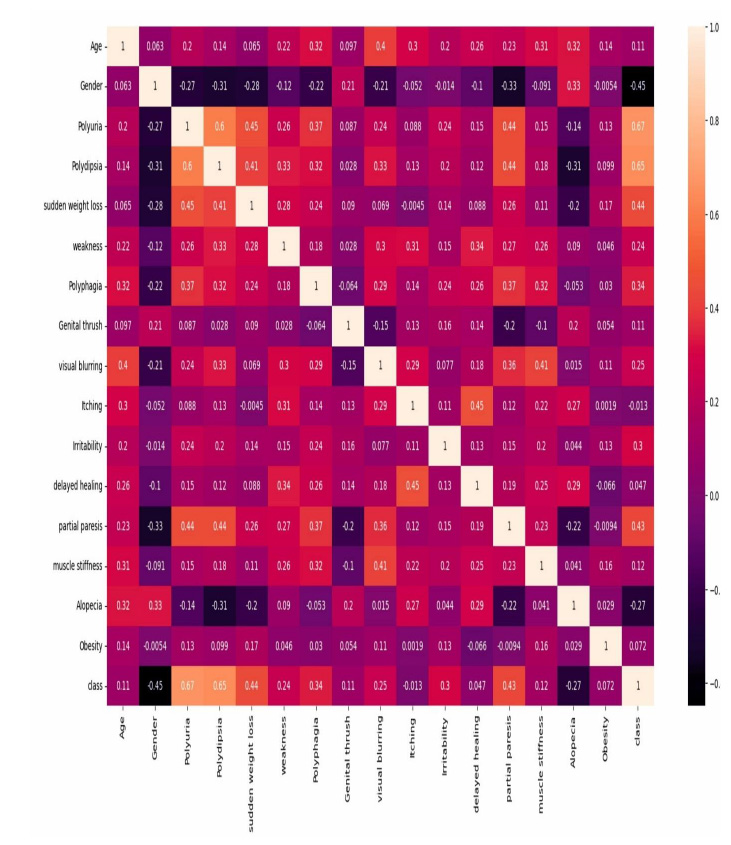
5.1. Correlation Coefficient Analysis
The correlation matrix provides valuable insights into the relationships between features in the diabetes dataset using Pearson’s correlation coefficient (Fig. 5). A value close to +1 signifies a strong positive correlation, -1 represents a strong negative correlation, and 0 indicates no correlation. The heatmap, which illustrates feature correlations within the dataset after pre-processing, visually represents these relationships. Darker shades in the heatmap indicate stronger correlations between features. Key observations reveal strong positive correlations between features, such as polyuria and polydipsia, as well as sudden weight loss and weakness, suggesting their tendency to occur together. Conversely, features like age and alopecia or obesity and partial paresis exhibit weak or negative correlations, while others, such as visual blurring and genital thrush, show little to no association. The rightmost column of the correlation matrix highlights the relationship of each feature with the diabetes outcome, where polyuria, polydipsia, and partial paresis demonstrate strong positive correlations, making them crucial predictors. The correlation matrix is instrumental in feature selection, as it helps identify redundant variables, minimize multicollinearity, and enhance model efficiency. By eliminating highly correlated features, the risk of overfitting is reduced, ultimately leading to more accurate diabetes predictions.
5.2. Performance Evaluation of Machine Learning Models
A comprehensive comparison between standard machine learning models (SVM, ANN, and RF) and their hybrid optimized counterparts (Hybrid-SVM, Hybrid-ANN, and Hybrid-RF) was carried out to assess improvements in predictive performance. Key evaluation metrics, including accuracy, precision, recall, F1-score, and AUC-ROC, were analyzed both before and after optimization to highlight the impact of the applied hybrid techniques. To ensure the reliability and generalizability of the models, stratified k-fold cross-validation was implemented, allowing performance assessment across multiple subsets of the dataset and reducing bias. Additionally, external validation using the Pima Indians Diabetes dataset was performed to verify model robustness beyond the Kaggle dataset, ensuring that the optimized models maintain high performance across diverse data sources. The results demonstrated that hybrid-optimized models consistently outperformed their standard counterparts, highlighting the effectiveness of optimization techniques in improving diabetes prediction accuracy (Table 7).
The optimized models exhibited a notable performance boost compared to their non-optimized versions. Hybrid-SVM and Hybrid-ANN demonstrated significant improvements, while hybrid-RF was the most effective model, achieving 99.0% accuracy and an AUC-ROC of 1.00 (Figs. 6-7), indicating exceptional predictive capability for diabetes diagnosis. Furthermore, the application of cross-validation ensured that the models maintained generalizability and robustness, effectively minimizing the risk of overfitting across different dataset partitions.
External Validation on PIDD Dataset
To evaluate the robustness and generalizability of the models, they were tested on the Pima Indians Diabetes dataset. The results confirmed that the hybrid models maintained high predictive performance even on an independent dataset, further validating the effectiveness of the hybrid optimization approach (Table 8).
Correlation matrix of diabetes.
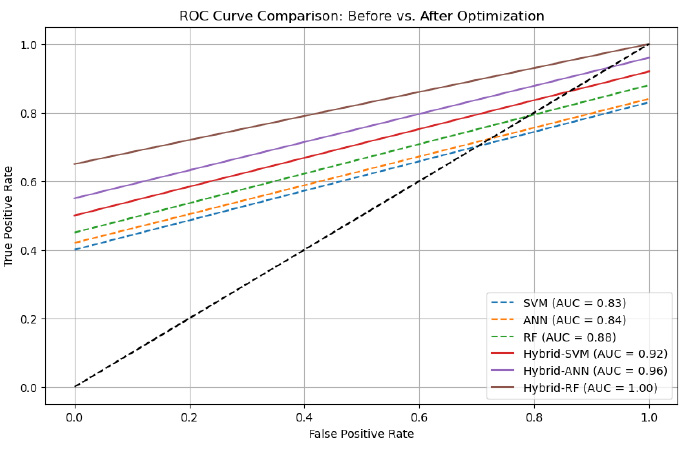
ROC curve before and after optimization on the diabetes dataset.
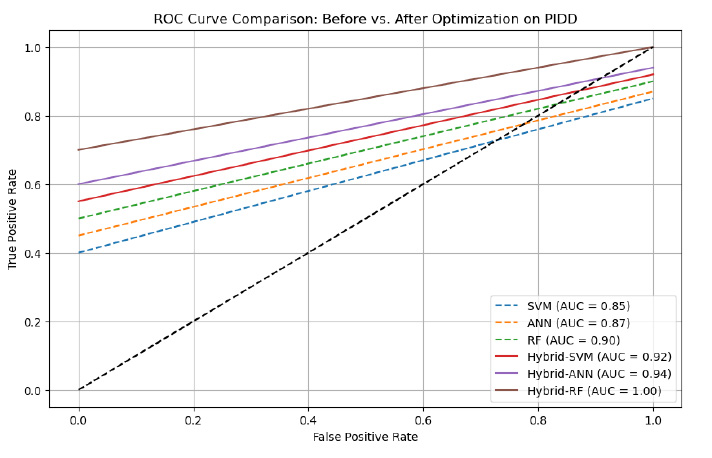
ROC curve before and after optimization on the PIMA dataset.
| Model | Accuracy (%) | Precision (%) | Recall (%) | F1-score (%) | AUC |
|---|---|---|---|---|---|
| SVM (without optimization) | 80.0 | 79.0 | 80.5 | 82.7 | 0.83 |
| ANN (without optimization) | 82.2 | 80.8 | 81.0 | 84.4 | 0.84 |
| RF (without optimization) | 85.0 | 82.2 | 85.8 | 86.2 | 0.88 |
| Hybrid-SVM (optimized after cross-validation) | 94.0 | 95.2 | 94.4 | 94.8 | 0.92 |
| Hybrid-ANN (optimized after cross-validation) | 93.0 | 92.8 | 93.6 | 93.2 | 0.96 |
| Hybrid-RF (optimized after cross-validation) | 99.0 | 93.9 | 92.5 | 93.2 | 1.00 |
| Model | Accuracy (%) | Precision (%) | Recall (%) | F1-score (%) | AUC |
|---|---|---|---|---|---|
| SVM (without optimization) | 82.5 | 81.2 | 80.9 | 81.0 | 0.85 |
| ANN (without optimization) | 84.3 | 83.0 | 83.2 | 83.1 | 0.87 |
| RF (without optimization) | 87.1 | 85.8 | 86.2 | 86.0 | 0.90 |
| Hybrid-SVM (optimized after cross-validation) | 89.0 | 90.0 | 89.3 | 89.6 | 0.92 |
| Hybrid-ANN (optimized after cross-validation) | 89.8 | 89.5 | 90.1 | 89.8 | 0.94 |
| Hybrid-RF (optimized after cross-validation) | 99.0 | 98.7 | 99.5 | 99.1 | 1.00 |
The results of standard machine learning models (SVM, ANN, and RF) and their hybrid optimized counterparts (Hybrid-SVM, Hybrid-ANN, and Hybrid-RF) were evaluated to assess improvements in predictive performance by considering the following aspects [60].
• Accuracy: Measures the proportion of correct predictions.
Accuracy= (True Positive + True Negative) / (True Positive + True Negative + False Positive + False Negative)
• Precision: Evaluates the ability to avoid labeling negative cases as positive.
Precision= True Positive / (True Positive + False Positive)
• Recall: Measures the ability to correctly identify positive cases.
Recall= True Positive / (True Positive + False Negative)
• F1 Score: Provides a harmonic mean of precision and recall.
F1-Score= 2 * (Precision * Recall) / (Precision + Recall)
CONCLUSION
Diabetes is a chronic disease affecting millions worldwide. This study evaluated the effectiveness of hybrid metaheuristic optimization techniques in enhancing diabetes prediction using machine learning models. A comprehensive comparison between conventional models (SVM, ANN, and RF) and their optimized counterparts (Hybrid-SVM, Hybrid-ANN, and Hybrid-RF) demonstrated notable improvements in classification performance. The integration of feature selection using SHAP and PSO, class balancing through SMOTE, and performance validation via stratified k-fold cross-validation contributed to enhanced accuracy, precision, and generalizability. Among the optimized models, Hybrid-RF achieved the highest accuracy of 99.0% with an AUC-ROC score of 1.00, underscoring the effectiveness of the proposed approach. Despite these advancements, several limitations must be considered.
STUDY LIMITATIONS
The study relies on publicly available datasets (Kaggle Diabetes dataset and Pima Indians Diabetes dataset), which may not fully capture diverse populations due to the absence of detailed patient demographics and clinical variables. This limitation may affect the generalizability of the model. Additionally, feature selection using SHAP and PSO, while improving model efficiency, may inadvertently exclude subtle yet clinically relevant features. Another challenge is the potential dataset bias, which has not been explicitly assessed and could influence the model’s predictive reliability. Moreover, the proposed model has not undergone real-world clinical validation, raising concerns about its practical applicability, physician interpretability, and seamless integration into healthcare systems. The computational complexity associated with hybrid metaheuristic optimization also increases processing requirements, making real-time deployment in resource-constrained environments challenging. Although 5-fold cross-validation enhances performance estimation, further external validation using larger, real-world hospital datasets is crucial to confirm the robustness and clinical utility of the model.
Future research should address these limitations by incorporating more diverse and extensive datasets, conducting real-world testing, and optimizing computational efficiency. Additionally, exploring federated learning can improve model generalizability while maintaining data privacy. The proposed framework can also be extended to predict the likelihood of diseases at early stages. In the future, mobile and web applications based on this model could assist healthcare providers in early diabetes detection and prediction, ultimately improving patient outcomes and supporting timely medical interventions.
AUTHORS’ CONTRIBUTIONS
The authors confirm contribution to the paper as follows: S.U: Writing Paper; Y.K.G: Conceptualization;. All authors reviewed the results and approved the final version of the manuscript.
LIST OF ABBREVIATIONS
| T2DM | Type-II Diabetes Mellitus |
| SVMs | Support Vector Machines |
| PSO | Particle Swarm Optimization |
| GAs | Genetic Algorithms |
| RF | Random Forest |
| ANNs | Artificial Neural Networks |
| BO | Bayesian Optimization |
| ROC | Receiver Operating Characteristic |
| SMOTE | Synthetic Minority Over-sampling Technique |
AVAILABILITY OF DATA AND MATERIALS
The data supporting the findings of the article is available in the Kaggle Repository at https://www.kaggle. com/datasets/andrewmvd/early-diabetes-prediction-dataset, reference number: KAG-EDP-520. Additionally, the Pima Indians Diabetes dataset used for validation is available at https://www.kaggle.com/datasets/uciml/ pima-indians-diabetes-database, reference number: KAG-PIMA- 768
ACKNOWLEDGEMENTS
Declared none.

