
Identification of Diagnostic and Prognostic Biomarkers in Nasopharyngeal Carcinoma using Integrated Transcriptomics and Elastic Net Survival Analysis
Abstract
Introduction
Nasopharyngeal carcinoma (NPC) is a malignant tumor with distinct molecular features, underscoring the need for reliable biomarkers to improve diagnosis, prognosis, and therapeutic strategies.
Methods
We analyzed transcriptomic data from Gene Expression Omnibus (GEO) datasets (GSE12452, GSE53819, and GSE102349) to identify diagnostic and prognostic biomarkers. Differential expression analysis was performed to detect potential markers, while survival analysis was conducted using Cox proportional hazards (Cox-PH) modeling and log-rank tests. Elastic Net regression was used to refine the gene signature. RNA-protein expression concordance was validated using the Cancer Cell Line Encyclopedia (CCLE) dataset.
Results
Differential expression analysis revealed 591 genes as potential diagnostic markers. Survival analysis identified 54 genes with dual diagnostic and prognostic relevance. Elastic Net regression refined this to an 11-gene signature, which stratified patients into high- and low-risk groups, significantly predicting progression-free survival (log-rank p = 0.0035). Five genes (BUB1B, GAS2L3, NFE2L3, OIP5, and PDGFRL) were identified as potential oncogenic drivers, while six (CD1D, CYP4B1, IL33, KLF2, NAPSB, and VILL) were implicated as tumor suppressors. Six genes (BUB1B, GAS2L3, IL33, OIP5, PDGFRL, and VILL) showed strong RNA-protein expression concordance in the CCLE dataset.
Discussion
This study reveals previously unreported cancer-associated genes (NAPSB, GAS2L3, NFE2L3, PDGFRL, CD1D, CYP4B1, KLF2) in NPC while validating established biomarkers (BUB1B, OIP5, IL33, VILL). Our findings expand NPC molecular characterization but require further clinical validation.
Conclusion
This study presents a robust gene signature for NPC, offering valuable insights into tumor progression and providing a foundation for advancing diagnostic strategies, improving prognostic stratification, and developing targeted therapies.
1. INTRODUCTION
NPC is a relatively rare malignancy; however, its incidence is disproportionately high in specific geographic regions, including Southeast Asia and North Africa. In Indonesia, NPC was the fourth most prevalent cancer among males in 2022, with a total of 14,497 newly diagnosed cases reported across all age groups [1]. Due to its nonspecific symptoms, NPC is often diagnosed at advanced stages, highlighting the critical need for molecular diagnostic tools to facilitate early detection, guide treatment decisions, monitor disease progression, and predict prognosis [2].
Biomarkers for NPC can be broadly categorized into two groups: Epstein-Barr virus (EBV)-related biomarkers and cellular biomarkers. EBV-related biomarkers, such as EBV DNA, EBNA1, LMP1/2, EBER 1/2, and miRNA BART, have been extensively studied and are widely used for NPC diagnosis and monitoring [2]. However, these biomarkers have limitations, as not all NPC patients exhibit detectable EBV reactivation [3, 4]. This highlights the need for complementary cellular biomarkers that reflect the intrinsic molecular characteristics of NPC.
Transcriptomic analysis has emerged as a powerful tool for biomarker discovery, enabling the identification of comprehensive gene expression patterns associated with tumorigenesis, progression, and therapeutic responses [5]. By leveraging high-throughput sequencing technologies, transcriptomics provides a global view of gene expression, uncovering molecular signatures that serve as diagnostic, prognostic, and predictive biomarkers. This approach allows for the identification of unique gene expression patterns specific to tumors, offering deeper insights into disease pathogenesis and potential therapeutic targets [6]. Recent studies have leveraged transcriptomic data to identify novel biomarkers for NPC. For instance, bioinformatics analysis of transcriptomic datasets has identified RASGRP2, TTC9, CD37, DPM3, and ARHGAP4 as potential prognostic markers [7].
Unlike previous studies that primarily focused on prognostic biomarkers, this study aims to identify both diagnostic and prognostic biomarkers for NPC through integrated bioinformatics analysis of publicly available transcriptomic datasets. By focusing on cellular biomarkers, we seek to complement existing EBV-based approaches and provide a more comprehensive understanding of NPC biology. Our findings are expected to contribute to the development of improved diagnostic and prognostic tools, ultimately enhancing patient outcomes in NPC management.
2. MATERIALS AND METHODS
2.1. Study Design
This research is a quantitative, analytical observational study aimed at identifying diagnostic and prognostic biomarkers for NPC using publicly available transcriptomic datasets. The study employed a secondary data analysis approach, using datasets obtained from the Gene Expression Omnibus (GEO), specifically GSE12452, GSE53819, and GSE10 2349.
2.2. Study Population and Data Collection
Datasets for diagnostic gene screening were selected based on the following criteria: (1) inclusion of both normal nasopharyngeal tissue and NPC tissue, and (2) a minimum of 10 samples per group. Exclusion criteria included: (1) datasets lacking raw expression data, or (2) datasets without clinical annotations or normal-tumor classification information. Sample sizes and clinical annotations varied across datasets and were obtained directly from the GEO database.
2.3. Variables and Measures
The primary variables were gene expression levels across samples. The main outcomes were differential gene expression (NPC vs. control) and progression-free survival, where survival data were available.
2.4. Dataset Acquisition and Preprocessing
Gene expression datasets for NPC were obtained from the GEO database (https://www.ncbi.nlm.nih.gov/ gds) using the search criteria: “(nasopharyngeal carcinoma) AND “Homo sapiens”[porgn:__txid9606]”. This search identified a total of 20 datasets. Each dataset was manually reviewed based on predefined inclusion criteria. The datasets screened for this study were provided in Table S1. Following this filtering process, two datasets (accession numbers: GSE12452, comprising 10 normal and 31 NPC tissue samples [8], and GSE53819, consisting of 18 normal and 18 NPC samples [9]) were selected for further analysis. Samples were classified into “Normal” and “Cancer” groups based on clinical annotations. Data were retrieved using the GEO query package in R version 4.4.2 and RStudio. Raw expression matrices were normalized, log2-transformed, and filtered to remove missing values and transcripts without gene symbols. Principal Component Analysis (PCA) was performed using the PCA tools package [10], on log2-transformed expression matrices after filtering out the bottom 10% of low-variance genes, to assess global expression patterns and to evaluate whether normal and tumor samples exhibit distinct clustering based on transcriptomic profiles.
2.5. Identification of Differentially Expressed Genes (DEGs)
Differential expression analysis was performed using the limma package in R [11]. A linear model was fitted to the expression data, and empirical Bayes moderation was applied to compute log2 fold changes (logFC) and adjusted p-values. Genes with an absolute logFC > 1 and an adjusted p-value < 0.05 were considered statistically significant DEGs. Genes without valid gene symbols or duplicate entries were removed by retaining the entry with the smallest p-value per gene. The top 25 upregulated and top 25 downregulated DEGs were selected based on fold change magnitude. Expression values of these 50 genes were extracted from the normalized expression matrix, log transformed, and converted to Z-scores by row-wise standardization. A heatmap was generated using the Complex Heatmap package in R [12], applying a diverging color scale for Z-scores and annotating columns based on sample groups (normal vs. cancer).
2.6. Survival Analysis
Among the 20 datasets previously filtered, only GSE102349 contained prognostic data. This dataset, comprising 113 NPC samples, was used to identify prognostic biomarkers based on RNA-seq expression profiles. For each gene, expression levels were dichotomized into “High” and “Low” groups using the median expression value as the cutoff. Survival analysis was performed using the Kaplan-Meier method and Cox-PH models. The lower expression group was used as the reference. Genes with a p-value < 0.05 in the Cox-PH model were considered significant prognostic markers. Kaplan-Meier survival curves were generated for each gene, and hazard ratios (HR) with 95% confidence intervals (CI) were calculated.
2.7. Functional Annotation and Integration of Prognostic-diagnostic Markers
Prognostic and diagnostic roles of genes were classified as “Oncogenic” or “Tumor Suppressor” based on two criteria: (1) expression trends in tumor versus normal tissues, and (2) hazard ratios (HR) from Cox-PH models. Genes upregulated in tumor tissues were classified as “Oncogenic,” while those downregulated in tumor tissues were classified as “Tumor Suppressors.” Similarly, genes with HR > 1 in Cox-PH analysis were labeled as “Oncogenic,” whereas genes with HR < 1 were labeled as “Tumor Suppressors.” Genes demonstrating consistent roles as either oncogenic or tumor suppressors across both diagnostic DEGs and prognostic Cox-PH analyses were categorized as “Consistent Prognostic-Diagnostic Markers.”
2.8. Elastic Net Model Analysis
The Elastic Net model, implemented using the glmnet package in R, was applied to refine the 54 candidate genes identified from CoxPH analysis. By combining L1 (LASSO) and L2 (Ridge) regularization, Elastic Net balances feature selection and multicollinearity handling, addressing limitations of CoxPH in high-dimensional data [13]. A survival object was created using “Time to event” and “Event” status, and the predictor matrix included expression values of the 54 candidate genes. Ten-fold cross-validation determined the optimal regularization parameter (lambda), and the final model identified genes with non-zero coefficients as significant. This approach ensured a robust, interpretable subset of survival-associated genes, reducing overfitting and improving generalizability. Similar machine learning approaches, including Elastic Net, have been successfully applied in other diseases such as Parkinson’s disease and breast cancer for robust biomarker selection [14, 15], supporting its use in our study.
2.9. RNA and Protein Correlation in Cancer Cell Lines Database
Gene and protein expression data were obtained from the CCLE database using the depmap R package [16], specifically version 22Q2 [17], with a snapshot date of 2024-10-24. RNA-seq expression data, measured in Transcripts Per Million (TPM), were retrieved using the depmap_TPM() function, while protein expression levels were extracted using the depmap_proteomic() function. The datasets were also available for download from https://depmap.org/portal. The datasets were filtered to remove missing values and grouped by tissue or lineage based on cell line annotations. To assess RNA protein concordance, candidate gene and protein expression data were integrated by matching cell lines across the datasets. Pearson correlation analysis was performed to evaluate the relationship between RNA and protein expression levels, and the results were visualized using scatter plots with regression trend lines to illustrate the degree of correlation.
2.10. Cross-dataset Validation of Diagnostic Gene Signatures
To validate the diagnostic potential of 11 candidate genes across independent datasets, we generated a comprehensive heatmap by integrating statistical test results from multiple GEO datasets. The datasets GSE12452 and GSE53819, previously used for diagnostic gene discovery, served as training sets, while GSE218847, GSE61218 [18], GSE40290, GSE34573 [19], GSE64634 [20], GSE227541 [21], GSE134886 [22], and GSE118719 [23], were used as validation datasets. Validation datasets were manually curated based on the inclusion criterion that the sample size ratio between cancer and normal groups did not exceed fivefold, to reduce sample imbalance bias. For each gene in each dataset, a color matrix was constructed: red indicated higher expression in NPC samples, blue indicated higher expression in normal samples, and gray represented no significant differential expression or unavailable data (e.g., probe not present or other technical reasons). A separate matrix overlaid statistical significance with symbols. Given the small sample sizes in some datasets, these results were interpreted cautiously and primarily served as visual cross-validation of consistency across datasets.
3. RESULTS
3.1. Identification of Diagnostic Biomarkers
To identify diagnostic biomarkers distinguishing normal nasopharyngeal tissue from NPC, we analyzed microarray data from GSE12452 (10 normal, 31 NPC) and GSE53819 (18 normal, 18 NPC). PCA was conducted using the PCA tools package to evaluate the global expression patterns and sample clustering within each GSE series. In GSE12452, the first two principal components (PC1 and PC2) explained 20.00% and 12.70% of the total variance, respectively. In GSE53819, PC1 and PC2 accounted for 19.01% and 12.53% of the variance (Fig. 1A). In both datasets, PCA revealed a clear separation between normal and cancer groups along the first principal component, indicating that the primary source of expression variability corresponds to the disease state. These findings support the biological relevance and internal consistency of each dataset, confirming their suitability for downstream differential expression analysis.
Differential expression analysis identified 1,332 DEGs in GSE12452 and 2,444 DEGs in GSE53819 (adjusted p-value < 0.05, |logFC| > 1) (Fig. 1B). A heatmap of the top 25 upregulated and top 25 downregulated DEGs across the two diagnostic datasets revealed clear and consistent transcriptomic separation between normal and cancer samples. These patterns highlight robust differential expression profiles associated with NPC (Fig. 1C). Notably, this study emphasizes identifying consistent DEG patterns for diagnostic biomarker discovery, rather than investigating the biological mechanisms of the top DEGs. To this end, a Venn diagram analysis was conducted, revealing 597 overlapping DEGs between the two datasets, with 591 genes showing consistent expression patterns (i.e., the same direction of regulation in both datasets) (Fig. 1D). This consistency across independent datasets enhances the reliability of these genes as potential diagnostic biomarkers for NPC.
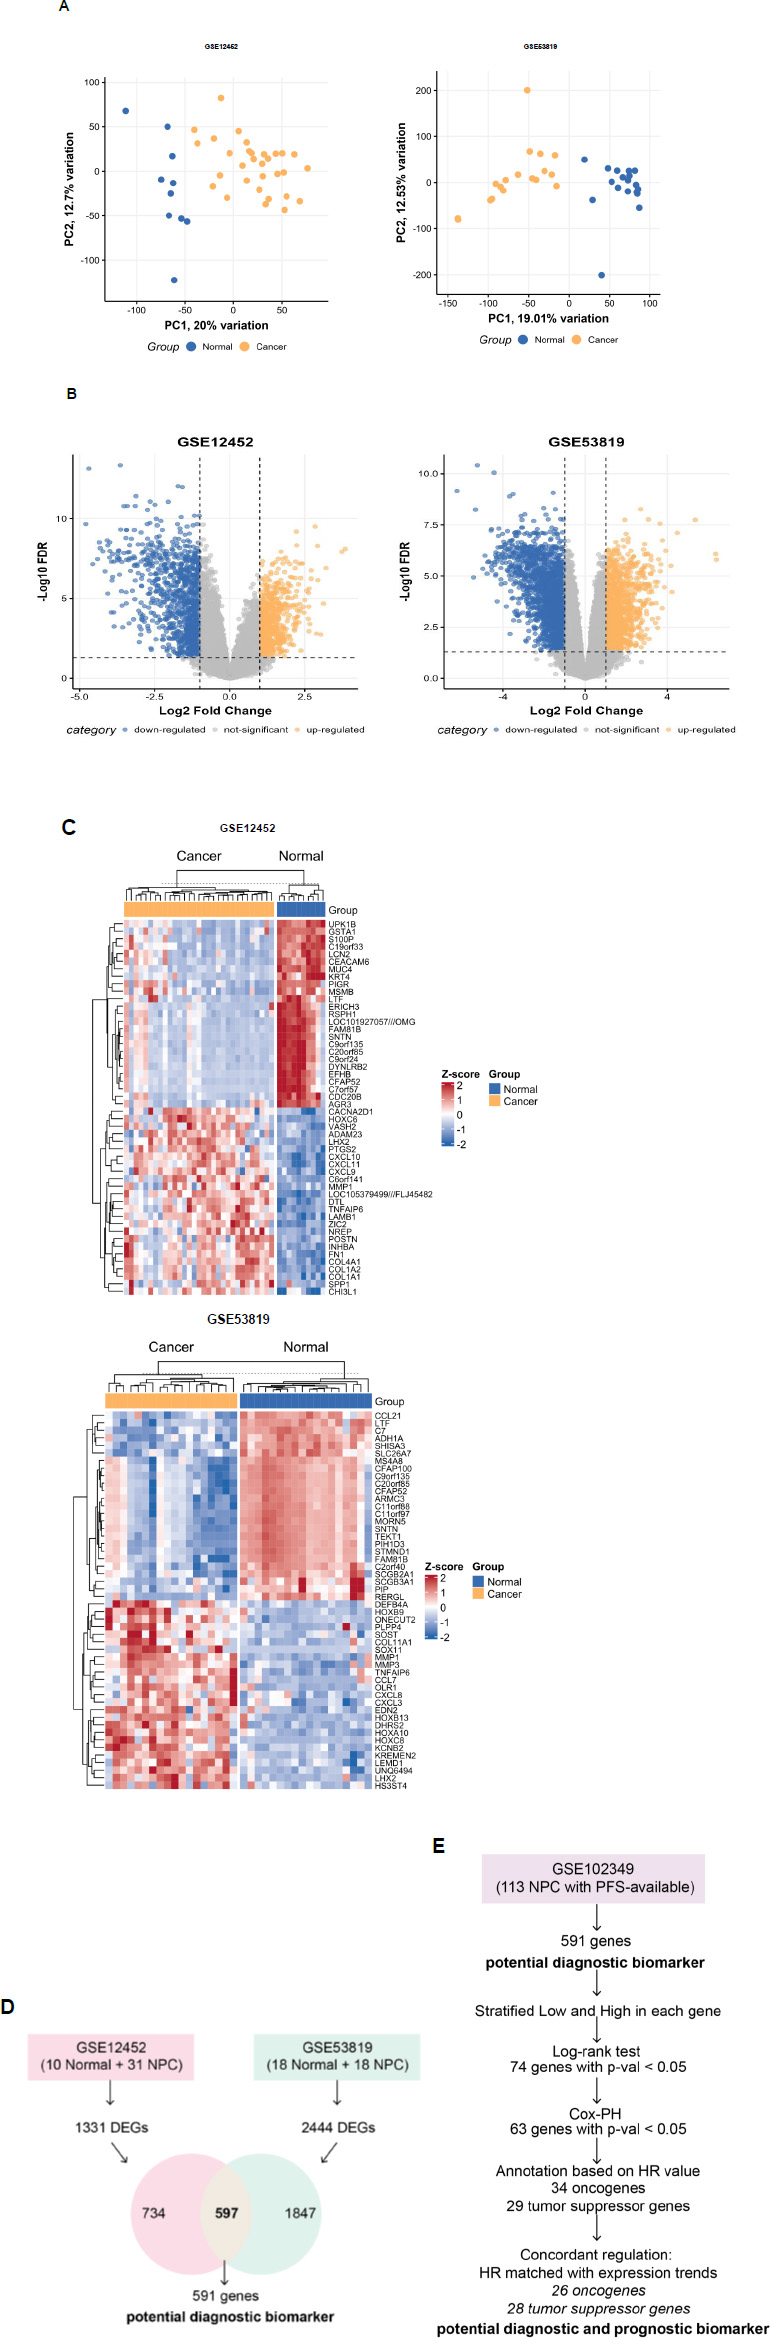
Identification of potential diagnostic and prognostic biomarkers for NPC. (A) Principal component analysis highlights clear differences in gene expression between normal and cancer samples in the GSE12452 and GSE53819 datasets. (B) Volcano plot showing differentially expressed genes (DEGs) from nasopharyngeal carcinoma microarray datasets (GSE12452 and GSE53819). Yellow and blue dots represent significantly upregulated and downregulated genes, respectively (|logFC| > 1, adjusted p-value < 0.05). (C) Heatmap showing the top 25 upregulated and top 25 downregulated differentially expressed genes (DEGs) in GSE12452 and GSE53819 (D) Analytical framework for identifying potential diagnostic biomarkers for NPC. (E) Analytical framework for identifying potential diagnostic and prognostic biomarkers for NPC.
3.2. Identification of Prognostic Biomarkers
To identify prognostic biomarkers associated with progression-free survival (PFS) in NPC, we performed survival analysis on RNA-seq data from the GSE102349 dataset. Gene expression levels were stratified into “High” and “Low” groups based on median expression values, and survival analysis was conducted using the log-rank test and Cox-PH model. An analytical framework for identifying potential diagnostic and prognostic biomarkers was illustrated in Fig. (1D).
Among the 591 potential diagnostic biomarker genes, a total of 74 genes were significantly associated with PFS based on the log-rank test (p-value < 0.05). Of these, 63 genes also showed significant associations in the Cox-PH model (p-value < 0.05), demonstrating their robust prognostic potential. These genes were further classified based on their HR: genes with HR > 1 were categorized as “Oncogenic,” while those with HR < 1 were classified as “Tumor Suppressors.” Additionally, we evaluated the concordant regulation by comparing HR with expression differences between normal and cancer tissues. This analysis revealed that 54 out of the 63 genes exhibited concordant regulation, reinforcing their dual diagnostic and prognostic significance.
Among the 54 candidate diagnostic-prognostic biomarkers, 26 genes were identified as oncogenic. These genes were upregulated in NPC compared to normal nasopharyngeal tissues and were associated with a higher risk of disease progression. Key oncogenic genes include KIF14, NEK2, DTL, EXO1, SPP1, MAD2L1, CENPH, SEMA6A, TTK, NFE2L3, ANLN, PDGFRL, CDCA2, PAPPA, RCN1, GAS2L3, BUB1B, OIP5, KIF23, FANCI, PRC1, TOP2A, PSMC3IP, KIF18B, BRIP1, and BIRC5.
Conversely, 28 genes were identified as tumor suppressors. These genes exhibited lower expression in NPC tissues compared to normal nasopharyngeal tissues, and higher expression of these genes was associated with a lower risk of disease progression. Key tumor suppressor genes include CYP4B1, FCRL4, FCRL2, FCRL1, CD1D, FCRLA, FCMR, CR2, CR1, VILL, DTHD1, STAP1, ADH1B, BANK1, IL33, PAX5, PTGDS, MS4A1, KLRB1, SLC16A7, CD19, PLCG2, P2RX5, CD79B, KLF2, CD22, NAPSB, and VPREB3. This functional classification provides valuable insights into the biological roles of these prognostic biomarkers, enhancing our understanding of NPC progression and highlighting their potential as therapeutic targets.
3.3. Refinement of Candidate Genes Using Elastic Net
To enhance the selection of prognostic genes, the Elastic Net model was applied using the glmnet package in R, narrowing down the 54 candidate genes derived from the CoxPH analysis. The Elastic Net analysis identified 11 genes with non-zero coefficients, indicating their potential association with survival outcomes. Cross-validation curve for the Elastic Net model was shown in Fig. (2A). Among these, 5 genes (e.g., GAS2L3, OIP5, NFE2L3, PDGFRL, BUB1B) exhibited positive coefficients, suggesting that higher expression levels are associated with an increased risk of disease progression. These genes were previously categorized as oncogenic. Conversely, 6 genes (e.g., VILL, IL33, KLF2, NAPSB, CYP4B1, CD1D) showed negative coefficients, implying that higher expression levels may be protective and associated with better survival outcomes. These genes were previously categorized as tumor suppressors. The strongest positive association was observed for GAS2L3 (coefficient = 0.47), while the strongest negative association was found for VILL (coefficient = -0.22). This refined subset of genes, derived from the initial 54 candidates, highlights their potential as biomarkers for survival prediction and demonstrates the utility of Elastic Net in handling high-dimensional data to identify robust, interpretable gene signatures.
Patients were stratified into “High Risk” and “Low Risk” groups based on the median risk score derived from the Elastic Net model. The risk score for each patient was calculated as the weighted sum of the expression values (in TPM) of the 11 selected genes, using the coefficients obtained from the final Elastic Net Cox model. The formula for the risk score is: Risk Score=(−0.0176×CYP4B1)+(−0.0056×CD1D)+(−0.2185×VILL)+(0.0926×NFE2L3)+(0.0925×PDGFRL)+(−0.0393×IL33)+(0.4696×GAS2L3)+(0.0329×BUB1B)+(0.1264×OIP5)+(−0.016×KLF2)+(−0.0527×NAPSB). Kaplan-Meier survival analysis revealed a significant difference in progression-free survival between the two groups (log-rank p-value = 0.0035) (Fig. 2B). Patients in the “High Risk” group exhibited significantly lower progression-free survival compared to those in the “Low Risk” group, further validating the prognostic utility of the identified gene signature.
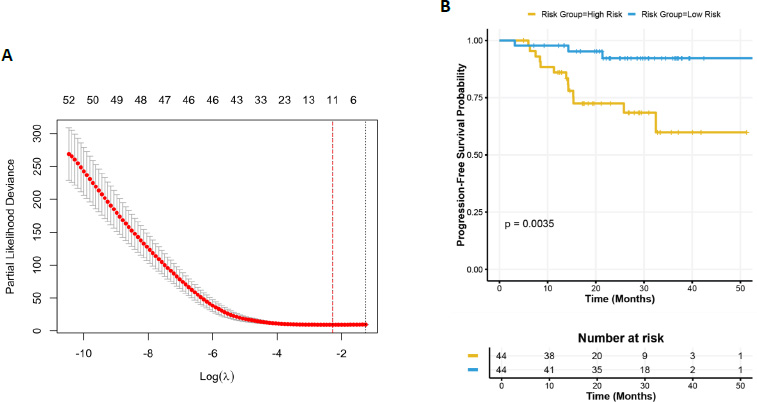
Elastic net regression and survival analysis. (A) Cross-validation curve for the Elastic Net model, showing the relationship between log(lambda) and partial likelihood deviance. The vertical dashed line indicates the optimal lambda value (λmin) selected based on the minimum cross-validation error. (B) Progression-free survival curves stratified by risk groups (“High Risk” and “Low Risk”) based on the median risk score derived from the Elastic Net model. The log-rank test p-value (p = 0.0035) indicates a significant difference in progression-free survival between the two groups. The risk table below the plot displays the number of patients at risk over time.
3.4. Exploration on the Potential 11 Candidate Diagnostic and Prognostic Genes
The expression profiles of the 11 candidate genes were compared between normal nasopharyngeal tissue and NPC tissue using the GSE12452 and GSE53819 datasets. All 11 genes were significantly differentially expressed between normal and NPC tissues (p < 0.01, Fig. 3A), suggesting their potential roles in NPC pathogenesis and their value as diagnostic markers. Kaplan-Meier survival analysis revealed that the expression levels of these genes were significantly associated with PFS in NPC patients (log-rank test, p < 0.05, Fig. 3B). Stratification of patients into high- and low-expression groups demonstrated distinct survival outcomes, further supporting the prognostic relevance of these genes.
The forest plot (Fig. 3C) illustrates the hazard ratios (HRs) and 95% CIs for PFS associated with each candidate gene. Genes with HR > 1, such as BUB1B, GAS2L3, NFE2L3, OIP5, and PDGFRL, were categorized as oncogenic, as higher expression correlated with increased risk of disease progression. Conversely, genes with HR < 1, including CD1D, CYP4B1, IL33, KLF2, NAPSB, and VILL, were identified as tumor suppressors, with higher expression associated with improved survival outcomes. These findings underscore the dual role of the candidate genes in NPC progression and their potential as prognostic biomarkers.
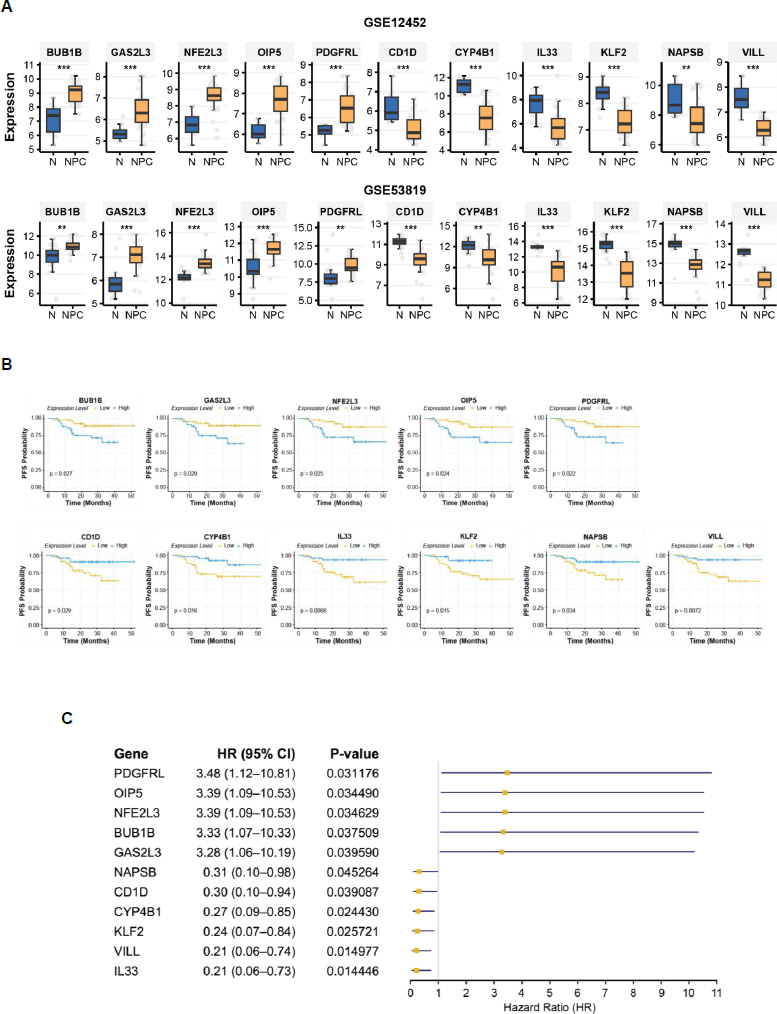
Expression profiles and prognostic significance of 11 candidate genes. (A) box plot depicting differential gene expression between normal nasopharyngeal tissue (N) and NPC tissue in the GSE12452 and GSE53819 datasets. Statistical significance was assessed using either the t-test or the Wilcoxon rank-sum test. p < 0.001 (***), p < 0.01 (**) (B) Kaplan-Meier survival curves for progression-free survival (PFS), stratified by high and low expression groups for each gene. Statistical significance was determined using the log-rank test. (C) Forest plot illustrating HRs for PFS. The forest plot displays the HRs and 95% CIs for PFS associated with each candidate gene.
3.5. RNA and Protein Correlation in Cancer Cell Lines Database
To validate the candidate biomarker genes identified from transcriptomic data (microarray and RNA-seq), we characterized their protein expression using the CCLE database. Among the 11 candidate genes, 10 were found in the CCLE RNA expression dataset, while one pseudogene (NAPSB) was not identified. Of these, 7 genes were present in the CCLE proteomic dataset, enabling RNA protein correlation analysis. Strikingly, all 7 genes exhibited positive correlations between RNA and protein expression, indicating concordance at the transcriptomic and proteomic levels.
Six of the seven genes showed significant Pearson correlations (p < 0.05), with correlation coefficients (r) ranging from 0.398 to 0.829. Notably, IL33 demonstrated the strongest correlation (r = 0.829, p < 0.001), followed by GAS2L3 (r = 0.651, p < 0.001) and PDGFRL (r = 0.646, p < 0.001), all of which exhibited robust RNA-protein concordance (r > 0.5). VILL (r = 0.542, p < 0.001), BUB1B (r = 0.445, p < 0.001), and OIP5 (r = 0.398, p < 0.001) also showed significant correlations, albeit with slightly lower coefficients. In contrast, NFE2L3 displayed a weak and non-significant correlation (r = 0.142, p = 0.274), suggesting potential post-transcriptional regulation or technical variability (Fig. 4). These findings highlight the strong RNA-protein concordance for most candidate genes, reinforcing their potential as robust biomarkers for further validation at both the RNA and protein levels.
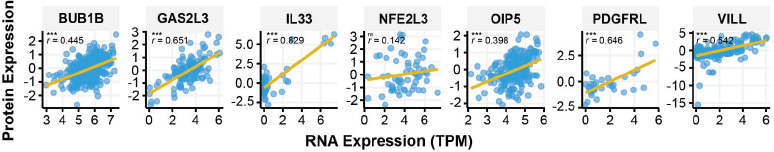
RNA-Protein Correlation of Candidate Biomarker Genes in Cancer Cell Lines. Scatter plots depict the correlation between RNA expression TPM and protein expression levels for candidate biomarker genes in the CCLE database. Pearson correlation coefficients (r) and corresponding p-values are displayed for each gene. p < 0.001 (***), not-significant (ns).
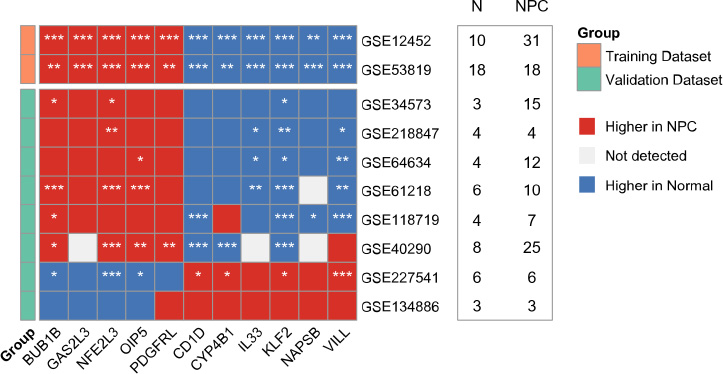
Cross-dataset heatmap validation of 11 diagnostic candidate genes across eight independent GEO datasets. Red indicates higher expression in NPC, blue in normal tissues, and gray represents non-significant or unavailable data. (*) denotes statistical significance. Sample sizes (N = normal; NPC = nasopharyngeal carcinoma) are shown alongside each dataset.
3.6. Cross-dataset Validation Confirms Consistent Diagnostic Gene Expression Patterns
To assess the robustness of the 11 diagnostic candidate genes across independent cohorts, we performed a cross-dataset validation using eight publicly available GEO datasets that met our inclusion criteria. Among these, six datasets: GSE34573, GSE218847, GSE64634, GSE61218, GSE118719, and GSE40290, demonstrated a consistent transcriptomic pattern: BUB1B, GAS2L3, NFE2L3, OIP5, and PDGFRL were generally upregulated in nasopharyngeal carcinoma (NPC) samples, while CD1D, CYP4B1, IL33, KLF2, NAPSB, and VILL exhibited higher expression in normal tissues (Fig. 5). In contrast, two datasets: GSE227541 and GSE134886, showed a reversed or partially reversed pattern, which may be attributed to limited number of samples, technical variation, limited probe representation, or biological heterogeneity. Detailed statistical results are provided in Table S2.
It is important to interpret the significance levels with caution, as several datasets contained limited sample sizes per group (Fig. 5), which reduces statistical power. Therefore, instead of relying solely on p-values, we focused on the directionality and consistency of gene expression trends across datasets, which offers a more robust validation of their diagnostic potential. Notably, due to the lack of available prognostic data in any of the external NPC datasets, independent validation of the prognostic gene signature could not be performed.
4. DISCUSSION
Our study identified 11 candidate genes from transcriptomic data, comprising 5 potential oncogenic biomarkers (BUB1B, GAS2L3, NFE2L3, OIP5, and PDGFRL) and 6 potential tumor suppressor biomarkers (CD1D, CYP4B1, IL33, KLF2, NAPSB, and VILL) in NPC. Notably, NAPSB, a pseudogene, has not been previously reported as a biomarker in NPC. However, it has been implicated in other cancers, such as hepatocellular carcinoma [24], acute myeloid leukemia [25], and pancreatic adenocarcinoma [26]. In addition, NAPSB were also found to be upregulated in carcinoma of the uterine cervix (CACX) [27]. Our findings suggest that NAPSB may play a role in NPC pathogenesis, warranting further investigation into its functional mechanisms and clinical relevance.
Among the oncogenic candidates, BUB1B, encoding BUB1 mitotic checkpoint serine/threonine kinase B, has been previously reported to promote NPC progression [28], a finding consistent with our results. GAS2L3 (Growth Arrest Specific 2 Like 3), which regulates cytoskeleton organization and cytokinesis [29], has not been previously associated with NPC. Our identification of GAS2L3 as a potential oncogenic biomarker represents a novel finding, highlighting its potential role in NPC progression. Similarly, Nuclear factor erythroid 2 (NF-E2)-related factor 3 (NFE2L3), a transcription factor involved in cell differentiation, oxidative stress, and tumor growth, has been implicated in various cancers such as colorectal, liver, thyroid, pancreatic, and renal cancer [30], but not NPC. Our study is the first to report its upregulation in NPC and its potential as a prognostic biomarker. Opa interacting protein 5 (OIP5) was reported as a tumor promoter gene, highly expressed in NPC, and promoted NPC progression by modulating JAK2/STAT3 [31], aligning with our findings. Intriguingly, platelet-derived growth factor receptor-like (PDGFRL), which exhibits dual roles as a tumor suppressor in breast [32] and a tumor promoter in gastric cancer [33], has not been previously studied in NPC. Our results suggest that PDGFRL may serve as both a diagnostic and prognostic biomarker in NPC, underscoring its context-dependent roles in cancer biology.
Among the tumor suppressor candidates, CD1D, a member of the CD1 glycoprotein family, has been implicated in immune modulation within the tumor microenvironment. While CD1D expression is associated with aggressive renal cell carcinoma [34]. It also facilitates tumor suppression through antigen presentation to NKT cells [35]. Our findings support its tumor-suppressive role in NPC, suggesting its potential as a therapeutic target. CYP4B1, downregulated in lung adenocarcinoma and urothelial carcinoma [36, 37] also exhibited tumor-suppressive characteristics in NPC, with low expression correlating with poor survival. Interleukin-33 (IL33), an alarmin cytokine involved in tissue repair, has been linked to poor progression-free survival in NPC [38, 39], consistent with our results. KLF2, a transcription factor downregulated in head and neck squamous cell carcinoma (HNSC) [40], has not been previously studied in NPC. Our findings confirm its tumor-suppressive role in NPC, aligning with its function in HNSC. Finally, VILL, which exhibits specific methylation patterns in NPC [41], emerged as a potential diagnostic and prognostic marker in our study, further validating its role in NPC pathogenesis.
Collectively, our study highlights several candidate genes with potential diagnostic and prognostic value in NPC, including NAPSB, which has been largely understudied in NPC. While our findings provide a transcriptomic basis for their clinical relevance, the biological functions of NAPSB and other identified genes in NPC pathogenesis remain to be elucidated. Further studies are warranted to explore their mechanistic roles through in vitro and in vivo functional assays, as well as validation at the protein level. Such efforts will be crucial to determine their potential utility in clinical applications, including as targets for therapy or biomarkers for early detection and prognosis.
STUDY LIMITATIONS
This study has several limitations. First, the diagnostic analysis was based on only two datasets, which may limit the generalizability of the findings, as a larger sample size from diverse datasets could provide a more comprehensive view. For prognostic analysis, only one dataset (GSE102349) contained survival information, which may reduce the representativeness and robustness of the survival analysis. Additionally, while RNA-protein expression concordance was validated using the CCLE dataset, the observed protein expression patterns may not fully reflect the expression in human NPC tissues, due to potential differences in the tumor microenvironment and experimental conditions. The limited number of available NPC transcriptomic datasets also restricts the ability to confirm the generalizability of the findings. Finally, as an observational study based on secondary data, the results should be interpreted cautiously, and experimental validation is needed to confirm the identified biomarkers.
CONCLUSION
Our study not only corroborates previous findings but also identifies novel biomarkers with potential diagnostic and prognostic significance in NPC. The dual roles of some genes, such as PDGFRL and CD1D, highlight the complexity of cancer biology and the importance of context-specific analyses. Furthermore, RNA-protein correlation analysis using the CCLE dataset revealed significant concordance between RNA and protein expression for six genes (BUB1B, GAS2L3, IL33, OIP5, PDGFRL, and VILL). This strong RNA-protein correlation suggests that these genes could be reliably measured at either the RNA or protein level, providing flexibility in developing diagnostic assays. Future studies should focus on elucidating the functional mechanisms of these genes, particularly GAS2L3 and NFE2L3, which have not been previously associated with NPC. Additionally, the pseudogene NAPSB warrants further investigation to determine its functional relevance in NPC. Collectively, our findings provide a robust foundation for advancing diagnostic strategies, improving prognostic stratification, and developing targeted therapies in NPC.
AUTHORS' CONTRIBUTION
N.A.: Conceptualization, Methodology, Investigation, Software, Formal Analysis, Writing – Original Draft, Writing – Review & Editing;. L.R.: Conceptualization, Methodology, Software, Formal Analysis, Validation, Writing – Review & Editing;. J.Y.C.: Supervision, Conceptualization, Writing - Review & Editing.
LIST OF ABBREVIATIONS
| CCLE | = Cancer Cell Line Encyclopedia |
| Cox-PH | = Cox Proportional Hazards |
| DEGs | = Differentially Expressed Genes |
| EBV | = Epstein-Barr virus |
| GEO | = Gene Expression Omnibus |
| HR | = Hazard Ratio |
| NPC | = Nasopharyngeal Carcinoma |
| PCA | = Principal Component Analysis |
| PFS | = Progression Free Survival |
| TPM | = Transcripts per Million |
ETHICAL STATEMENT
This study utilizes publicly available data from the Gene Expression Omnibus (GEO) and the Cancer Cell Line Encyclopedia (CCLE), obtained using the GEOquery and depmap R packages. Since these datasets are openly accessible, their use and analysis are permitted. The original data sources have been properly acknowledged. As no human or animal subjects were directly involved, ethical approval was not required. This study complies with all relevant publication guidelines.
AVAILABILITY OF DATA AND MATERIAL
The data supporting the findings of this article are publicly available in the Gene Expression Omnibus (GEO) at https://www.ncbi.nlm.nih.gov/geo/, under accession numbers: GSE12452, GSE53819, GSE218847, GSE61218, GSE40290, GSE34573, GSE64634, GSE227541, GSE134886, and GSE118719.
ACKNOWLEDGEMENTS
Declared none.

