
Expressional and Prognostic Value of GPNMB in Gastric Cancer via Integrated Bioinformatics Analyses
Authors Info & Affiliations
Abstract
Introduction
Gastric Cancer (GC) is a major global health problem with high incidence and mortality, making it necessary to find new prognostic biomarkers. Glycoprotein Non-Metastatic Melanoma Protein B (GPNMB) has been linked to tumor growth in several cancers, but its role as a prognostic marker in GC remains unclear.
Methods
To explore GPNMB’s expression, immune microenvironment association, and prognostic value in GC, this study integrated bioinformatics (TCGA, GEO, GEPIA) and Immunohistochemistry (IHC) on 73 paired GC/adjacent tissues, with semi-quantitative scoring and statistical analyses (chi-square, Mann-Whitney U, log-rank, multivariate Cox regression).
Results
GPNMB was significantly overexpressed in GC tissues vs. adjacent tissues (IHC: 57 ± 53 vs. 38 ± 39, p = 0.018; consistent with TCGA/GEO). High GPNMB correlated with abnormal immune/stromal scores (F = 6.55, Pr(>F) = 0.000249), increased immunosuppressive cell infiltration, decreased effector T cells, advanced M stage (distant metastasis rate: 24.2% vs. 5.0%, p = 0.017), shorter overall survival (log-rank p = 0.018), and was an independent prognostic factor (HR = 1.52, 95% CI:1.03–2.24, p = 0.035; multi-dataset HR:1.446–1.7, p < 0.05). Females showed a higher proportion of GPNMB (36.4% vs. 17.5% males), but this difference was not significant (p = 0.068).
Discussion
Our study confirms GPNMB’s overexpression in gastric cancer via integrated bioinformatics and IHC, linking it to immune microenvironment dysregulation, distant metastasis, and poor prognosis-reinforcing its role as an independent prognostic biomarker and potential immunotherapy target, while noting limitations of small single-center IHC cohort, lack of experimental validation for relevant signaling pathway involvement, and reliance on algorithmic immune infiltration analyses.
Conclusion
GPNMB is overexpressed in GC, drives progression (especially metastasis), and shortens survival by regulating the immune microenvironment to exacerbate immune escape. It serves as an independent GC prognostic marker for risk stratification and a potential target for combined immunotherapy.
1. INTRODUCTION
Gastric Cancer (GC) remains a global health concern, ranking as one of the most common malignancies and a leading cause of cancer-related deaths [1, 2]. Despite advancements in treatment modalities-including surgery, chemotherapy, targeted therapies, and emerging Immune Checkpoint Inhibitors (ICIs)-the prognosis for most GC patients, particularly those diagnosed at advanced or metastatic stages (accounting for approximately two-thirds of cases), remains suboptimal due to limited efficacy of conventional treatments and challenges like ICI resistance and adverse reactions [3, 4], This underscores the urgent need for novel prognostic markers and therapeutic targets to refine risk stratification, improve treatment responsiveness, and advance personalized care for GC patients [5, 6].
Glycoprotein Non-Metastatic Melanoma Protein B (GPNMB), a glycosylated type I transmembrane protein, has garnered increasing attention in the field of oncology [7]. Initially associated with melanoma, GPNMB has since been reported to be aberrantly expressed in multiple types of cancer, such as breast, lung, and prostate cancer [8]. In gastric cancer, emerging evidence indicates that GPNMB may play a pivotal role in tumorigenesis and disease progression [9-11]. For instance, previous studies have demonstrated differential expression of GPNMB between gastric adenocarcinoma tissues and adjacent normal tissues [12]. However, the exact function of GPNMB in gastric cancer and its potential as a prognostic biomarker remain incompletely understood.
GPNMB has evolved from an initially identified tumor suppressor to a key oncogenic driver, and its role in tumors differs from its function in maintaining homeostasis in non-tumor diseases [13, 14]. In tumorigenesis and development, GPNMB, on the one hand, mediates immune suppression by promoting the polarization of tumor-associated macrophages toward the M2 phenotype, and enhances tumor cell metabolism and invasive capacity through the aberrant activation of pathways such as CD44/NF-κB and mTORC1, thereby facilitating metastatic colonization [15, 16]. Recent studies further support its involvement in tumor immune microenvironment remodeling, with correlations observed between GPNMB expression and immune cell infiltration patterns [17]. Additionally, it can promote the proliferation, invasion, and metastasis of various cancers, including breast cancer [18, 19] and Head and Neck Squamous Cell Carcinoma (HNSCC) [20, 21], induce epithelial-mesenchymal transition and stemness, and drive malignant progression. Its overexpression is associated with poor prognosis, making it a potential pan-cancer therapeutic target [22, 23].
Unraveling the role of GPNMB in gastric cancer could provide novel insights into the underlying molecular mechanisms of the disease. It may also facilitate the development of more accurate prognostic models, thereby enabling personalized treatment strategies for patients [24]. In this study, we aim to comprehensively characterize GPNMB as a potential prognostic marker for gastric cancer by investigating its expression pattern, its correlation with clinicopathological features, and its impact on patient survival.
2. MATERIALS AND METHODS
2.1. Bioinformatics Data Sources and Analyses
2.1.1. Data Acquisition
To ensure the reliability and representativeness of bioinformatics analyses of GPNMB’s role in GC, this study systematically extracted and screened GC-related data from three authoritative public databases while strictly adhering to predefined inclusion criteria.
First, data sources were selected to cover multi-dimensional validation needs: TCGA database provided the core Stomach Adenocarcinoma (STAD) dataset, encompassing GPNMB mRNA expression profiles and matched clinical follow-up information from 408 primary GC tissue samples and 211 adjacent normal tissue samples. This large sample size laid the foundation for initial differential expression analysis and prognostic modeling. To verify the consistency of findings across independent cohorts, three datasets (GSE26253, GSE62254, GSE54129) from the GEO database were included, focusing on cross-validation of GPNMB’s differential expression pattern between GC and normal tissues, as well as its correlation with patient survival trends. Additionally, the GEPIA database was utilized to confirm GPNMB’s status as a key differential gene in GC, leveraging its integrated pan-cancer expression data to help rule out database-specific biases.
To minimize confounding factors, strict inclusion criteria were applied to all bioinformatics datasets: Only samples from patients with pathologically confirmed primary GC were included; cases with incomplete clinical information or a history of preoperative chemotherapy/ radiotherapy were excluded. this ensured that the observed associations between GPNMB expression and GC characteristics were not confounded by prior treatment or data ambiguity, thereby enhancing the credibility of subsequent analytical results.
2.1.2. Bioinformatics Analysis Methods
Differential expression analysis: R software was used to compare GPNMB mRNA expression between GC and normal tissues, with significance thresholds set at |log2(fold change)|>1 and p < 0.05.
Prognostic analysis: Kaplan-Meier survival curves and univariate Cox regression were used to analyze the association between GPNMB expression and overall survival in TCGA and GEO datasets; median expression was used as the cutoff for high/low expression groups.
Pan-cancer expression analysis: GEPIA was used to generate pan-cancer GPNMB expression profiles, and Interactive Bodymap was used to visualize tissue-specific expression differences between tumor and normal samples.
2.2. IHC Validation
2.2.1. Tissue Sample Collection
Shanghai Outdo Biotech Company (Shanghai, China) provided the GC tissue microarray (HStmA180Su32). The time of specimen collection was 2015-01 to 2016-08, Final follow-up time was 2021-09. Initially, 80 pairs of GC and adjacent paracancerous tissue samples were collected; 5 cases were excluded due to incomplete data, and 2 due to tissue detachment, resulting in 73 valid pairs.
All procedures involving human participants complied with the Declaration of Helsinki. Written informed consent was obtained from each participant (covering tissue and clinical data usage), and the study was approved by the Ethics Committee of Shanghai Biotechnology Co., Ltd (Approval No. YB M-05-01).
2.2.2. Experimental Apparatus and Reagents
Apparatus: Constant-temperature drying oven (PH-070A, Shanghai Yiheng), automatic dewaxing machine (LEICA ST5020, LEICA), antigen retrieval instrument (PT Link, Dako), automatic IHC staining system (Autostainer Link 48, Dako), centrifuge (1-14, Sartorius), Aperio scanner (Aperio XT, LEICA).
Reagents: EnVision™ FLEX+ Mouse Secondary Antibody Kit (K8002, Dako), Antibody Diluent with Background Reducing Components (S3022, Dako), Gene IHC Kit (GK800711, Gene Technology), GPNMB primary antibody (dilution at 1:25).
2.2.3. Experimental Procedure
Paraffin-embedded gastric cancer tissue sections were baked at 63°C for 1 hour to melt the wax. Slides were dewaxed in xylene (2 × 15 minutes) and rehydrated through graded alcohols (2 × 100% alcohol for 7 minutes each, then 90%, 80%, 70% alcohol for 5 minutes each). Antigen retrieval was done using PT Link, followed by cooling in distilled water for more than 10 minutes. Slides were incubated with diluted GPNMB primary antibody at 4°C overnight, warmed to room temperature for 45 minutes, and washed with PBS. Then, they were processed in Autostainer Link 48 for blocking, secondary antibody binding, and DAB staining. Counterstaining was performed with hematoxylin (1 minute), differentiated with 0.25% hydrochloric acid alcohol (10 seconds), and rinsed with tap water (5 minutes). Finally, the slides were dried and mounted with neutral balsam.
2.2.4. Data Interpretation and Standardization
Two pathologists, blinded to sample origin and patient outcomes, evaluated all images. Staining was scored using a semiquantitative system, considering both intensity (nuclear and membranous staining: 0 = blank, 1 = light yellow, 2 = yellow, 3 = brown) and extent of stained cells (0 = 0%, 1 = 1–24%, 2 = 25–49%, 3 = 50–74%, 4 = 75–100%).
2.2.5. Clinical Data Grouping
Categorical variables: Gender (male/female), surgical approach (total gastrectomy/partial gastrectomy), tumor location (cardia/fundus vs. body/antrum/angle), pathological grade (I/II vs. III), HER2 status (negative/ positive), HP status (negative/positive), T stage (T1+T2 vs. T3+T4), N stage (N0 vs. N1+N2+N3), M stage (M0 vs. M1), TNM stage (I+II vs. III+IV). Continuous variables: Age, tumor size, CEA level.
2.3. Statistical Analysis
Association between GPNMB expression and clinical parameters in cancer patients: For categorical variables, data were presented as counts (percentages) and analyzed using the chi-square test [25]. For continuous variables, data are expressed as the median (lower quartile, upper quartile) and analyzed using the Mann-Whitney U test. P-value<0.05 is considered statistically significant. Software: SPSS 26.0,R 4.2.1 [26].
3. RESULTS
3.1. Bioinformatics: GPNMB Expression and Prognostic Trends in GC
3.1.1. Pan-Cancer and GC-Specific Expression of GPNMB
3.1.1.1. Pan-cancer Analysis
Figure 1 showed that GPNMB was aberrantly expressed in multiple tumors: in Stomach Adenocarcinoma (STAD), GPNMB mRNA was significantly upregulated compared to normal tissues.
3.1.1.2. The Interactive Bodymap
The GPNMB gene shows significant expression differences in Stomach Adenocarcinoma (STAD), and its expression level is associated with the sample type, tumor stage, and grade of STAD (Fig. 2A-G). Specifically, its expression level in primary tumors differs from that in normal tissues, and it also varies across different cancer stages and tumor grades. Figure 2C compared GPNMB mRNA in 408 gastric cancer tissues and 211 adjacent tissues. The box plot shows that GPNMB is higher in cancer tissues. Among these, the differences in expression across different stages are statistically significant. Meanwhile, GPNMB also exhibits differential expression levels in a variety of other cancers (such as UVM, GBM, BLCA, LIHC, etc.) and their corresponding normal tissues, indicating its expression characteristics in multiple tumors (Fig. 2).
3.1.2. Prognostic Relevance of GPNMB (Bioinformatics)
(Kaplan-Meier OS curves (TCGA/GSE26253/GSE62254/ GSE54129); high GPNMB correlates with shorter OS (p < 0.05, HR = 1.499–1.7)).
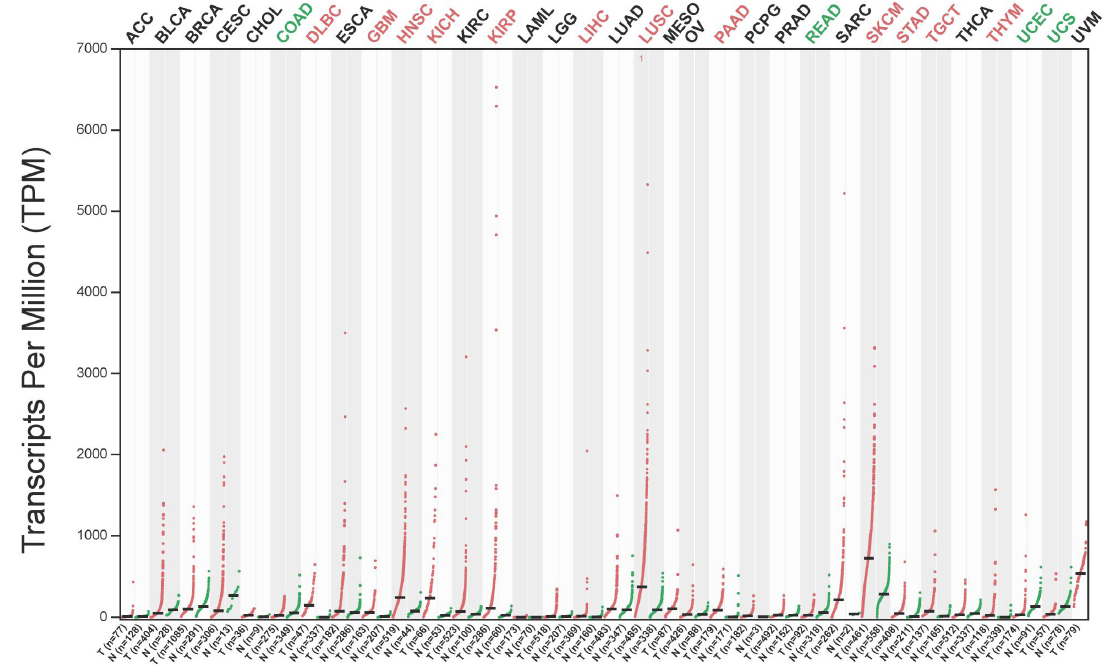
The expression of GPNMB in pan-cancer. (GPNMB mRNA levels across 33 cancer types and normal tissues (TCGA); significantly upregulated in Stomach Adenocarcinoma (STAD) vs. normal gastric tissues, p < 0.05).
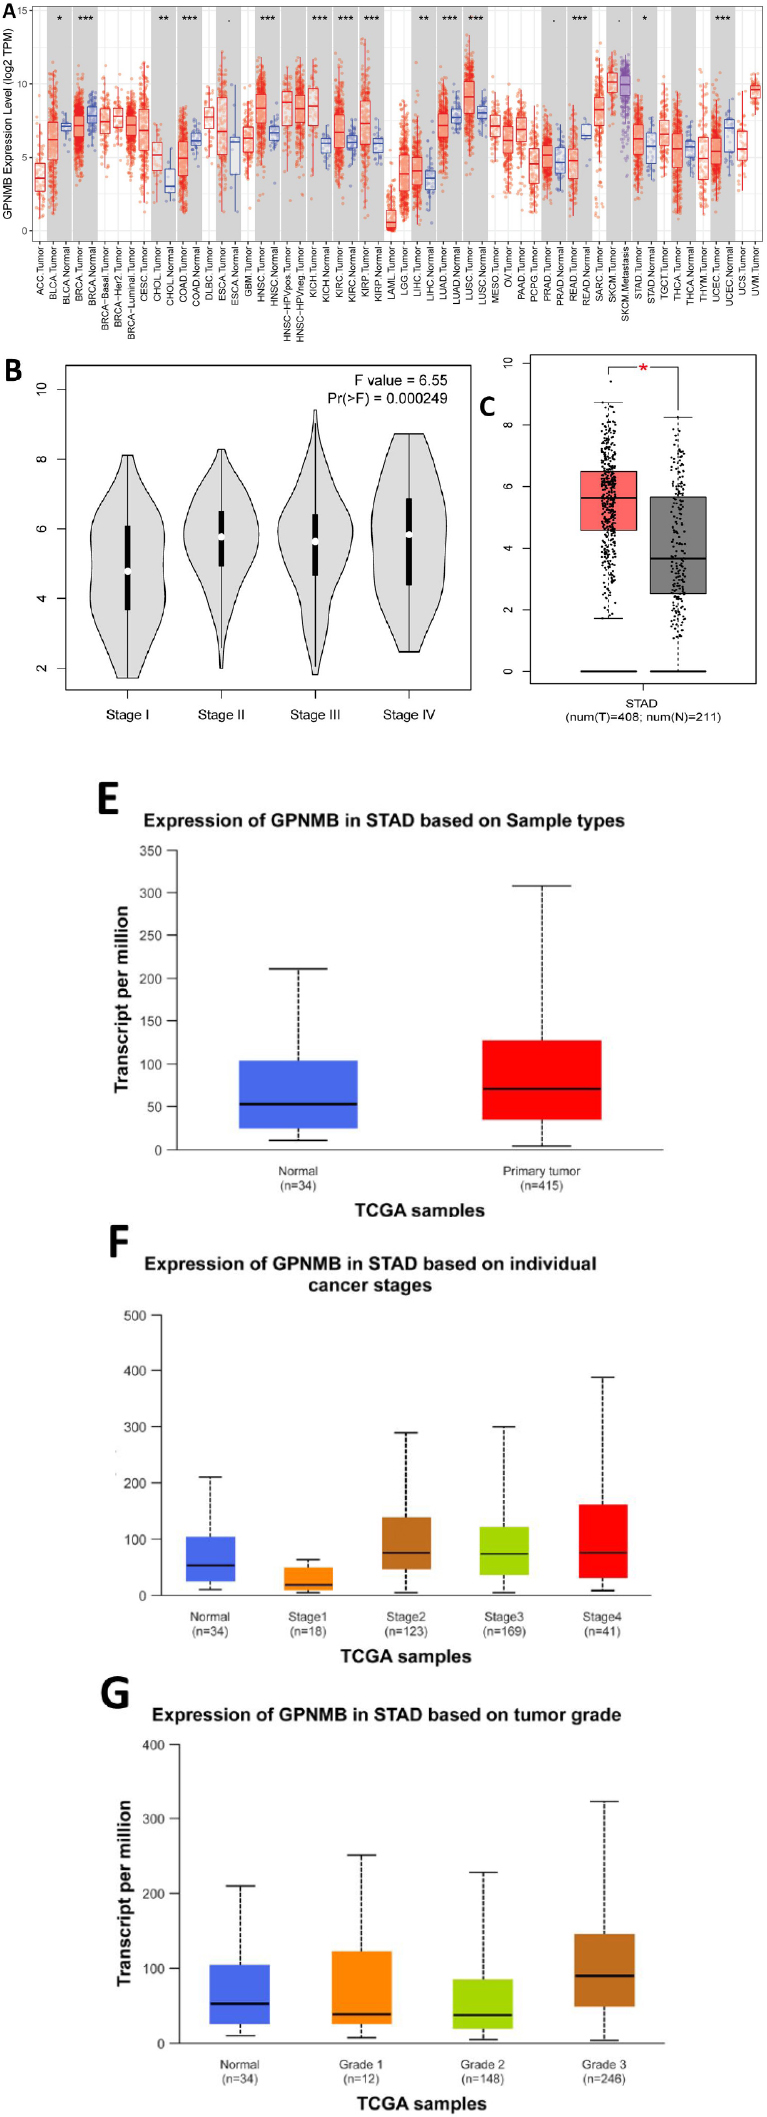
Analysis of the expression profile of the GPNMB gene in pan-cancer and gastric cancer. ((A-G) TCGA data (408 tumors, 211 normals): GPNMB is higher in STAD than normals (p < 0.05) and varies with clinical stage (F = 6.55, Pr(>F) = 0.000249)).
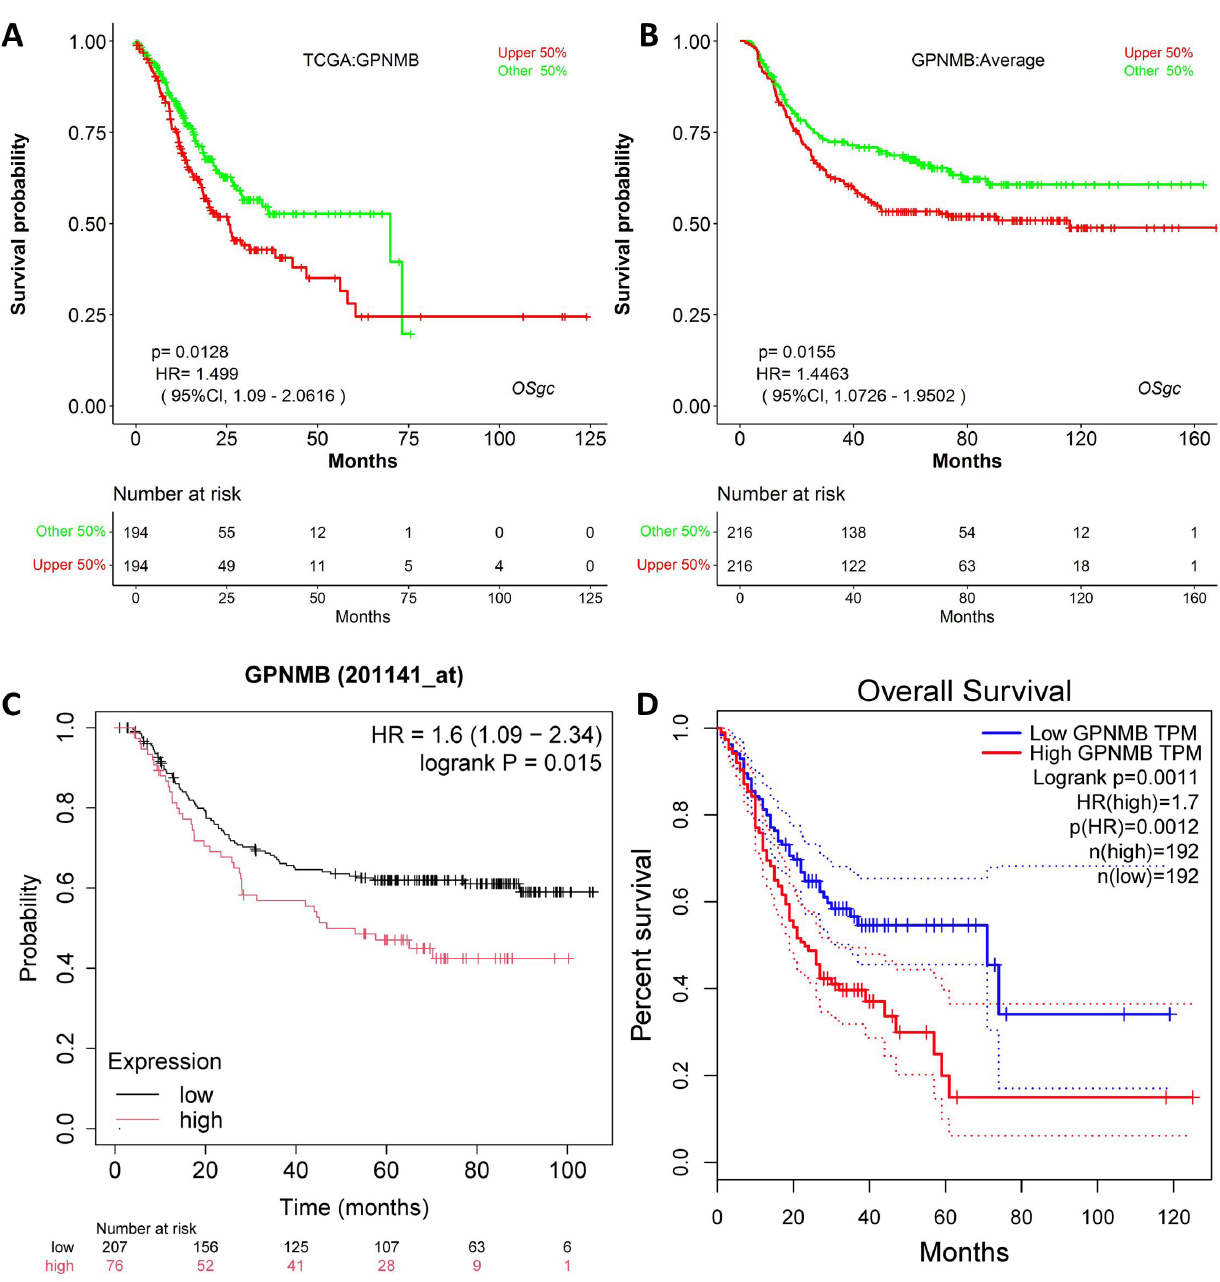
Stratified analysis of GPNMB expression on gastric cancer survival prognosis using TCGA data.
Kaplan-Meier survival analysis across multiple datasets (TCGA, GSE26253, GSE62254) showed that high GPNMB expression correlated with shorter overall survival (Fig. 3A-D). For example, in TCGA-STAD, high GPNMB expression was associated with HR (1.499-1.7 and p=0.0011-0.015), confirming its potential as a prognostic indicator.
3.2. Bioinformatics: GPNMB and the Immune Microenvironment in GC
3.2.1. Immune Checkpoint Correlation
This heatmap uses TCGA data to show GPNMB’s expression correlations with other genes in gastric cancer (Fig. 4). Red/blue gradients reflect correlation strength: red indicates positive co-expression, and blue indicates negative correlation. It links GPNMB to immune checkpoints, T-cell markers, etc. These ties suggest that GPNMB may shape the tumor immune microenvironment-like connecting to immunosuppressive genes or anti-tumor T-cell signatures. Overall, this supports the potential role of GPNMB in driving immune evasion and affecting immunotherapy response in gastric cancer, pending further validation.
3.2.2. Immunotherapy Response Analysis
This set of figures contains 6 sub-figures. Figure 5A-D are violin box plots that group samples based on GPNMB expression and show differences in the distribution of different immune-related indicators. Figure 5E and F are scatter plot, displaying the linear associations between GPNMB expression and specific immune indicators. The P-values and correlation coefficients (r) are used to quantify the strength of these associations.
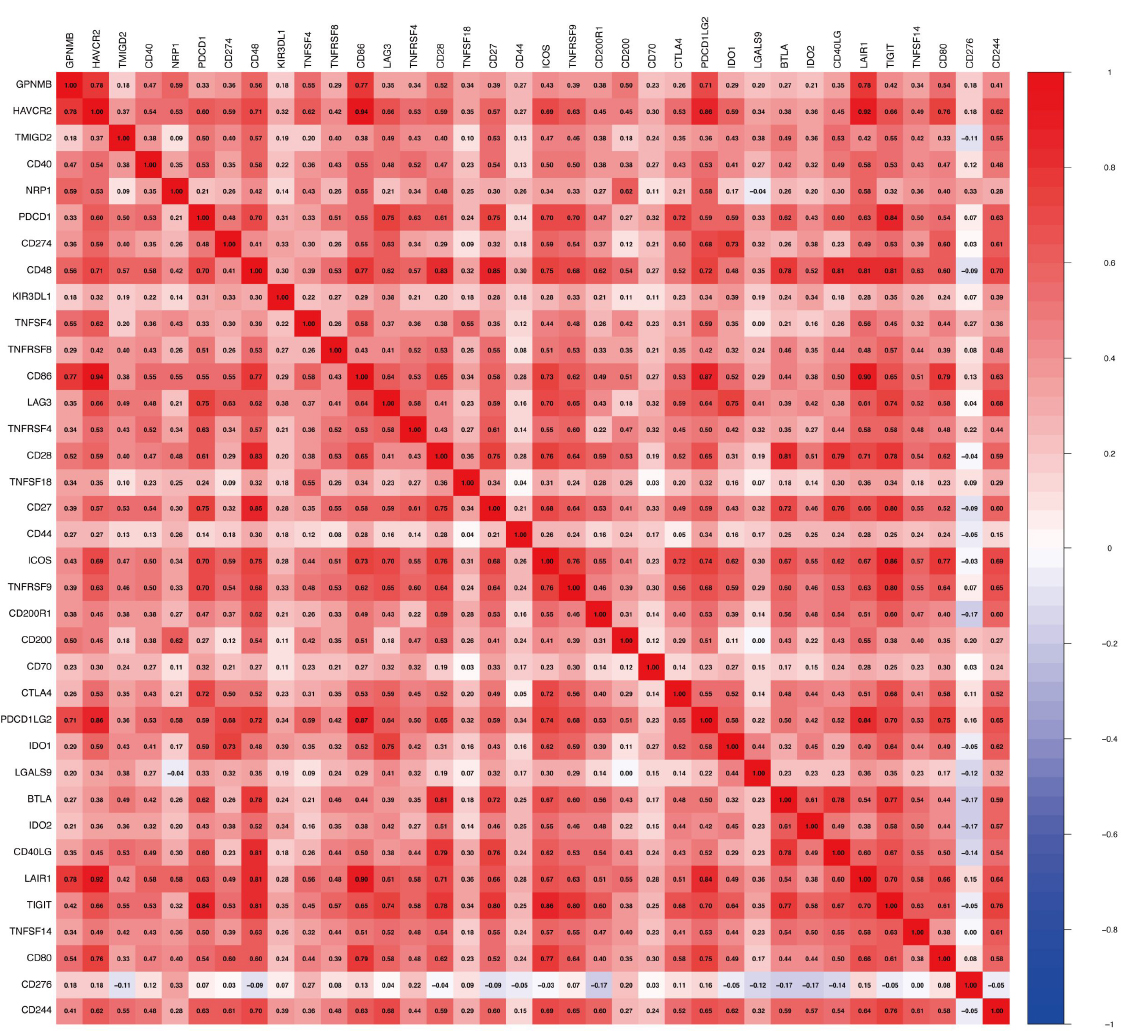
The heatmap of GPNMB and immune cell - related markers. (Y-axis: GPNMB and 30 immune checkpoints/T-cell markers; X-axis: the same set of genes; color gradients indicate Pearson correlation coefficients (red = positive, blue = negative)).
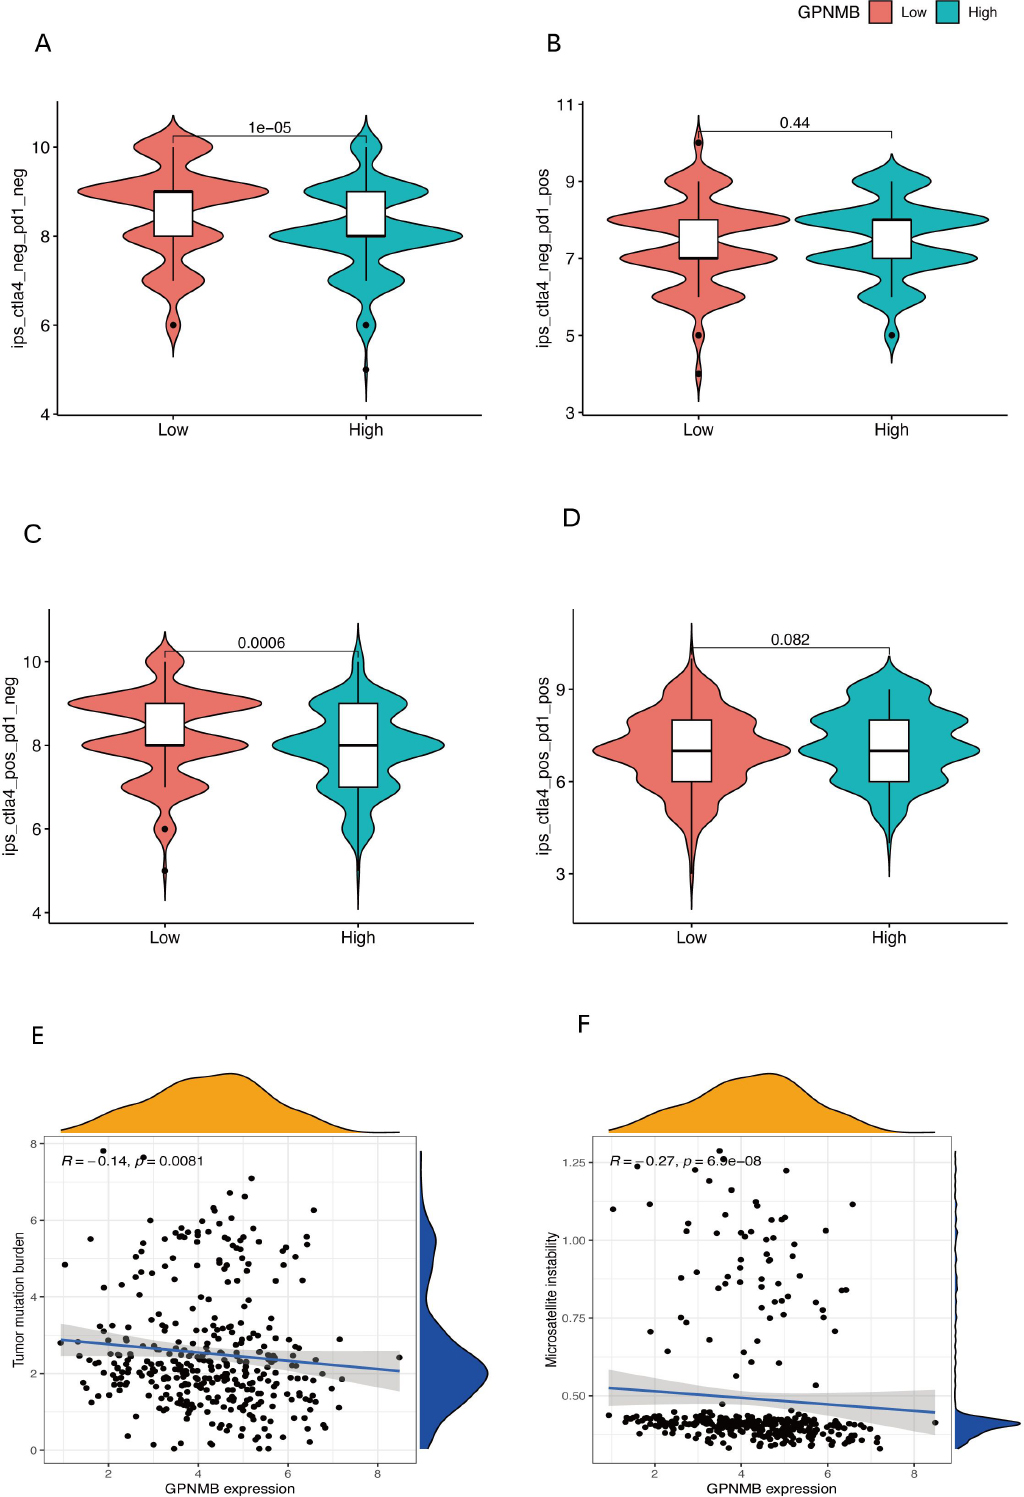
Correlative analysis of GPNMB expression with immune - related metrics in cancer immunotherapy. ((A-D) violin-box plots (PD-L1: p = 0.0006; TMB: p = 0.082); (E and F) scatter plots (PD-L1 r = 0.27, TMB r = -0.14, p < 0.05)).
From the perspective of how immunotherapy works: If Figure 5A and C relate to PD-L1, the PD-L1 levels in the group with high GPNMB expression are usually much higher. This shows that GPNMB may boost PD-L1 production, which then prevents T cells from functioning properly and helps tumors evade the immune system. If Figure 5B and D involve Tumor Mutation Burden (TMB), there is no significant difference in TMB between the groups with high and low GPNMB expression. This means GPNMB does not affect how well immunotherapy works by changing the number of tumor mutations; it acts by regulating pathways related to immune checkpoints. Scatter plots in Figure 5E and F further confirm the linear relationships between GPNMB and immune indicators. Altogether, these findings support the idea that “high GPNMB expression can create an environment in the tumor that suppresses the immune system, making immunotherapy less effective”. They also provide clues for future research on using GPNMB as a marker to predict whether immunotherapy will work and to develop targeted treatments.
3.2.3. Immune Cell Infiltration Correlation
This set of Figure 6A-D explores the relationship between GPNMB expression and the tumor immune microenvironment. Figure 6A uses violin-box plots to show differences in three immune-related scores (StromalScore, ImmuneScore, ESTIMATEScore) between groups with low and high GPNMB expression. Figure 6B is a grouped scatter plot, displaying the infiltration levels of 28 immune cell subsets in groups with low and high GPNMB expression. Figure 6C is a correlation bar chart, ranking the correlation strength between GPNMB and 28 immunotherapy targets. Figure 6D is a partial correlation scatter plot, analyzing the linear association between GPNMB expression and the infiltration levels of 7 immune cell types while controlling for tumor purity.
GPNMB expression is closely associated with the composition and function of immune cells in the tumor microenvironment. From Figure 6B, high GPNMB expression selectively regulates the infiltration of immune cell subsets. For example, it may inhibit the infiltration of effector T cells and recruit immunosuppressive cell subsets such as regulatory T cells, thereby facilitating tumor immune evasion and immune surveillance. Figure 6D further confirms this. After adjusting for tumor purity, GPNMB shows different correlation patterns with various immune cells. It may promote the infiltration of immunosuppressive cells, like macrophages, and inhibit the infiltration of anti-tumor immune cells such as CD8 + T cells. These changes indicate that GPNMB can reshape the tumor immune microenvironment. By altering the composition of immune cell subsets, it creates an immunosuppressive environment, which may reduce the efficacy of immunotherapy. In summary, GPNMB affects the anti-tumor immune response by regulating the infiltration and function of immune cells, and it has potential as a marker for predicting immunotherapy outcomes.
3.3. IHC Validation: GPNMB Expression in Clinical GC Tissues
3.3.1. Expression Difference Between GC and Adjacent Tissues
(1) Staining intensity scoring: 0 (negative), 1 (1+), 2 (2+), 3 (3+).
(2) Staining positivity rate scoring: Raw percentage (0–100%).
(3) Total score: Calculated as the product of the staining intensity score and the staining positivity rate score.
(4) Survival analysis grouping: Patients were stratified into the low-expression group (GPNMB cytoplasmic total score ≤ 50) and high-expression group (GPNMB cytoplasmic total score > 50); multiple scoring methods and cutoff values were tested but showed no prognostic significance, so the median value was selected as the cutoff.
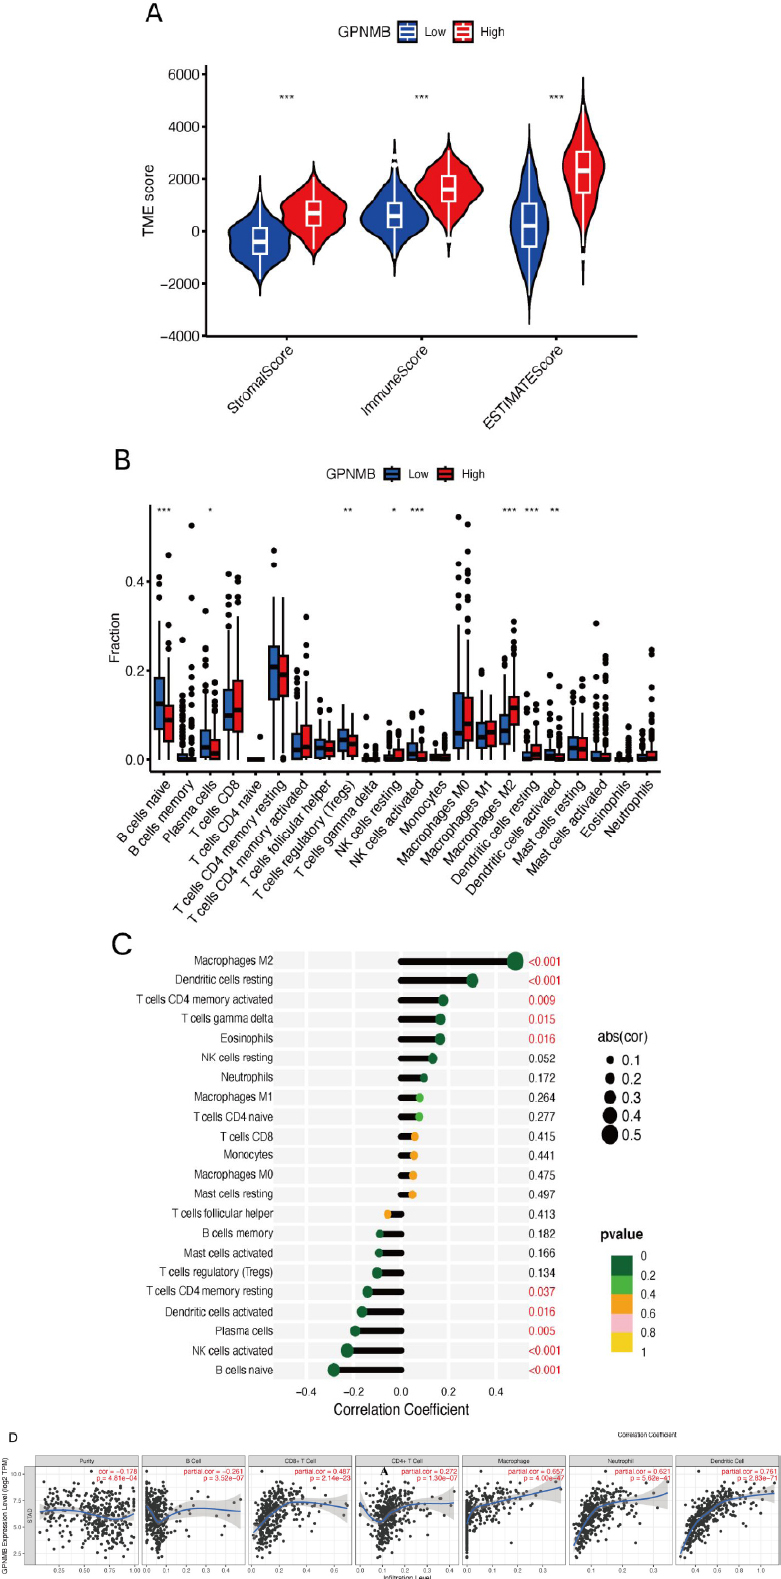
The relationship between GPNMB expression and the tumor immune microenvironment. ((A) Stromal/Immune/ESTIMATEScores; (B-D) Immune cell infiltration (28 subsets) and target correlations).
IHC staining (Figure 7A-D) showed that GPNMB was mainly expressed in the cytoplasm of GC cells: non-tumor tissues mostly had a score of 0, while GC tissues had scores of 1-3. Paired analysis (Figure 7E and Table 1) confirmed GPNMB IHC scores were significantly higher in GC tissues (57 ± 53) than adjacent non-cancerous tissues (38 ± 39, p = 0.018), consistent with bioinformatics results. The results show that the IHC scores for GPNMB in gastric cancer tissues are significantly higher than those in adjacent tissues, and the difference is statistically significant (P < 0.05), which further quantifies the trend of high expression of GPNMB in gastric cancer.
| - | Adjacent Tissue | Cancer | P-value |
|---|---|---|---|
| IHC score (paired) | 38±39 | 57±53 | 0.018 |
Note: * Statistically significant (p < 0.05).
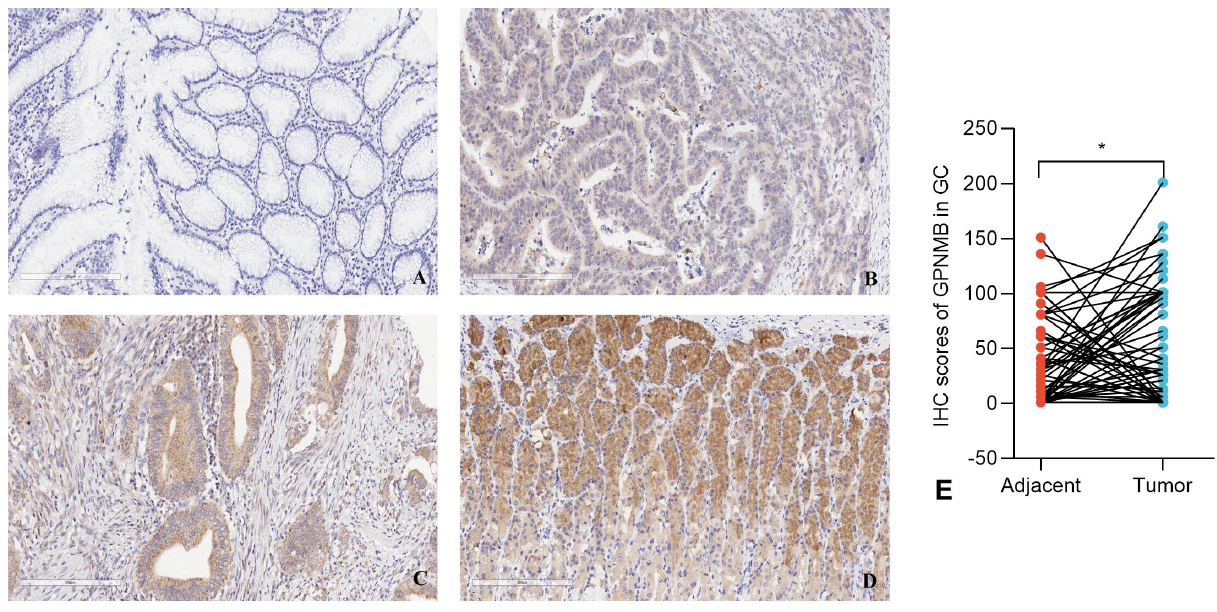
GPNMB shows differential expression in gastric cancer tissues and adjacent tissues (200×).
3.3.2. Association Between GPNMB Expression and Clinicopathological Features
From Table 2, this study concludes that:
a) Demographic characteristics (gender, age), surgical and tumor features (surgical approach, tumor location, size, pathological grade), tumor size and lymph node metastasis (T stage, N stage), as well as molecular and infection indicators (HER2 expression, HP infection, CEA level) showed no statistically significant differences in distribution between the GPNMB low-expression and high-expression groups (p > 0.05).
b) Although statistical significance was not reached for certain features, numerical trends were observed: in terms of gender, the proportion of females in the GPNMB high-expression group (36.4%) was higher than that in the low-expression group (17.5%), approaching statistical significance (p = 0.068); regarding pathological grade, the proportion of poorly differentiated (Grade III) tumors in the GPNMB high-expression group (53.1%) was slightly higher than that in the low-expression group (38.9%).
c) The proportion of patients with stage M1 in the GPNMB high-expression group (24.2%) was significantly higher than that in the low-expression group (5.0%), with a statistically significant difference (χ2=5.663, p = 0.017 < 0.05), suggesting that GPNMB may be associated with the process of distant metastasis in gastric cancer.
| - | Variables | GPNMB Expression | χ2/U | p-value | |
|---|---|---|---|---|---|
| Low | High | ||||
| Age (year) | Continuous | 62(49,68) | 60(53,68) | 635 | 0.777 |
| Size (cm) | Continuous | 3.5(3.0,4.5) | 4.0(3.0,5.0) | 552 | 0.225 |
| Sex | - | - | - | 3.342 | 0.068 |
| Male | 33(82.5) | 21(63.6) | - | - | |
| Female | 7(17.5) | 12(36.4) | - | - | |
| Surgical Approach | - | - | - | 0.083 | 0.773 |
| Total gastrectomy | 4(10.0) | 4(12.1) | - | - | |
| Partial gastrectomy | 36(90.0) | 29(87.9) | - | - | |
| Location | - | - | - | 1.681 | 0.195 |
| Cardia and fundus | 8(20.0) | 3(9.1) | - | - | |
| Body, antrum, and angle | 32(80.0) | 30(90.9) | - | - | |
| Grade | - | - | - | 1.384 | 0.239 |
| I/II | 22(61.1) | 15(46.9) | - | - | |
| III | 14(38.9) | 17(53.1) | - | - | |
| HER2 | - | - | - | 1.106 | 0.293 |
| Negative | 36(92.3) | 27(84.4) | - | - | |
| Positive | 3(7.7) | 5(15.6) | - | - | |
| Hp | - | - | - | 0.864 | 0.352 |
| Negative | 13(44.8) | 16(57.1) | - | - | |
| Positive | 16(55.2) | 12(42.9) | - | - | |
| T stage | - | - | - | 0.572 | 0.450 |
| T1+T2 | 9(22.5) | 10(30.3) | - | - | |
| T3+T4 | 31(77.5) | 23(69.7) | - | - | |
| N stage | - | - | - | 0.301 | 0.583 |
| N0 | 12(30.0) | 8(24.2) | - | - | |
| N1+N2+N3 | 28(70.0) | 25(75.8) | - | - | |
| M stage | - | - | - | 5.663 | 0.017 |
| M0 | 38(85.0) | 25(75.8) | - | - | |
| M1 | 2(5.0) | 8(24.2) | - | - | |
| TNM stage | - | - | - | 1.248 | 0.264 |
| Ι+II | 21(52.5) | 13(39.4) | - | - | |
| III+IV | 19(47.5) | 20(60.6) | - | - | |
| CEA (ng/L) | Continuous | 2.0(1.1,3.3) | 2.3(1.5,6.4) | 330 | 0.287 |
Note: * Statistically significant (p < 0.05).
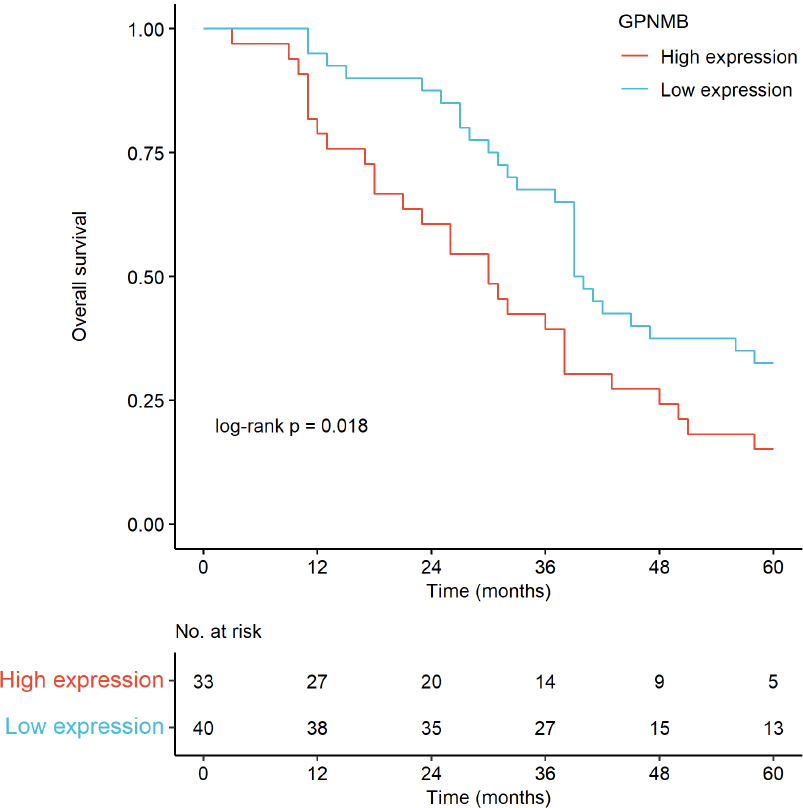
Survival curves were plotted using the Kaplan - Meier method and compared by the Log-rank test.
3.4. Prognostic Value of GPNMB
3.4.1. Survival Analysis
3.4.1.1. IHC-based Survival
Kaplan-Meier curves (Fig. 8) showed that high GPNMB expression was associated with significantly shorter overall survival (log-rank p = 0.018); median OS was shorter in the high-expression group than the low-expression group.
4. DISCUSSION
4.1. Interpretation of Key Findings
In this study, we found that GPNMB is upregulated in GC, which is consistent with previous bioinformatics analyses and IHC results. This strongly suggests its role as an oncogenic marker in GC. High GPNMB expression levels in GC patients are correlated with poor clinical outcomes, aligning with its well-documented function of promoting tumor progression in other cancers such as breast, lung, and pancreatic cancers [27-29]. In terms of clinicopathological features, the significant association between high GPNMB expression and advanced GC stage suggests that GPNMB may contribute to the development of more aggressive GC phenotypes, potentially by promoting processes like invasion and metastasis.
4.2. Mechanistic Insights
Based on the existing literature and our preliminary data, several potential mechanisms by which GPNMB may regulate GC progression have been proposed [12, 30]. In other tumors, GPNMB has been shown to modulate signaling pathways such as the PI3K/AKT/mTOR and MAPK pathways [31-33]. These pathways play crucial roles in cell proliferation, survival, and motility, and it is likely that GPNMB exerts its oncogenic effects in GC through similar mechanisms [22, 34]. Additionally, our data suggest a correlation between GPNMB expression and immune cell infiltration in the tumor microenvironment. This implies that GPNMB may modulate the tumor microenvironment, perhaps by recruiting immunosuppressive cells like tumor- associated macrophages or regulatory T cells [35]. Such modulation could create an immune-privileged niche that promotes tumor growth and evasion of the host immune system [5, 36, 37]. Currently, our research team is conducting in-vitro and in-vivo experiments to further explore the impact of GPNMB on the prognosis of gastric cancer, aiming to clarify these potential mechanisms.
4.3. Clinical Implications
The significant correlation between GPNMB expression and poor prognosis in GC patients indicates its potential as a prognostic biomarker. By assessing GPNMB expression levels, clinicians may be able to stratify GC patients into different risk groups, which can help with personalized treatment planning. Moreover, targeting GPNMB holds great therapeutic potential [38, 39]. Antibody-drug conjugates like glembatumumab vedotin, which specifically target GPNMB, have shown promise in preclinical studies and are currently being explored in clinical trials for various cancers [40-42]. Such agents could be repurposed for the treatment of GC, either as monotherapy or in combination with other treatment modalities like chemotherapy or immunotherapy [43].
4.4. Limitations
While multi-cohort validation and IHC integration strengthen our findings, this study has key limitations. First, methods lack sufficient reproducibility details (e.g., bioinformatics normalization and statistical adjustments). Second, survival analyses did not account for major confounders (e.g., adjuvant chemotherapy, MSI/EBV status), limiting confidence in GPNMB’s independent prognostic value. Third, conclusions on GPNMB-mediated immunosuppression/immune escape rely solely on computational estimates of immune infiltration, without functional validation. Future studies addressing these gaps will enhance the robustness and clinical applicability of findings.
CONCLUSION
This study confirms GPNMB is significantly overexpressed in GC via TCGA/GEO bioinformatics analyses and immunohistochemical validation in 73 paired GC/adjacent tissues. High GPNMB expression correlates strongly with advanced M stage, increased distant metastasis, and shortened overall survival-consistent with Fen et al.’s finding that GPNMB overexpression predicts poor GC prognosis. Its reported role in colorectal cancer progression via hypoxia-associated GPNMB+ macrophages suggests a conserved function across gastrointestinal tumors, supporting its utility for clinical risk stratification [44, 45]. Notably, female GC patients showed a higher tendency for GPNMB overexpression, offering a direction for subgroup analyses. The study followed the Sex and Gender Equity in Research guidelines (SAGER) to ensure appropriate inclusion and reporting of sex-related data. With ongoing mechanistic investigations, GPNMB emerges as a reliable independent prognostic biomarker and promising therapeutic target for GC, advancing personalized diagnosis and treatment strategies.
AUTHORS' CONTRIBUTIONS
The authors confirm contribution to the paper as follows: L.C.: Conducted experiments, drafted the manuscript, and performed statistical analyses; Y.Z.: Performed statistical analysis of experimental data and polished the article; D.M.: Responsible for conceptualization, methodology design, supervision, and writing-review & editing; I.S: Handled data curation, formal analysis, and writing-original draft. All authors reviewed and approved the final manuscript.
LIST OF ABBREVIATIONS
| GC | = Gastric cancer |
| GPNMB | = Glycoprotein non-metastatic melanoma protein B |
| ICIs | = Immune checkpoint inhibitors |
| IHC | = Immunohistochemistry |
| OS | = Overall survival |
| HR | = Hazard ratio |
| STAD | = Stomach adenocarcinoma |
| TMB | = Tumor mutation burden |
ETHICS APPROVAL AND CONSENT TO PARTICIPATE
Ethical approval was obtained from the Ethics Committee of Shanghai Biotechnology Co., Ltd, China with the approval number: YB M-05-01.
HUMAN AND ANIMAL RIGHTS
All procedures performed in studies involving human participants were in accordance with the ethical standards of institutional and/or research committee and with the 1975 Declaration of Helsinki, as revised in 2013.
CONSENT FOR PUBLICATION
Written informed consent was obtained from all human participants, covering the use of their tissue samples and clinical data for the study and the publication of relevant research results.
AVAILABILITY OF DATA AND MATERIALS
The datasets analyzed are available in the TCGA repository (https://portal.gdc.cancer.gov/) and GEO (https://www.ncbi.nlm.nih.gov/geo/). Research materials and code are available from the corresponding authors [D.M. and I.S.] upon reasonable request.
FUNDING
This study was supported by the Affiliated Hospital of North Sichuan Medical College (Project No. 2024MPZK011) and the Doctoral Research Startup Fund of the Clinical Medical College - Affiliated Hospital, China (Project No. 2023-2GC017).
ACKNOWLEDGEMENTS
The authors would like to thank the Central Laboratory of the Affiliated Hospital of North Sichuan Medical College and Management and Science University (Malaysia) for their support in this study. We also appreciate the technical assistance from the research team involved in data collection and analysis. Special thanks to all participants whose data contributed to this research.

