
Benchmarking Somatic Copy Number Variation Detection Tools in Cancer Genomes
Abstract
Introduction
The accurate detection of somatic Copy Number Variations (CNVs) is a challenging task in cancer genomics. This study addresses the significant variability in performance and the lack of consensus among computational tools for somatic CNV calling.
Methods
We conducted a comprehensive benchmark evaluation of four widely used tools - CNVkit, Sequenza, Facets, and ASCAT. Their performance was assessed in terms of recall, precision, reproducibility, and inter-tool concordance using an orthogonally validated real-world dataset derived from the HCC1395 cell line.
Results
Our analysis revealed considerable differences in tool performance. Facets and Sequenza showed the most balanced accuracy and the highest reproducibility. In contrast, we observed poor consensus among tools, particularly for amplifications, where pairwise concordance values were frequently below 0.6. CNVkit showed high sensitivity for deletions but exhibited critically low and unstable performance for amplifications.
Discussion
The results show that tool selection is a primary source of variability in CNV studies, which can significantly impact downstream biological interpretation. The high discordance rates, especially for amplifications, highlight the inherent limitations and the risk of false negatives when relying on a single algorithm.
Conclusion
We conclude that for reliable somatic CNV detection, tools such as Facets or Sequenza are required. We also recommend adopting a consensus-based approach to reduce error rates and improve the quality of findings from individual algorithms.
1. INTRODUCTION
Somatic Copy Number Variations (CNVs) - comprising regional deletions, amplifications, and complex rearrangements - are common in cancer genomes and drive tumorigenesis through the inactivation of tumor suppressor genes and the activation of oncogenes [1-3]. The accurate detection of these alterations is important for understanding cancer biology, identifying prognostic biomarkers, and guiding therapeutic decisions [4-6]. The advent of high-throughput Next-Generation Sequencing (NGS) has greatly improved the detection of somatic CNVs, enabling genome-wide profiling at a resolution higher than that of traditional microarray-based methods [7, 8]. While Whole-Genome Sequencing (WGS) provides the most comprehensive view, Whole-Exome Sequencing (WES) has emerged as the predominant technology in both clinical oncology and large-scale cancer research studies due to its significantly lower cost and efficient targeting of protein-coding regions, where the most clinically actionable alterations are often located [9, 10]. As a result, computational tools have increasingly been developed and validated for WES data [11, 12]. However, the inherent characteristics of exome sequencing - including uneven capture efficiency, off-target reads, and a highly fragmented target landscape - introduce challenges that can affect CNV detection accuracy [13, 14]. Unlike the detection of Single-Nucleotide Variants (SNVs), the computational inference of CNVs from WES data remains difficult due to the inherent noise in read-depth data, biases in library preparation, and hybridization [15]. These challenges are further compounded in tumor samples by prevalent issues such as tumor purity, intra-tumor heterogeneity, and tumor-specific aneuploidy, which distort copy number signals and complicate analysis [16-18]. Therefore, careful evaluation of analytical tools in the context of tumor WES is needed to ensure reliable and reproducible results.
While the accuracy of tools for detecting germline CNVs has been extensively benchmarked [19-21], comprehensive comparative studies focusing specifically on somatic CNV detection in tumor samples remain scarce. One notable study [22] evaluated tools including ADTEx [23], CONTRA [24], cn.MOPS [25], ExomeCNV [26], and VarScan 2 [27], showing that their sensitivity was low (less than 85%), while their specificities did not exceed 92%. Since the publication of that study, a new generation of tools - such as CNVkit [28], Sequenza [29], Facets [30], and ASCAT [31] - has been developed, promising improved performance through more sophisticated statistical models. Therefore, a critical evaluation of these modern analytical tools on real-world somatic WES data remains an important and timely task for bioinformatics in cancer genomics. The HCC1395/ HCC1395 BL cell line pair is well-suited for such a benchmarking study, providing a well-characterized benchmark with a known set of orthogonally validated somatic variants and a matched normal control derived from the same patient. This model enables a controlled assessment of tool performance against a reliable ground truth [32, 33].
Here, we performed a systematic comparative analysis of four widely used somatic CNV detection tools. Our evaluation framework utilized an orthogonally validated real-world benchmark derived from the HCC1395/ HCC1395 BL cell line pair. This approach allowed us to assess key performance metrics, including recall (sensitivity), precision (specificity), technical reproducibility across replicates, and inter-tool concordance. This study evaluates tool performance on whole-exome sequencing data, measures consensus between algorithms, and assesses result stability. We also identify the most reliable approaches and propose a consensus-based strategy for improving detection reliability. This work aims to improve the reproducibility of copy number variation studies in cancer genomics.
2. MATERIALS AND METHODS
2.1. Reference Data Processing
To evaluate the performance of CNV callers, we utilized a publicly available benchmark dataset from the study by Fang et al. [32], based on the highly aneuploid HCC1395 triple-negative breast cancer cell line and its matched normal control (HCC1395 BL B-lymphocytes). This dataset has a validated ground truth for somatic variants, established through orthogonal methods including microarrays, PCR, and single-cell sequencing. The final benchmark set comprises 1,788 structural variants (717 deletions, 230 duplications, 551 insertions, 133 inversions, 146 translocations, and 11 breakpoints). The data consist of 21 Whole-Genome Sequencing (WGS) technical replicates (SRA: SRP162370) generated across multiple sequencing centers, allowing for the assessment of tool robustness against technical variability. We downloaded the raw FASTQ files for analysis for the following samples: SRR7890850 (WES_LL_T_1), SRR789 0851 (WES_LL_N_1), SRR7890874 (WES_IL_N_1), SRR78 90876 (WES_FD_T_2), SRR7890877 (WES_FD_T_3), SRR7890 878 (WES_FD_N_3), SRR7890881 (WES_FD_ N_2), SRR7890883 (WES_IL_T_1), SRR7890918 (WES_EA _T_1), SRR7890919 (WES_EA_N_1).
We processed the raw sequencing data uniformly. Read quality was assessed using FastQC (v0.12.0) [34]. Adapter trimming and quality filtering were performed with fastp (v0.23.4) [35] using a sliding window of 4 bp (required quality Q20), removing reads shorter than 70 bp. Filtered reads were aligned to the GRCh38 reference genome using BWA-MEM (v0.7.17) [36].
2.2. CNV Calling Tool Selection
Tools were selected for comparison based on the following criteria. Each tool had to be specifically designed for somatic CNV detection, be widely adopted within the research community as evidenced by a citation count exceeding two hundred, and have been actively maintained by its developers since at least 2018. Based on these criteria, four tools were selected: CNVkit [28], Sequenza [29], Facets [30], and ASCAT [31]. All tools were run with default parameters as recommended by their developers. A comparative summary of the key technical features, requirements, and methodological approaches of the four evaluated tools is provided in Table 1.
| Tool | Core Algorithm | Required Input (Tumor-Normal) | Key Parameters / Features | Primary Strengths |
|---|---|---|---|---|
| CNVkit | Circular Binary Segmentation (CBS) on normalized read depth ratios. | BAM | -Method (hybrid, WGS, amplicon), bin size, segmentation. | Fast, flexible for various assay types (WES, panels) |
| Sequenza | Bayesian model to estimate cellularity, ploidy, and copy number jointly. | BAM | Cellularity and ploidy estimation, allele-specific analysis. | Robust joint estimation of purity/ploidy |
| Facets | Allele-specific segmentation using log-odds ratio and allele frequencies. | BAM | Cval, min.nhet, snp.nbhd size. | Allele-specific calls, handles low purity well |
| ASCAT | Allele-specific segmentation modeling raw allele counts (NGS). | BAM | gamma (segmentation penalty), penalty for non-clonal CNAs. | Allele-specific, designed for aneuploid tumors, robust to normal contamination. |
2.3. Comparative Analysis Framework
We wrote a custom Python script to standardize and compare the different output formats of the selected CNV calling tools. While each tool employs a distinct output structure, all reports contain the fundamental information required for analysis: chromosomal location and estimated copy number value. For comparison, the reference genome was partitioned into consecutive 100-base pair bins. Each bin was annotated with a copy number value based on its overlap with the CNV segments called by a given tool.
Bins overlapping a reported deletion were assigned a value of 1, while those overlapping an amplification were assigned the reported value (e.g., 3 or higher). Bins with no overlapping CNV call or falling outside exonic regions were assigned a null value.
The comparative analysis was performed by merging the binned data from any two result sets intended for comparison, such as a tool's output versus the validated benchmark or the outputs of two different tools. All rows containing a null value in either of the two compared columns were removed from the merged dataset, so the analysis only covered regions where both sources provided a call. For the evaluation of specific variant types, the dataset was further filtered prior to metric calculation. Rows with a copy number greater than two were isolated for the analysis of amplifications, while rows with a copy number less than two were isolated for the analysis of deletions. This binned dataset was used for all subsequent evaluations.
Tool performance was evaluated using sensitivity, specificity, reproducibility, and concordance metrics, calculated separately for deletions and amplifications. Sensitivity, or the true positive rate, was defined as the proportion of benchmark variants correctly identified by a tool (TP / [TP + FN]). Specificity, representing the true negative rate, was calculated as the proportion of true negative calls correctly identified (TN / [FP + TN]). Reproducibility was assessed as the proportion of bins with identical copy number calls across multiple technical replicates of the same sample, reflecting the technical consistency of a single tool. Concordance was measured as the proportion of bins with identical copy number calls generated by different tools for the same sample, indicating the level of consensus between methods. All metrics were derived from the standardized binned dataset to ensure a uniform comparison.
3. RESULTS
3.1. Recall and Precision on the Real Data Cell Line Benchmark
Evaluation against the orthogonally validated ground truth from the HCC1395 cell line (5 technical replicates: FD2, FD3, EA, IL, LL) showed clear differences between the tools (Fig. 1). CNVkit demonstrated the highest recall for deletions, with a mean recall value of 0.930, indicating good detection of true loss-of-copy events. However, its amplification recall was lower (mean recall = 0.538), suggesting a variant-type bias in its algorithm. Facets and Sequenza performed best for detecting amplifications, achieving high mean recall values of 0.851 and 0.851, respectively. Facets had the most balanced and stable profile overall, maintaining robust recall for both deletions (mean = 0873) and amplifications (mean = 0.851) with consistently low variability (std ~ 0.043–0.017), suggesting more reliable detection across alteration types. ASCAT had low sensitivity, especially for amplifications (mean = 0.454, std = 0.066), while its performance for deletions (mean = 0.732, std = 0.105) was also suboptimal compared to the leading tools. This poor detection of validated events makes ASCAT an outlier in this evaluation.
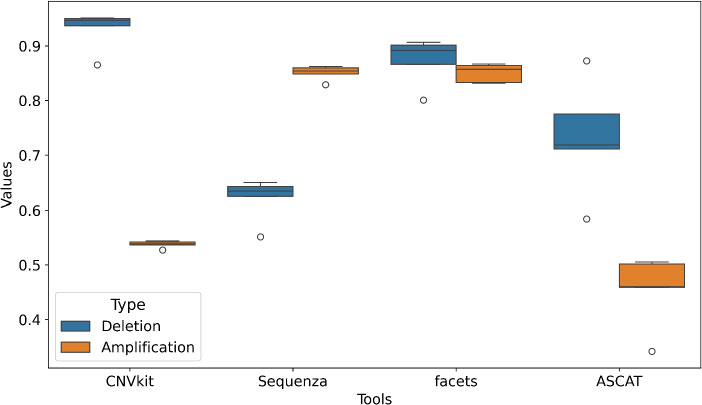
Comparative recall of CNV detection tools on the HCC1395 cell line benchmark, with tool names on the x-axis and recall values on the y-axis. Box plots illustrate the distribution of recall values for each computational tool (n = 4) in detecting deletions (blue) and amplifications (orange) against an orthogonally validated ground truth. The central mark within each box represents the median, the box extends to the 25th and 75th percentiles, and the whiskers show the range of the data. The plot highlights the prevalent performance gap, with all tools demonstrating superior detection efficacy for deletions compared to amplifications. Furthermore, it reveals substantial differences in both the accuracy and consistency (variance) of somatic CNV calls between algorithms.
A consistent trend across all tools was the superior detectability of deletions compared to amplifications, with the maximum observed recall being 0.930 versus 0.851, respectively. This suggests algorithmic or methodological difficulties in identifying gain-of-copy events from exome data.
Regarding precision, all tools showed high specificity for both variant types, well above their recall values (Fig. 2). Facets and CNVkit led in precision for deletions (means of 0.994 and 0.965, respectively), though CNVkit's higher variability (std = 0.038) indicated less consistent reliability. For amplifications, CNVkit, Sequenza, and Facets all achieved near-perfect precision (means > 0.996), indicating that their amplification calls are generally reliable, even if their sensitivity to detect all such events varies. High precision across tools indicates that false positives are not the main problem; rather, the challenge is capturing all true events, especially amplifications.
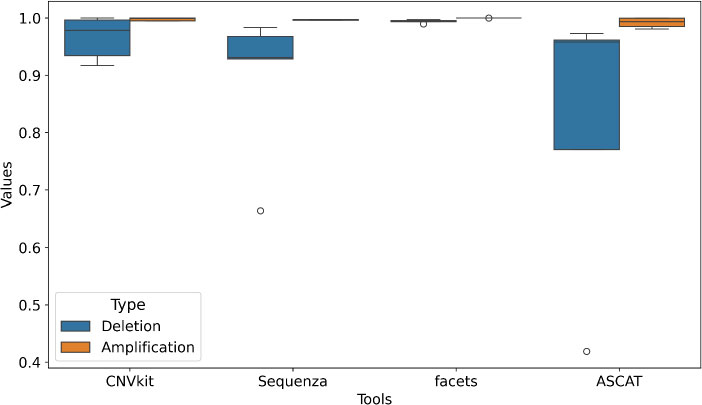
Comparative precision of CNV detection tools on the HCC1395 cell line benchmark, with tool names on the x-axis and precision values on the y-axis. Box plots display the distribution of precision values for each tool (n = 4) in validating deletions (blue) and amplifications (orange) against an orthogonal ground truth set. The central mark indicates the median, the box represents the interquartile range (25th to 75th percentiles), and the whiskers show the data range excluding outliers. Tools are arranged by their median precision for deletions. The plot demonstrates uniformly high precision across most tools for both variant types, indicating a low false positive rate. Notably, the consistency (variance) of precision is significantly higher than that observed for recall, suggesting that while tools may miss true events, their positive calls are highly reliable.
3.2. Reproducibility Across Technical Replicates
While sensitivity and specificity measure accuracy against a known ground truth, they do not capture the consistency of a tool's output across technical replicates. A good algorithm should produce reproducible calls regardless of technical sequencing variations. To assess this reproducibility, we analyzed five distinct whole-exome sequencing samples (FD2, FD3, EA, IL, LL) derived from the same HCC1395 cell line. For each tool, we compared CNV calls between pairs of these technical replicates (e.g., FD2 vs. FD3) to quantify the proportion of overlapping genomic bins with identical ploidy assignments. This metric reflects the tool's stability and technical reliability in repeated experiments.
For deletions, all tools demonstrated high and consistent reproducibility, with mean scores ranging from 0.824 (ASCAT) to 0.941 (Sequenza) (Fig. 3). Sequenza and Facets showed particularly strong agreement across replicates for this variant type. Reproducibility for amplifications, however, varied considerably between tools. (mean = 0.541, std = 0.035), meaning its copy number gain calls were unstable across replicates. Sequenza and Facets, on the other hand, maintained high reproducibility for amplifications (means of 0.969 and 0.974, respectively), with low variability. ASCAT showed intermediate but robust performance for amplifications (mean = 0.843). This shows that some tools (Sequenza, Facets) produce stable call sets regardless of technical noise, while others, particularly CNVkit, are inconsistent for amplification detection, which limits their use in settings that require reliable results.
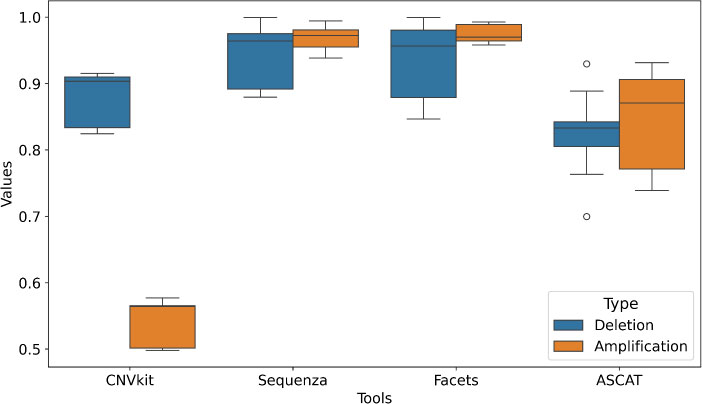
Technical reproducibility of somatic CNV detection tools. The x-axis lists the different computational tools, while the y-axis shows the corresponding reproducibility values. Box plots illustrate the distribution of reproducibility scores for each tool across five technical replicates (FD2, FD3, EA, IL, LL) of the HCC1395 cell line, stratified by variant type: deletions (blue) and amplifications (orange). Reproducibility was calculated as the proportion of identical CNV calls between pairs of technical replicates for each tool. The central mark represents the median, the box extends to the 25th and 75th percentiles, and the whiskers show the range of the data. The plot demonstrates that Facets and Sequenza show superior stability compared to CNVkit and ASCAT.
Beyond absolute accuracy, consensus between different bioinformatic tools is an important metric, since agreement between independent methods increases confidence in a call set. To quantify this, we calculated pairwise concordance - defined as the proportion of identical CNV calls - for every possible pair of tools across all samples. For each tool, its overall concordance was characterized by the distribution of its pairwise agreement values with all other tools, serving as a measure of its overall agreement with other tools.
Inter-tool concordance differed substantially and was also affected by variant type (Fig. 4). For deletions, Facets demonstrated the highest median concordance (0.768 ± 0.086), closely followed by ASCAT (0.731 ± 0.090), CNVkit (0.712 ± 0.125), and Sequenza (0.710 ± 0.089). This relatively tight clustering indicates a stronger consensus among tools on deletion calls. For amplifications, concordance was lower and more variable across all tools. CNVkit and ASCAT showed the poorest agreement with the field, with mean concordance values of 0.508 (± 0.066) and 0.521 (± 0.089), respectively. Sequenza and Facets achieved higher consensus for amplifications (0.698 ± 0.200 and 0.691 ± 0.200, respectively), though the higher standard deviations show that their agreement with other tools was inconsistent and depended on the specific pairwise comparison.
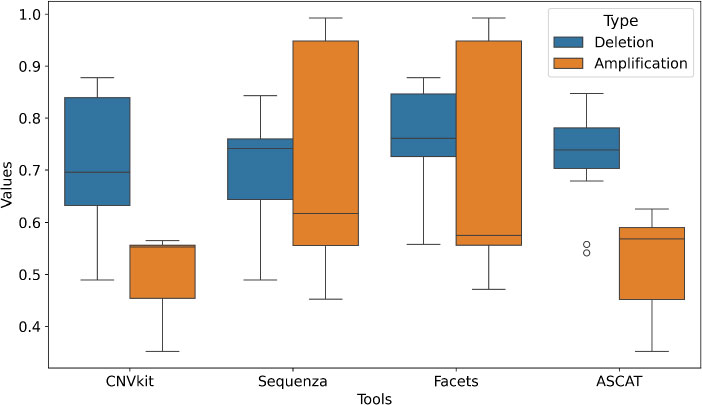
Inter-tool concordance in somatic CNV detection. The x-axis lists the different computational tools, while the y-axis shows the corresponding concordance values. Box plots represent the distribution of pairwise concordance values for each tool compared against all other tools in the study. Concordance was calculated as the proportion of identical CNV calls between tool pairs across all samples, separately for deletions (blue) and amplifications (orange). The central mark indicates the median; the box shows the interquartile range (25th to 75th percentiles), and whiskers extend to the data range excluding outliers. The plot reveals significantly higher consensus among tools for deletion calls compared to amplifications. Facets demonstrates the highest overall concordance, indicating its calls are most consistent with other tools, while CNVkit shows the lowest agreement, particularly for amplifications, highlighting its divergent calling strategy.
The analysis revealed that inter-tool concordance is not random but follows distinct, reproducible patterns based on algorithmic methodology, forming clear “strategic alliances” between tools (Fig. 5). For deletions, the highest and most stable agreement was consistently observed between Sequenza and ASCAT (mean concordance across samples: ~0.775) and between CNVkit and Facets (mean concordance: ~0.833) or data processing for detecting copy number losses. Conversely, the lowest agreement for deletions was repeatedly found between CNVkit/ASCAT and Facets/ASCAT pairs, showing that these tools interpret the data differently.
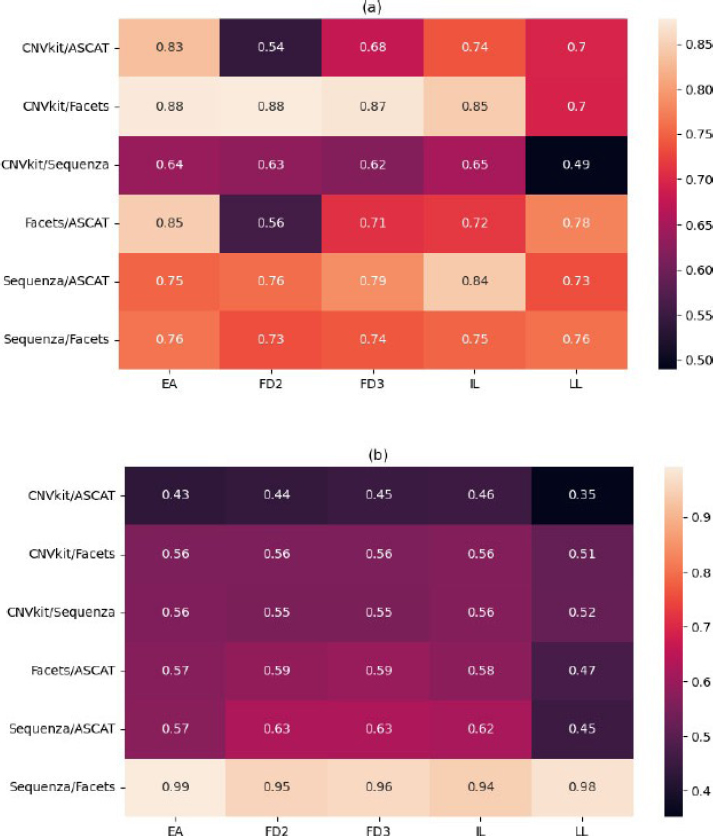
Pairwise concordance analysis of CNV detection tools across samples. Heatmaps depict the level of agreement between tool pairs for (a) deletions and (b) amplifications in five technical replicates (FD2, FD3, EA, IL, LL) of the HCC1395 cell line. The y-axis shows the list of tool pairs, and the x-axis shows the five sample replicates. Concordance was calculated as the proportion of identical CNV calls between tools for each sample. The analysis reveals strong, stable alliances between specific tools: Sequenza and ASCAT show high consensus for deletions, while Sequenza and Facets demonstrate near-perfect agreement for amplifications. In contrast, CNVkit exhibits consistently low concordance with other tools, particularly for amplifications. Sample LL emerges as an outlier, showing reduced concordance across most tool pairs, indicating sample-specific analytical challenges.
For amplifications, the pattern was more pronounced. The pair Sequenza/Facets demonstrated near-perfect concordance (mean: 0.965 ± 0.018), indicating very similar calling of copy number gains by these two tools. CNVkit showed persistently poor agreement with all other tools for amplifications, with its concordance values never exceeding 0.565 and dropping as low as 0.352 with ASCAT in the LL sample. Similarly, ASCAT's agreement with other tools for amplification was consistently low. CNVkit and ASCAT are thus outliers in amplification detection, while Sequenza and Facets form a high-consensus pair.
4. DISCUSSION
This study presents a systematic performance evaluation of five widely used somatic CNV detection tools - CNVkit, Sequenza, Facets, and ASCAT - using both simulated data and a real, orthogonally validated cell line benchmark. Our analysis extends beyond conventional metrics of sensitivity and specificity to critically assess inter-tool concordance and technical reproducibility, providing a multi-faceted view of the landscape of somatic CNV calling from exome sequencing data. The complete metrics for all tools are listed in Supplementary Material.
The key finding of our analysis is the lack of consensus among the algorithms tested, which is in line with earlier benchmarking studies in both WGS and WES contexts [19-22]. The pairwise concordance analysis reveals that the choice of bioinformatic tool is a major determinant of the resulting CNV call set. Tools do not simply make random errors; they make systematically different errors based on their underlying algorithms, forming distinct “call set ecosystems”. The near-perfect agreement between Sequenza and Facets for amplifications suggests they respond similarly to the same genomic signals, while the strong alliance between Sequenza and ASCAT for deletions points to a shared methodological foundation for loss detection. Conversely, the isolation of CNVkit and ASCAT as outliers, particularly for amplifications, underscores a fundamental divergence in their analytical approaches. In practice, the biological conclusions from a CNV analysis can differ substantially depending on the tool used. A researcher using Sequenza and Facets may confidently report a set of amplifications, while another using CNVkit on the same data may miss them entirely or label them as false positives. The lack of a unified standard makes it harder to compare results across studies and meta-analyses.
Our results quantify a known challenge: the detection of amplifications is more difficult and less reliable than deletion detection [1, 19]. All tools showed higher sensitivity, specificity, and reproducibility for deletions. This disparity can be attributed to several factors. Amplifications often have more complex structures (e.g., focal amps vs. broad gains), and their read-depth signal can be confounded by factors like mappability and GC bias more severely than the signal from deletions. Furthermore, the statistical models in some tools may be inherently better tuned for detecting losses. The low and unstable performance of CNVkit for amplifications, in both sensitivity and concordance, suggests a weakness in its gain-detection model that users should keep in mind.
The performance ceiling observed for amplification calling (F1-score < 0.9 across all tools, Fig. 1) likely has several causes. First, the precise genomic boundaries of amplification events, especially focal amplifications, are often ambiguous in short-read sequencing data due to mapping uncertainties and the fragmented nature of exome capture, leading to discordant segment boundaries between tools. Second, the signal from copy number gains is more susceptible to confounding by tumor microenvironment factors such as non-uniform tumor cell purity, stromal contamination, and intra-tumor heterogeneity, which dilute the allelic fraction and read-depth signal. Third, the “ground truth” benchmark itself, while orthogonally validated, may have limitations in resolving complex or low-level amplifications, creating an inherent upper bound for concordance. This ceiling indicates that current algorithms face real limits in amplification sensitivity, and consensus strategies should be used when reporting such events.
Overall, Facets and Sequenza were the most reliable tools in our evaluation. Facets, in particular, showed a good balance between sensitivity and precision for both variant types, along with high technical reproducibility and strong concordance with other leading tools. This makes it a reasonable default choice. Sequenza performed well in amplification detection and reproducibility, showing strong agreement with Facets. While ASCAT showed decent performance for deletions, its poor amplification performance and low concordance limit its utility.
5. STUDY LIMITATION
A key limitation of our study is its focus on a single cell line model. Future studies should aim to validate these findings on primary tumor data, such as from TCGA, although this requires access to controlled raw sequencing files and significant computational throughput.
CONCLUSION
Our study offers practical guidance for somatic CNV detection. We recommend Facets or Sequenza for general use where a balance of accuracy and reliability is needed, and we advise against relying on a single tool. For the highest confidence, particularly in clinical or high-stakes research settings, a consensus approach-prioritizing calls made by multiple, methodologically independent tools like Sequenza/Facets and ASCAT-should be adopted to reduce the error rates of any single algorithm.
AUTHORS’ CONTRIBUTIONS
The authors confirm contribution to the paper as follows: A.V.: Conceptualization; A.V.: Methodology; L.K., A.V.: Software; A.V., M.G.: Validation; L.K.: Formal analysis; L.K.: Investigation; L.K.: Resources; L.K.: Data curation; L.K., A.V.: Writing-original draft preparation; A.V.: Writing-review and editing; L.K., A.V.: Visualization; A.V., M.G.: Supervision; A.V., M.G.: Project administration; M.G.: Funding acquisition. All authors have read and agreed to the published version of the manuscript.
LIST OF ABBREVIATIONS
| NGS | = Next Generation Sequencing |
| CNV | = Copy Number Variation |
| FN | = False Negative |
| FP | = False Positive |
| TN | = True Negative |
| TP | = True Positive |
| WES | = Whole-Exome Sequencing |
| WGS | = Whole-Genome Sequencing |
AVAILABILITY OF DATA AND MATERIALS
The data analyzed are available in the NCBI SRA under the following accessions: SRR7890850, SRR7890851, SRR7890874, SRR7890876, SRR7890877, SRR7890878, SRR7890881, SRR7890883, SRR7890918, and SRR7890 919. https://doi.org/10.1038/s41587-021-00993-6.
FUNDING
The study was supported by the grant for the implementation of the strategic academic leadership program “Priority 2030” in Novosibirsk State University, Russia.
ACKNOWLEDGEMENTS
Declared none.
SUPPLEMENTARY MATERIAL
Supplementary material is available on the publisher’s website along with the published article.
Supplementary material: Comprehensive performance metrics for somatic CNV detection tools. Sheets 1-4 contain raw values for precision, recall, reproducibility, and concordance across all samples and tool pairs. Sheet 5 provides summarized statistics (mean ± standard deviation) for all metrics and tools evaluated in this study.

