
MetRef, an Auto-updatable Database for Reference/representative Genomes and their Complexity Metrics
 Vicente Arnau1 , 2 , 3
Wladimiro Díaz-Villanueva1 , 2 , 3
Andrés Moya1 , 2 , 3
Authors Info & Affiliations
Abstract
Introduction
The use of genomic metrics to evaluate biological complexity is an important area of research in evolutionary biology; however, this area of study has been hindered by the need for high levels of computation and the lack of a uniform method of performing genomic complexity analyses. This research presents an auto-updating web-based application called MetRef (Metrics of Reference Genomes) that provides an interface to standardize and display genomic complexity analyses.
Methods
MetRef uses two key metrics: Genomic Signature (GS), which uses the normalized frequency of k-mers, and Biobit (BB), which is a combination of both the entropic and anti-entropic components. In order to reduce the computational overhead associated with k-mer counting, MetRef includes the specialized tool KMC 3. Additionally, the MetRef application utilizes a multi-layered architectural framework that incorporates Django, PostgreSQL, and Celery/Redis for managing high-quality assemblies from the NCBI RefSeq and Taxonomy databases.
Results
Using KMC 3 resulted in a reduction in processing time for the human genome from 36 hours to 5 minutes. Users can select comparative studies and receive automatic statistical reports that include Pearson correlation matrices, Principal Component Analysis (PCA), and ANOVA testing, with color-blind-friendly palettes.
Discussion
The advantages of MetRef to address two major limitations in genomic complexity research (computational efficiency and lack of uniform procedures) lie within its use of a special-purpose C++ counting engine (KMC 3) for calculating genetic complexities, and through the unification of calculation pipelines. As such, the MetRef removes inconsistencies generated from varying treatments of non-ACGT bases; therefore, all genetic complexities calculated with the same metrics can be compared directly across the entire tree of life.
Conclusion
In addition to these technical advantages, MetRef establishes a solid, scalable base for evolutionary genomics through an architecturally stable structure using Django and Celery / Redis. Furthermore, the system reduces the researcher's workload, providing them with automatically generated statistical reports and previously calculated, versioned data; thus enabling researchers to easily design and perform additional large-scale comparative studies of genetic complexities.
1. INTRODUCTION
The problem of understanding the complex nature of biological complexity from an evolutionary perspective is one of the most important and difficult issues in contemporary biology. The multi-dimensional nature of biological complexity makes it difficult to define and measure complexity, which leads to the need for measurable surrogates of complexity, i.e., genomic complexity. A useful way to assess the complexity of the genome is to view the genome as a message. In this regard, the complexity of a genome can be assessed using the principles of information theory, with the benefit of being able to numerically quantify the complexity of the genome and thereby analyze genomic complexity as a component of the broader biological complexity of species, providing utility in evolutionary studies across species or in inclusive taxonomic groups [1-5].
As a result of this area of study, there have been several metrics developed to quantify the genomic complexity of DNA sequences. Specifically, two of the most commonly used metrics in evolutionary genomics research are Genomic Signature (GS) and Biobit (BB).
Genomic Signature (GS) is a metric of genomic complexity based on the content of k-mers (sub-sequences of length k) within a given genome [6]. Biobit (BB) is conceptualized as a logistical map that balances the entropic and anti-entropic components of a genome [7, 8].
These metrics have been successfully applied to analyze shifts in complexity in specific biological contexts, as in our prior work investigating the evolutionary impact of endosymbiosis on genome complexity [9].
Despite the theoretical value of these metrics [10], their practical application faces two primary challenges. First, the core step of k-mer frequency calculation is computationally intensive for large eukaryotic genomes, which is identified as the major bottleneck. Second, the lack of a complete, published implementation leads to discrepancies in results across research groups due to varied handling of procedural steps (e.g., treatment of non-ACGT bases or the random genome generation process), resulting in non-comparable values.
To address these limitations, this work pursued two main objectives. First, to achieve a robust and efficient calculation pipeline for GS and BB. Second, and most importantly, to develop MetRef (Metrics of Reference Genomes), a centralized, standardized, and constantly updated web application for the management, analysis, and visualization of these complexity metrics alongside key genomic parameters. MetRef unifies metric implemen-tation and curates reference data, providing a ready-to-use platform that streamlines the research flow.
2. MATERIALS AND METHODS
2.1. Genomic Complexity Metrics
GS quantifies the difference between the observed frequency of a k-mer and the expected frequency for a randomly generated genome of the same size. For an alphabet of four characters (DNA, ACGT), and a word size of k characters, there is a maximum of 4k possible k-mers. The value of GS for a given k (GSk) is calculated as follows:
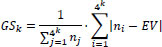
Equation (1). Genomic Signature equation.
Where ni is the observed number of k-mers for a specific sequence, and EV (Expected Value) is used to center the value on the mean, calculated as
 . The final value is normalized by
 To enable comparison between genomes of different lengths. To find the optimal GS value for a genome, a random genome (GSr) of the same size as the study genome (GSg) is generated, and a preliminary score (GSp = GSg - GSr) is calculated starting at k = 2. The procedure is repeated, incrementing k up to 16, at which point the local maxima of GSp are identified and selected.
BB compares a given genome G against an equifrequent random genome of the same length. The metric combines the entropic component (E(G)) and the anti-entropic component (A(G)) of the genome, such that E(G) + A(G) = L(G) (where L(G) = log4(G)). The Biobit score BB(G) is calculated non-linearly as:
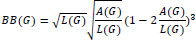
Equation (2). Biobit equation.
The development of MetRef addressed two core technical requirements: achieving efficiency in the base metric calculation and establishing a robust, web-accessible system for data management and analysis.
2.2. Metric Calculation Efficiency
The major computational bottleneck in calculating both GS and BB was the generation and storage of the k-mer frequency tables. Initial optimization attempts using standard Python and Bash proved unsuccessful, confirming the need for a specialized solution.
The successful solution was to integrate the external, specialized tool: KMC 3 [11, 12]. KMC 3 was chosen based on comparative performance and its ability to guarantee exact k-mer counts, unlike other faster tools that provide approximations. KMC 3 uses a RADIX-sort-based algorithm to fragment the input genome into bins for highly parallelized processing [13].
2.3. MetRef System Architecture
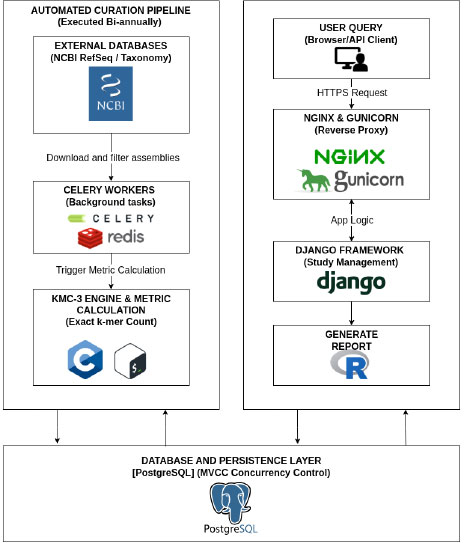
MetRef is a client-server web application implemented with the Django framework [14]. The system's organization is designed for robustness and high concurrency [15, 16].
- Front-end Access: NGINX [17] acts as a reverse proxy, receiving external requests and forwarding them to the application [18].
- Application Server: Gunicorn [19] serves as the WSGI connector, linking NGINX to the Python-based Django application.
- Data Persistence: PostgreSQL [20] is a relational object database, chosen for its efficiency in complex data analysis and its use of MVCC (Multi-Version Concurrency Control) for efficient concurrency management.
2.4. Asynchronous Processing
A critical feature of MetRef is the use of asynchronous task management.
Task Management: Celery [21] manages computationally intensive background operations. This includes the crucial biannual database updates and the asynchronous generation of large genome lists, which would otherwise trigger a timeout for the user.
Broker/Cache: Redis [22] is utilized as the in-memory data store for application caching and as the message broker for Celery [23].
This complete architecture, as shown in Fig. (1), ensures the application is secure, responsive, and capable of efficiently handling large-scale genomic data.
Complete architecture of MetRef.
The goal of MetRef is to collect an extensive number of genomic complexity measures and integrate them into a common, structured framework that can be searched easily.
2.5. Data Source and Curation
MetRef uses RefSeq assemblies found at NCBI [24, 25] to populate its database. The system downloads the RefSeq assembly summary file and then applies several filters in order to use only the data needed for genomic complexity analysis:
- Only include genomes that have been classified as “reference genome” or “representative genome”.
- Exclude genomes that have been specifically excluded from RefSeq (typically due to chimera formation, contamination, fragmentation or size abnormalities).
- Include only high-quality assemblies (either “Chromosome” or “Complete Genome”), since metric calculations are extremely sensitive to either sequencing errors or missing information.
- Focus on Archaea, Bacteria, and Eukaryota, while excluding viruses and organisms without a classification.
- Additional fields that are retrieved from the RefSeq summary file and inserted into both the Genome and Traits tables include: accession, category, assembly_level, group, genome_size, gc_percent, total_gene_count, protein_coding_gene_count, and non_coding_gene_count.
2.6. Taxonomic Integration and Versioning
In addition to providing users with easy-to-use options to select genomes for analysis, MetRef also links genome data with the NCBI Taxonomy Database [26]. To accomplish this integration, MetRef uses the downloaded and processed taxonomy files: merged.dmp, names.dmp, and nodes.dmp.
During the database loading process, for every genome:
The system checks whether the genome's tax_id exists in the Taxon table.
If the tax_id (and its parent taxa up to the Superkingdom level) does not exist, new Taxon records are created recursively. The Taxon table stores the tax_id, parent_tax_id, name, and rank.
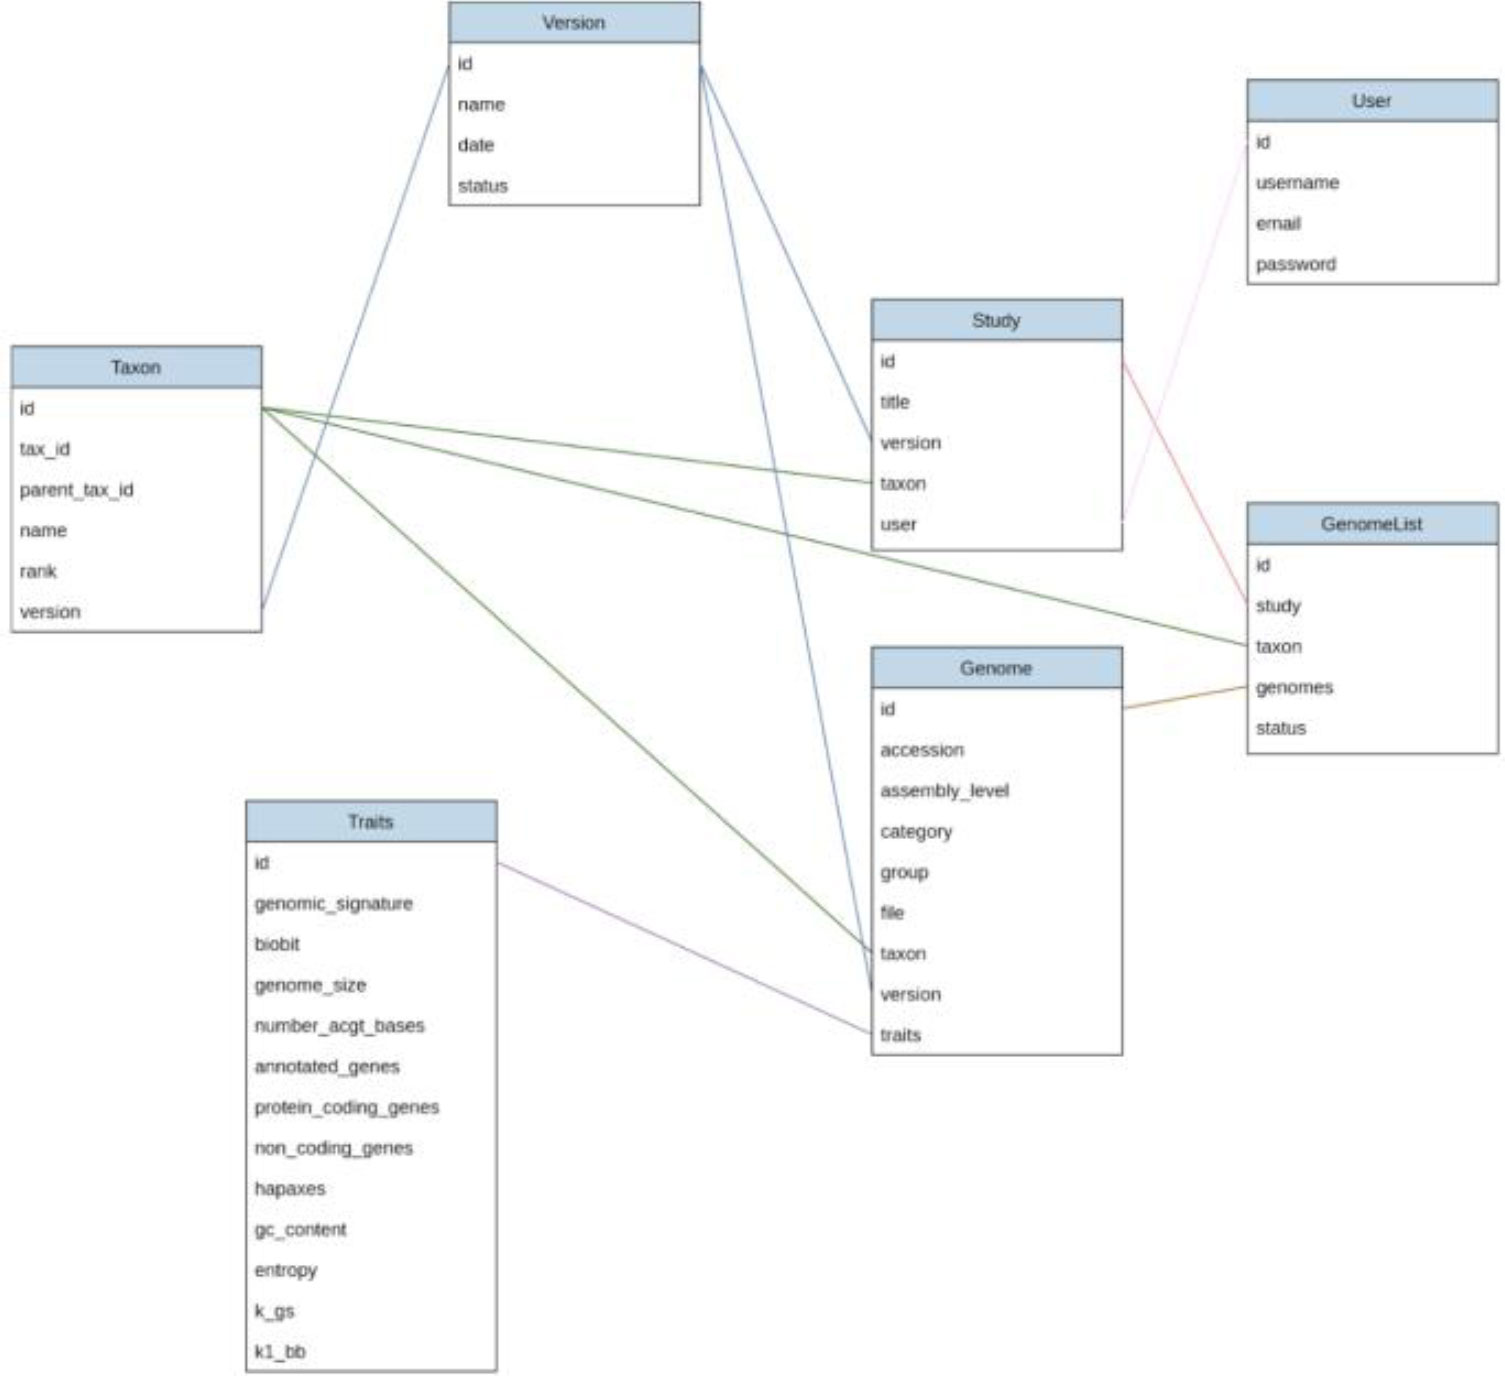
The relational database model is built on several key tables.
- Version: Tracks periodic updates, set at a bi-annual frequency. Maintaining previous versions ensures reproducibility for extending older studies.
- Study: Records user-defined research projects, linking a title, a specific Version, and selected Taxon records to a User.
- GenomeList: The core mapping table. For each selected Taxon, an asynchronous task generates a GenomeList that references all subordinate Genome objects associated with the chosen Version.
The whole relational model is referenced in Fig. (2).
Relational database model of MetRef.
3. RESULTS
3.1. Metric Calculation Efficiency
Integrating KMC 3 into the metric pipeline resulted in a massive reduction in processing time and resource usage: the calculation of BB for the human genome decreased from 36 hours (1 CPU, 150 GB RAM) to just 5 minutes (8 CPUs, 40 GB RAM). This optimization ensured efficient metric calculation and allowed the process to handle compressed genome files directly.
3.2. Study Management
The application interface allows users to create a new Study via a form, specifying a title, a Version, and selecting at least one Taxon. The system enforces that the chosen taxa cannot be parent or descendant taxa of each other, ensuring they represent independent comparative groups. Due to the potential size of the resulting genome list, its generation is handled by a Celery asynchronous task. If the list takes time to populate, a temporary waiting message is shown to the user until the list status is updated.
MetRef provides two core outputs to the user: direct access to the raw, pre-calculated data and an automated statistical analysis report.
3.3. Data Availability and Access
MetRef is designed to provide a Traits object with the pre-computed metrics and genomic parameters for each genome in a study defined by the user. The traits object contains the pre-calculated metrics and parameters for all selected genomes as a downloadable csv file. These parameters include:
Complexity Metrics: GS (Genomic Signature) and BB (Biobit), plus the k value used to calculate them (kGS and kBB1).
Genomic Parameters: Size, ACGT base count, GC%, entropy, gene count (total, protein coding and non-protein coding), and the proportion of hapax sequences (a sequence that appears only one time).
MetRef thus addresses the need for an integrated system capable of providing immediate access to pre-calculated, standard values.
3.4. Preliminary Statistical Analysis
MetRef creates a complete PDF report of preliminary statistical analysis on the users' requests. The MetRef reports can be produced by MetRef only when there are at least thirty organisms involved in a Study that has been created by the user; this capability was added because it is a very common requirement to do some form of systematic analysis prior to further investigation of data sets. All of the reports are developed using R scripts.
Correlations: A Pearson correlation matrix is developed to determine the linear relationship between various genomic parameter metrics. The Holm-Bonferroni correction [27] for the Family-Wise Error Rate (FWER) is applied to all correlations reported within the study. A reference to a correlation matrix from one of the reports is provided in Fig. (3).
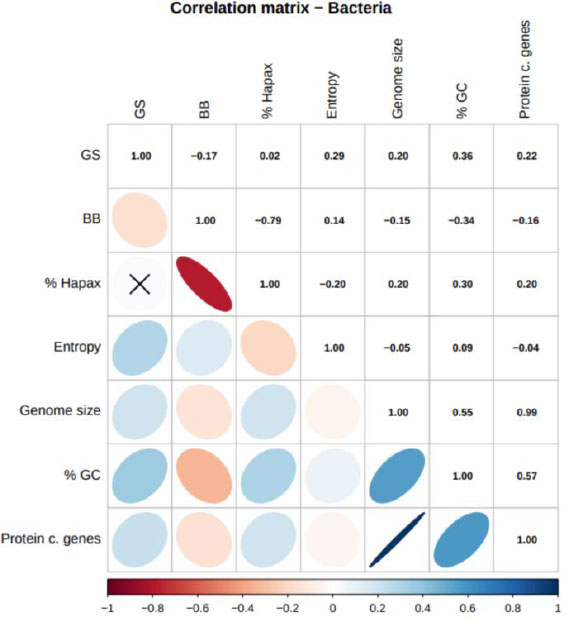
Correlation matrix extracted from a report.
Data Visualizations (Scatter Plots): Using the ggplot2 [28] R library, scatter plots are used to provide a graphical representation of relationships between pairs of variables. Reference to a scatter plot from one of the reports is provided in Fig. (4).
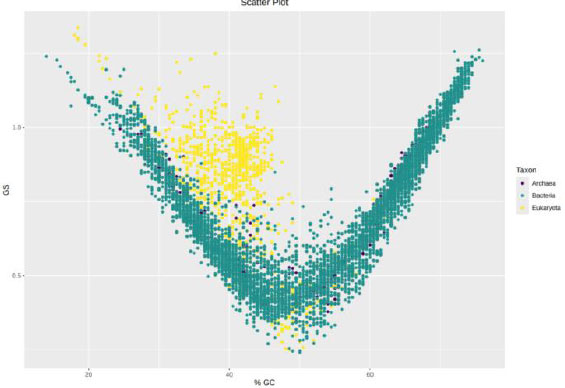
Scatter plot extracted from a report.
Principal Component Analysis (PCA): If there are seventy or more organisms within the Study, then PCA is conducted. PCA is critical in the reduction of dimensionality and visualization of groups of organisms. Reference to a PCA from one of the reports is provided in Fig. (5).
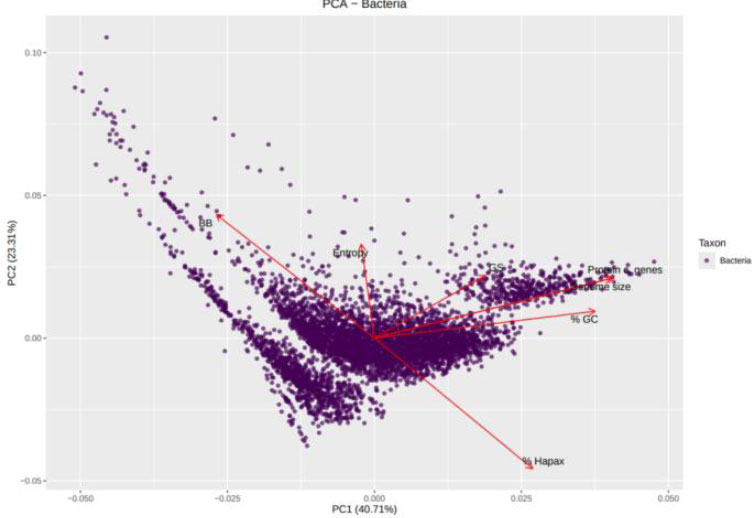
PCA extracted from a report.
Comparing Means (Box Plots): Box plots are generated to graphically show the distributions of metric values among the selected taxa. When comparing only two taxa, a t-test is used to compare means. If three or more taxa are being compared, then an Analysis of Variance (ANOVA) test is used to compare the means of each taxon. Reference to an ANOVA from one of the reports is provided in Fig. (6).
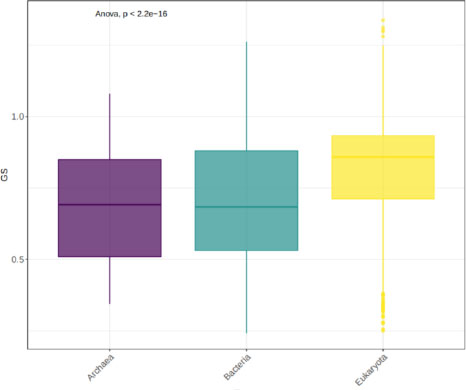
ANOVA test extracted from a report.
All generated plots will utilize the viridis color palette, which is a color palette designed to assist individuals who have difficulty seeing colors (i.e., color blind), to ensure that all individuals can easily interpret all plots [29].
3.5. System Performance and Scalability
To assess how well our system could handle both a lot of users at once and be responsive to those users, we did stress tests on our site with 100 concurrent users each sending a total of 5,000 ab requests. The average request time for MetRef was 15.32 milliseconds and had a total throughput of 6527.30 requests per second. With no failures, these results showed that the architecture we are currently using (NGINX/Gunicorn) is very robust and will perform well under a high number of concurrent users, making a large amount of requests without an impact on overall performance or service quality.
4. DISCUSSION
MetRef has successfully addressed the two main issues of genomic complexity analysis: 1) Computational Inefficiency, and 2) Lack of Procedural Standards.
4.1. Biological Relevance of Complexity Metrics
Genomic Signature (GS) and Biobit (BB) metrics developed by MetRef can be used to measure the biological relevance of complexity. Genomic Signature (GS) measures how different or dissimilar a k-mer distribution is compared to a completely random distribution, indicating some level of constraint due to evolution and/or structural bias. Biobit (BB) provides an alternate way to assess the degree of non-linearity in a genome's informational capacity by balancing both entropic and anti-entropic contributions. These metrics were previously shown in prior studies of bacterial endosymbiotic events to be responsive to evolutionary changes, including a reduction in genome size and increased randomness of sequences.
4.2. Advantages & Performance
MetRef was optimized through the inclusion of KMC 3, which utilized a RADIX sort-based algorithm to facilitate high levels of parallelism for k-mer counting.
4.3. Standardization and Reproducibility
The use of a web-based interface allows MetRef to ensure that all processed data comes from a standardized pipeline. Therefore, it is possible for users to reproduce results with very high accuracy. The combination of using Django, PostgreSQL, and asynchronous processing capabilities of Celery/Redis enables the system to operate reliably at high concurrency levels, supporting the generation of large-scale comparative reports.
CONCLUSION
MetRef is an integrated, self-automating, and standardized reference platform that facilitates the measurement of genomic complexity. In addition to standardizing the application of the metric (the actual calculation), MetRef also produces automatic statistical reporting of correlation coefficients (Pearson R) and principal component analyses (PCA), as well as ANOVA, which greatly enhances the productivity of the research process for evolutionary biologists.
Currently, MetRef is fully operational and ready for use by both internal and external researchers. The next stage of development for MetRef will be the integration of additional metrics used to measure genomic complexity, as well as enhancements to the user interface with respect to facilitating batch uploads of user-generated genomes.
AUTHORS’ CONTRIBUTIONS
The authors confirm contribution to the paper as follows: P.R.E.: Study conception and design; P.R.E., V.A and W.D.V: Analysis and interpretation of results; P.R.E.: Draft manuscript; P.R.E. and A.M.: Review manuscript; A.M.: Supervision. All authors reviewed the results and approved the final version of the manuscript.
LIST OF ABBREVIATIONS
| BB | = Biobit |
| GS | = Genomic Signature |
AVAILABILITY OF DATA AND MATERIALS
The MetRef web application is freely available for access at:https://www.metrefdb.com.
The source code for the entire application, including the optimized calculation pipeline, system architecture, and R scripts for statistical analysis, is publicly available on GitHub at:https://github.com/XXX/metref.
FUNDING
This research was funded by 'Ministerio de Ciencia, Innovación y Universidades,' grant number PID2019-105 969GB-I00, and by Generalitat Valenciana, grant number CIPROM/2021/042. PRE has an FPU Grant (FPU21/03813) from the “Ministerio de Universidades’.
ACKNOWLEDGEMENTS
Declared none.