All published articles of this journal are available on ScienceDirect.
A Wearable System for the Stress Monitoring of Air Traffic Controllers During An Air Traffic Control Refresher Training and the Trier Social Stress Test: A Comparative Study
Abstract
Background:
Air Traffic Control (ATC) is a complex and demanding process, exposing Air Traffic Controllers (ATCs) to high stress. Recently, efforts have been made in ATC to maintain safety and efficiency in the face of increasing air traffic demands. Computer simulations have been a useful tool for ATC training, improving ATCs skills and consequently traffic safety.
Objectives:
This study aims to: a) evaluate psychophysiological indices of stress in an ATC simulation environment using a wearable biomonitoring platform. In order to obtain a measure of ATCs stress levels, results from an experimental study with the same participants, that included a stress-induced task were used as a stress ground truth; b) understand if there are differences in stress levels of ATCs with different job functions (“advisors” vs “operationals”) when performing an ATC Refresher Training, in a simulator environment.
Methods:
Two studies were conducted with ATCs: Study 1, that included a stress-induced task - the Trier Social Stress Test (TSST) and Study 2, that included an ATC simulation task. Linear Heart Rate Variability (HRV) features from ATCs were acquired using a medical-grade wearable Electrocardiogram (ECG) device. Self-reports were used to measure perceived stress.
Results:
TSST was self-reported as being much more stressful than the simulation task. Physiological data supports these results. Results from study 2 showed more stress among the “advisors” group when comparing to the “operational” group.
Conclusion:
Results point to the importance of the development of quantified Occupational Health (qOHealth) devices to allow monitoring and differentiation of ATCs stress responses.
1. INTRODUCTION
Air Traffic Controllers (ATCs) are responsible for complex and highly demanding tasks, requiring high levels of knowledge and expertise, combined with high levels of responsibility [1]. Accordingly, they are in charge of the safe, ordered and expeditious flow of air traffic in the worldwide Air Traffic Control (ATC) structure [1, 2]. The recent increase in air traffic demands makes the role of ATCs more important than ever. As aeronautic technologies have improved, technological support systems are being introduced in aviation, but ATC still heavily depends on the human expertise of ATCs. Hence, it is essential to understand ATC tasks from a viewpoint of ATCs’ cognitive behavior in order to assess and improve assignment systems and training programs [3]. In some settings (e.g., during real ATC situations), the stress of real-time performance, and the difficulty of providing instantaneous and accurate feedback makes sometimes, on job training not a good solution. Hence, it may be useful to use simulation techniques as a supplement [4]. Computer simulations have been a useful tool for ATC trainings and they are currently considered a good method to reveal how ATCs organize cognitive schemes and operational strategies in their real field settings. A key issue in the design of simulators is realism and fidelity [5].
Considering ATCs high demands and role complexity, there is a growing concern of how these professionals can be affected by stress and fatigue. In fact, ATC is widely perceived as being a stressful occupation [6, 7]. According to a review on job stress in ATCs, two important sources of stress can be identified: the responsibility for air traffic safety and the workload [8]. As an example, the loss of connection between two aircraft, even if considered not serious by pilots, passengers or the public, could be problematic for controllers. Even if a separation loss usually does not lead to an accident, it can cause stress reactions on the controller.
ATCs roles can be classified into three types: “area/en-route”, “approach” and “aerodrome/tower”. The “area controllers” are in charge for the safety of aircraft at higher altitudes. The “approach controllers” guide the aircraft into the most efficient order and a way for landing. The “aerodrome (or tower) controllers” maintain aircraft within the immediate area of the airport and use visual surveillance from the airport tower [2]. Hence, ATCs face different working environments and may have different job stressors as well as different reactions to them.
Stress can change the way a person feels, thinks and behaves, and it is not necessarily a negative phenomenon, being a physiological stimulus that motivates and inspires actions and is usually connected with human-environment interactions [9]. However, it can become a serious health problem when is perceived as an imbalance between an excess of demands and the lack of individual ability to meet them [10].The stress response can be measured from perceptual and physical human reactions. There are a wide variety of questionnaires for the self-assessment of stress (e.g., Perceived Stress Scale - PSS [11]. Apart from the perceptual responses, when the body is under stress, several physiological modifications can be observed. When a harmful event is perceived, the Autonomic Nervous System (ANS) is activated, the parasympathetic nervous system is withdrawn and the sympathetic nervous system is triggered. Subsequently, the secretion of stress-related hormones leads to several physiological responses, such as the vasoconstriction of blood vessels, increased blood pressure and breathing rate, increased muscle tension and Heart Rate (HR), and a decrease in Heart Rate Variability (HRV). Cannon described these as the “fight-or-flight” response [12]. ECG-derived measures, such as the HRV, are being used for monitoring the effects of stress in the cardiovascular system [13].The HRV defines the complex variation of beat-to-beat intervals mainly controlled by ANS over the interaction of sympathetic and parasympathetic activity and it can be indexed by time- and frequency-domain parameters [14]. Nevertheless, little agreement exists in the literature for the most suitable HRV-based metric for stress events detection and differentiation [15]. Moreover, in the majority of studies in these areas, the stress levels of ATCs are measured only by means of questionnaires [2].
The aim of this study is two-fold: a) to evaluate psychophysiological indices of stress in an ATC simulation environment using an innovative wearable biomonitoring platform. In order to obtain a measure of ATCs stress levels, results from an experimental study, with the same controllers, that included a stress-induced task were used as a stress ground truth; b) understand if there are differences in stress levels of ATCs with different job functions (“consultant” vs “operational”) when performing an ATC Refresher Training. This simulation task is a regular effort made by the Navegação Aérea Portuguesa, NAV, E.P.E., Portugal to improve the training of ATCs.
2. METHODS
2.1. Dataset Description
Eleven Portuguese area/en-route ATCs (8 males and 3 females) accepted to participate in this study. The age range was 37 to 54 years (M = 46.73 ± 5.90). The years of practice ranged between 13 years to 32 years (M = 20.82 ± 6.60). Regarding their job function, 6 of them work as “advisors”, while 5 of them work as “operationals”. “Advisors” are ATCs that have more years of experience and are currently doing more consulting work. They perform operational work only during weekends. On the other hand, “operationals” ATCs are those that daily work in the ATC operation room.
A total of 25h30 of clinical grade ECG was collected during the two experiments. A more detailed description of the dataset is provided in the (Table 1).
| Job Function | N | Mean Age | Mean years of experience | Total Hours of Collected ECG* |
|---|---|---|---|---|
| Advisors | 6 | 51.00 ± 3.10 | 25.50 ± 5.17 | – |
| Operational | 5 | 41.60 ± 3.85 | 15.20 ± 1.79 | – |
| Total | 11 | 46.73 ± 5.90 | 20.82 ± 6.60 | 25h30 |
The exclusion criteria for the study discarded participants having a history of cardiovascular disease and/or taking prescription drugs known to affect cardiovascular function. The study was approved by the University of Porto Ethics Committee. All informants were carefully instructed about the study protocol and gave written informed consent prior to the examination.
2.2. Materials
For physiological data acquisition, participants were equipped with Vital Jacket® [16, 17] Fig. (1). The Vital Jacket® is a wearable biomonitoring platform (in form of a t-shirt) able to collect medical-grade ECG signals and actigraphy data in real-time. This equipment is certified according to the MDD93/42/EEC medical device directive holding the European Conformity medical device mark [18]. An Android smartphone application was used for data synchronization and event marking. Fig. (1) illustrates the monitoring system workflow.
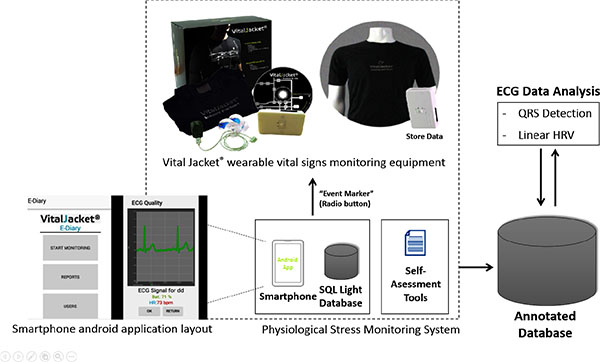
This system pairs with Vital Jacket® via Bluetooth and enables the annotation of the exact time of events in the device, using “Radiobuttons” generated by pushing a button in the wearable device. These events are saved in the device and synchronized with the ECG that is being acquired at that moment. The android application stores all the information about the events in an SQL Light DataBase, from where a report of the event data can be generated and exported for processing and analysis, always warranting the synchronization between those events information and the data collected by the Vital Jacket®.
In order to collect psychological stress data, Visual Analogue Scales (VAS) were used to assess perceived stress before and after the simulator task [19]. This measure required participants to rate the average level of perceived stress experienced during the tasks by marking any point on a 10-centimeter line ranging from “None” to “As bad as it could be”. Single–item measures were used since they present several benefits; for a detailed review of these please see Fisher et al. (2016) [20].
Perceived stress scale (PSS) was also used as a measure of chronic stress [11].
Demographic and medical surveys were also used in order to assess participant’s current health state and assure that the inclusion criteria were fulfilled.
2.3. Experiments
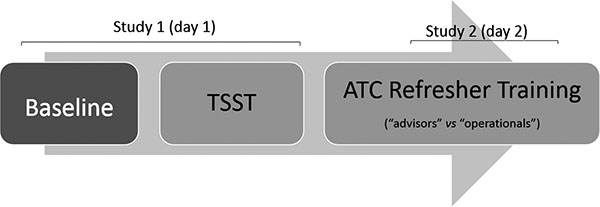
Each ATC was assessed in two different conditions: study 1, where ATCs were required to perform a stress-induced task - TSST - the Trier Social Stress Task; and study 2, where ATCs performed an ATC refresher training in a simulated environment (Fig. 2).
2.3.1. Study 1. Trier Social Stress Test (TSST)
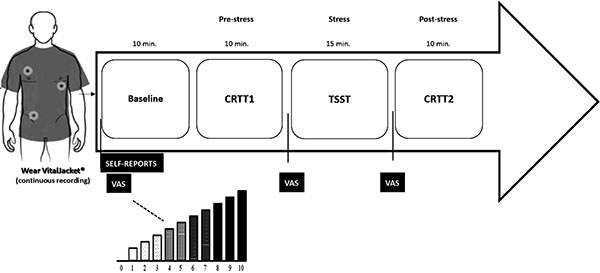
This study was conducted in order to investigate psychophysiological stress responses among ATCs and its impact on cognitive performance. For that purpose, a 2-Choice Reaction Time Task (CRTT) was also implemented before and after the stress procedure (Results from this study are presented in [21]) (Fig. 3).
Baseline ECG data was obtained, while participants were sat for 10 minutes. They were instructed to relax and not to perform any movement during this period. Then, they completed a gold standard stress procedure, based on an acute psychosocial stress paradigm, the Trier Social Stress Test (TSST) [22]. Briefly, in the TSST, the participants were asked to deliver a speech for 3-5 minutes and to perform an arithmetic task (e.g. count down from 1022 by 13’s for two minutes). When making a mistake, participants were asked to start over in front of an evaluating committee. The committee consisted of three jury members that do not respond emotionally during the test, which makes the situation stressful for the participant. Before and after TSST participants filled in the stress VAS.
2.3.2. Study 2: ATC Refresher Training.
The same participants performed study 2. This study included an ATC simulation task, known as an “ATC refresher training”. This task took about 90 minutes and was developed by NAV, EPE. It consisted of a simulation of several air traffic situations. The air traffic increased during the simulation, reaching moments of intense air traffic control. The rapid resolution of air traffic situations depends on ATCs competence and skills. The ATCs work in groups of two. The ATC simulation task was designed for en-route situations. Portugal air space was used in the simulation. The air space was divided into several “sectors” with different levels of altitude. According to the air traffic, the ATCs can inform a pilot to change the plain route for a different level of altitude. This operation required an effective communication with the controllers from the other sectors. It is important to note that each controller changed between all the positions.
The main roles of ATCs during this simulation were to accept aircraft into their sector, check aircraft, issue instructions, clearances, and advice to pilots, and hand aircraft off to adjacent sectors or to airports. When the aircraft left the airspace assigned by the ATCs, the control of the aircraft passes to the controller responsible for the next sector (or to the tower ATCs in case of airport approximation). Fig. (4) shows an example of ATCs performing the ATC Refresher Training.
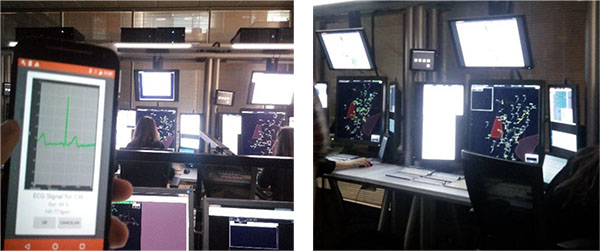
As is typical in many real-world complex systems, this environment imposes multiple concurrent demands on the operator. In fact, in the en-route ATC environment, the system that confronts the controller, involves a large number of aircraft coming from a variety of directions, at diverse speeds and altitudes, heading to different destinations.
3. DATA ANALYSIS
3.1. Statistics
Data were statistically analyzed using IBM SPSS AMOS (v.24) software. Taking into account the few number of population samples, some parameters failed in the normality test, so all parameters were analyzed using non-parametric statistical tests.
Wilcoxon Signed Rank Test was used to test if there were differences between stress VAS in the two different studies. Kruskal-Wallis Test was used to compare physiological data between three conditions: baseline, TSST and ATC Refresher Training. Mann-Whitney test was used to compare physiological stress variables among two different groups: “advisors” vs “operationals” [23].
3.2. ECG Data
In order to extract heartbeat information from the ECG recordings, a software from Biodevices S.A, with an ECG analyzer was used. This software has an algorithm based on the one developed by Pan Tompkins [24] incorporating ECG physiological filters to detect the “R” points of the ECG waveform corresponding to each heartbeat. Using this analyzer, the RR intervals (time between two consecutives “R” peaks in the ECG or two heartbeats) were extracted from the raw ECG signal. A simple verification according to Clifford, Azuage and McSharry [25] was made to verify if all the RR intervals were physiologically correct. Hence, all RR intervals lower than 300 ms and greater than 3000 ms were removed, while the remaining ones were labelled as “valid”. Additionally, all RR intervals that changed by more than 400 ms with respect to the previous “valid” RR interval, and all RR intervals that changed by more than 25% with respect to the mean of the five last “valid” RR intervals, were removed. The RR intervals that have physiological acceptance are named Normal-to-Normal (NN) intervals and were further used in the analysis.
For the comparison analysis between baselines, TSST and the simulation ATC task, two 5-minutes ECG (10 minutes in total) blocks were used for each subject in order to have a balanced analysis. For that purpose, we randomly chose two 5-minutes ECG blocks from the simulation task, considering the moments that include intense air traffic situations (this information was provided by the person responsible for the implementation of the simulation task). In some cases, there were more than one stressful events per person. Hence, a total of two blocks of 5-minutes ECGs was considered for each event in the statistical analysis. This allowed performing statistical comparisons and correlations considering a balanced sample number per condition.
Following the guidelines presented by the task force of the European Society of Cardiology and the North American Society of Pacing and Electrophysiology [14] different HRV time and spectral domains parameters were used (Table 2). Methods in the time domain define the intervals between successive normal QRS complexes (the Q-wave, R-wave, and S-wave). Measurements in the frequency domain provide information of how power distributes as a function of frequency.
| Domain | Measure | Description | Features Trend Under Stress |
|---|---|---|---|
| Time-domain | AVNN | Average of NN intervals (ms) | ↓ |
| – | RMSSD | Root mean square of differences of successive NN intervals (ms) | ↓ |
| – | pNN20 | NN variations above 20 ms (%) | ↓ |
| Frequency-domain | LF/HF | Ratio of Low Frequency and High Frequency power bands. | ↑ |
For time domain parameters, we recurred to the following metrics: the Average of NN intervals (AVNN); the root mean square of differences between successive Rhythm-to-Rhythm (RR) intervals (RMSSD) and the percentage of the number of pairs of successive NNs that differ by more than 20 ms compared to the total number of NN intervals, normally referenced to as pNN20. For extracting spectral parameters we recurred to the Lomb Periodogram [26]. We analyzed the ECG data both in the Low Frequency (LF) domain, defined between 0.04-0.15 Hz as well as in the high frequency (HF) domain (0.15-0.4 Hz), by computing their ratio - LF/HF.
4. RESULTS
4.1. Psychological Stress Scores
Wilcoxon Signed Rank Test was used to analyze stress VAS during study 1 (TSST) and study 2 (ATC simulation task). For study 1, a statistically significant increase, z = -2.95, p < .005, with a small effect size (r = .27), was found. Perceived stress increased from the baseline (M = 3.39 ± 1.11) to TSST (M = 6.82 ± 1.47). For study 2, results also revealed a statistically significant increase of perceived stress levels, z = –2.07, p = < .05, with a large effect size (r = .62) after simulation task. VAS stress results increased from 2.00 to 2.73.
When comparing stress VAS after the stress task in study 1 and after the simulation in study 2, a statistically significant difference was found: z = -2.81, p < .005, with a small effect size (r = .26). The TSST was self-reported as being much more stressful (M = 6.82) than the simulator task (M = 2.73).
When analyzing the stress VAS in the “advisors” group and the “operational” group, higher levels of perceived stress were found in the “advisors” group (M =3.33 ± 2.66) when compared to the “operational” group (M =2 ± .63).
Chronic stress levels were interpreted based on the results from the PSS. The total average was 23.82 (± 8.95), which can be considered a low level since it can achieve a maximum value of 56 [11].
4.2. Stress Events
A total of 21 events were reported during the ATC simulation task Table 3. These events were part of the simulation.
| Events | Event description | Total |
|---|---|---|
| Red code | When a plane enter on a military zone | 7 |
| High intense ATC | When there were high air space traffic situations to handle at the same time | 14 |
4.3. ECG Data
HRV-based metrics of baseline ECG collected at the 10 first minutes of the study 1 were compared with HRV measures of TSST, and the stress events from study 2. The time-domain HRV features AVNN, RMSSD, and pNN20, and frequency-domain LF/HF were used in these analysis.
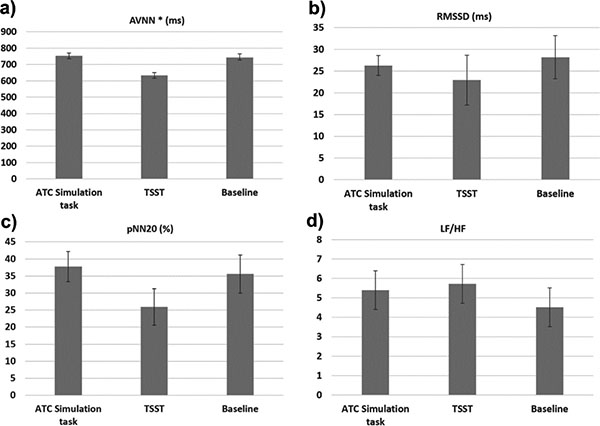
We compared physiological data from the two studies, particularly from three time points: baseline, TSST and ATC Refresher Training. The Kruskal-Wallis Test revealed a statistically significant difference in AVNN levels across the three moments (baseline, n=11; TSST, n= 11; ATC Refresher Training, n =10), χ2 (2, n=32) = 7.35, p = .012. The lowest level of AVNN (M=634.05 ± 54.48 ms) was registered during TSST, when compared to the other moments: baseline (M=744.15 ± 70.93 ms) and ATC Refresher Training (M=753.99 ± 68.90 ms) (Fig. 5). Although the other metrics were not statistically significant, there is a tendency for stress during TSST, considering the lower mean values of RMSSD and pNN20 and higher values of LF/HF during the stress task (TSST) in comparison with the other two conditions.
4.4. Study 2 – “Advisors” vs “Operationals”
We compare ECG data from study 2 in order to understand if there are significant changes in stress levels among two groups of ATCs according to their function: “advisors” vs “operationals” (Fig. 6).

Results from Mann-Whitney show significant differences for RMSSD, pNN20 and LF/HF Fig. (6). Lower values of RMSSD and pNN20, and higher values of LF/HF were found inside the “advisors” group, suggesting more stress in this group.
5. DISCUSSION
In this work, we have presented an innovative biomonitoring platform for the analysis of stress among ATCs. Firstly, psychophysiological indices of stress in an ATC simulation environment were evaluated, by comparing these data with data obtained from a gold-standard stress-induced task commonly used as ground truth for stress assessment studies. Moreover, this biomonitoring platform allows us to understand if there are differences in stress levels of ATCs with different job functions (“advisors” vs “operationals”) when performing the ATC Refresher Training.
The TSST was developed as an acute psychosocial stress procedure designed to elicit a physiological stress response [27]. Overall, stress VAS results, along with some HRV parameters showed that the chosen paradigm indeed elicited stress and was thus suited for the aim of the study. Accordingly, results from the ECG analysis showed that short-term psychological stress caused significant changes in some ECG time domain measures - such as AVNN. The decreased values of AVNN obtained during TSST, indicates that a significantly increased number of heart cycles were observed per temporal interval, in accordance with a higher activation degree of the cardiovascular system in order to compensate the demand for a more physiological responsiveness to ensure the “fight or flight” state caused by the stressor [28]. Hence, lower values are associated with stress responses [15]. The remaining time domain-features - RMSSD, pNN20 - showed a consistent but non-significant decrease during the stress condition, which is also compatible with a stress response [29, 30]. This might be explained by the limited number of subjects. Within the frequency-domain, an increase in the LF/HF ratio during TSST was also found, representing the effect of stress on sympathovagal balance [31]. Higher values reflect the domination of the sympathetic system over the parasympathetic one, typical of stress responses [15]. These results were concordant with an increase of subjective measures of stress (VAS) after this task. It can be concluded that the ATC Refresher Training did not evoke increased psychophysiological levels of stress when compared to a stress task. A possible explanation could be the fact that they are used to these type of functions, particularly the “operational” group. It is also important to bear in mind that, in the experimental protocol (study 1) ATCs were exposed to a different stressor. This task included a combination of socio-evaluative threat and uncontrollability, which are known for producing a stress response [32].
When analyzing data from the simulator task (study 2), results suggested that the “consultant” group perceived this task as more challenging than the “operational” group. These results were reinforced by the ECG analysis, considering the statistical significant lower values of RMSSD, pNN20 and higher values of LF/HF in the “consultant” group. It is important to bear in mind that this group does not perform this type of functions on a daily basis, showing more physiological arousal and higher stress perceptions. Hence, experimental evidence suggests that performing training situations increases the effective-based expertise and help neutralizing stress effects [33]. Stress can impair ATCs performance and increase errors rate during ATC functions. These can cause huge losses of human lives, material and environment impairment. A strong emphasis has been placed on simulators training, considering its ability to simulate and mimic the real traffic from simplest situations to the most complex ones [34]. Simulators enable better preparation of these professionals without compromising persons or property, thanks to more careful training on the reaction to threat situations, and a standardization of procedures in order to diminish errors or failures.
This study is not without limitations, such as the reduced sample size and the fact that no measure of performance was used during the simulator task. Hence, it would be important in this type of simulations to include performance indicators (e.g., counting the number of arrivals and departures handled per hour; number of “near miss” signals; reaction times) in order to understand the impact of stress on controller’s responses.
CONCLUSION
The current study used a novel biomonitoring platform that is indicative and may be useful as a starting point for future larger scale studies. Despite the drawbacks, the current study is a pioneer in terms of the specific population under study and the methodology used, providing an important insight into the direct effects of stress on health and performance. The system was successfully tested and validated in terms of reliability and feasibility using a dataset obtained from ATCs during two experimental conditions. Our scope is to deploy this wearable platform during real ATC situations for the continuous monitoring of ATCs stress levels. This allows future avenues for new perspectives on stress-related diseases, and the development of personalized and quantified occupational health (qOHealth) devices allowing real-life monitoring of ATCs stress responses.
LIST OF ABBREVIATIONS
| ANS | = Autonomic Nervous System |
| ATC | = Air Traffic Control |
| ATCs | = Air Traffic Controllers |
| AVNN | = Average of NN Intervals |
| CRTT | = Choice Reaction Time Task |
| ECG | = Electrocardiogram |
| HR | = Heart Rate |
| HRV | = Heart Rate Variability |
| qOHealth | = Quantified Occupational Health |
| LF/HF | = Ratio of Low Frequency and High Frequency power band |
| NAV | = Navegação Aérea Portuguesa |
| NN intervals | = Normal-to-Normal Intervals |
| PSS | = Perceived Stress Scale |
| RMSSD | = Root Mean Square of Differences of successive RR intervals |
| RR Intervals | = Rhythm- to-Rhythm Intervals |
| pNN20 | = percentage of the number of pairs of successive NNs that differ more than 20 ms |
| TSST | = Trier Social Stress Test |
| VAS | = Visual Analogue Scales |
ETHICS APPROVAL AND CONSENT TO PARTICIPATE
The study was approved by the University of Porto Ethics Committee.
HUMAN AND ANIMAL RIGHTS
All human research procedures followed were in accordance with the ethical standards of the committee responsible for human experimentation (institutional and national), and with the Helsinki Declaration of 1975, as revised in 2008.
CONSENT FOR PUBLICATION
All informants were carefully instructed about the study protocol and gave written informed consent prior to the examination.
CONFLICT OF INTEREST
The authors declare no conflict of interest, financial or otherwise.
ACKNOWLEDGEMENTS
This work has been financed by National Funds through the FCT Fundação para a Ciência e Tecnologia (Portuguese Foundation for Science and Technology) within the project VR2Market CMUP-ERI/FIA/0031/2013 and FCT PhD grant PD/BD/135023/2017. We would like to thank NAV, E.P.E. Portugal and all the Air Traffic Controllers that accepted to participate in this study.

