
Cyclostationary Analysis for Heart Rate Variability
Abstract
Background:
During the last years, cyclostationarity has emerged as a new approach for the analysis of a certain type of non-stationary signals. This theoretical tool allows us to identify periodicity in signals which cannot be identified easily but also to separate useful signals for other interfering contributions that overlap in the spectral support.
Objective:
The aim of this work is the exploitation of cyclostationary theory to enhance standard methodologies for the study of heart rate variability. In this framework, a preliminary analysis on healthy patients is proposed to be extended further on pathological patients with the perspective to improve (hopefully) the diagnostic power of some cardiac dysfunctions due to the more complete set of information provided by this analysis.
Methods:
The proposed approach involves an initial band-pass filtering step in the range 0.5 - 40 Hz of the recorded ECG signal, followed by a first-order derivative filter to reduce the effects of P and T waves and to emphasise the QRS contribution. After that, the auto-correlation function is evaluated and the Cyclic Power Spectrum (CPS) is computed. From this two-dimensional information, a one-dimensional plot is derived via the evaluation of a folded-projected CPS to be compared with standard Lomb-Scargle spectrum.
Results:
The proposed analysis has been tested on both numerical simulations as well as for the processing of real data which are available online in the Physionet database.
Conclusion:
The proposed cyclostationary analysis has shown a good agreement with the results provided by the classical Lomb-Scargle spectrum in the processing of real data, underlining some contributions in the high-frequency bandwidth which are not visible by means of standard processing.
1. INTRODUCTION
Heart Rate Variability (HRV) is the variation in the time interval between consecutive heartbeats. It is a physiological phenomenon related to the regulation of the cardiac activity produced by the Autonomic Nervous System (ANS) [1]. More in detail, the accelerations and decelerations of the heard activity are due to the competing activities of the sympathetic and the parasympathetic nervous system branches [2]. The analysis of the HRV has the advantage of being noninvasive, easy to be performed and with good reproducibility, and is useful for the determination of the ANS status [3] and the cardiac activity [4]. In particular, it has shown to have a beneficial role in the diagnosis and analysis of several pathologies related to blood pressure [5], myocardial infarction [6, 7], brain damage [8], depression [9], cardiac arrhythmia [10], diabetes [11] and renal failure [12]. HRV analysis has also shown correlations with sleep [13], drugs [14] or alcohol [15] assumption and smoking [16].
A first important step in order to provide HRV measures consists of the R peak detection in the QRS wave. Regarding this aim, many robust algorithms are known in the literature, among which the well-known Pan-Tompkins algorithm [17] represents a gold standard for the scientific literature.
Variation in heart rate can be evaluated by using four main classes of methods. The first one is based on the evaluation of some synthetic parameters in the time domain. In a continuous electrocardiographic (ECG) record, each QRS complex is detected, and the so-called normal-to-normal (NN) or RR intervals (that is all intervals between adjacent QRS complexes resulting from sinus node depolarizations), or the instantaneous heart rate is determined. Simple time-domain variables that can be calculated include the mean RR interval, the mean heart rate, the difference between the longest and shortest RR interval, and many others [18, 19]. Other time-domain measurements analyse the variations in instantaneous heart rate secondary to respiration, tilt, Valsalva maneuver, or secondary to phenylephrine infusion. These differences can be described as either differences in heart rate or cycle length.
A second important class is represented by frequency domain methods, which are mainly based on the estimation of the Power Spectral Density (PSD) [20]. The analysis of this function provides the basic information of how signal power distributes as a function of frequency. Both parametric and non-parametric methods are available for the PSD estimation, each one with its advantages and limitations. Non-parametric methods are simple and fast, since they are mostly based on the use of the fast Fourier transform, while parametric methods provide smoother spectral components and a more accurate estimation of the PSD even on a small number of samples on which the signal is supposed to maintain the stationarity hypothesis. Among these techniques, the Lomb-Scargle (LS) periodogram is perhaps one of the most well-known techniques employed to compute the periodicity of unequally-spaced data, and it provides a good estimate of the PSD of an ECG signal [21-25]. LS method avoids the major problem of classical approaches related to the low-pass effect due to re-sampling operation. Therefore, the Lomb method is more suitable than fast Fourier transform or autoregressive estimate with linear or cubic interpolation for PSD estimation of unevenly sampled signals [26]. However, in extreme situations (low heart rate or high-frequency components), the Lomb estimate still introduces high-frequency contamination that suggests further studies on superior performance interpolators.
Both time-domain and spectral methods share some limitations imposed by the irregularity of the RR series, since they assume the same trends of increasing or decreasing in the cycle length, which is not always realistic [27, 28]. In practise, this reflects on the amplitude of the peaks at fundamental frequencies in the spectral analysis and enlarge their basis. In order to overcome these limitations, some alternative techniques aiming at analysing the rhythm pattern via considering blocks of RR intervals without considering the internal variability have been proposed. The well-known interval spectrum and spectrum of counts methods are well suited to investigate the relationship between HRV and the variability of other physiological measures, like blood pressure, respiration and arrhythmia events [29].
Last class of approaches for HRV analysis is based on non-linear methods [30-34]. The motivation for using this kind of methodologies is based on the non-linear phenomena involved in the genesis of the HRV signal, which is the result of complex interactions among haemodynamic, electrophysiological and humoral variables. However, although in principle, these techniques have been shown to be powerful tools for characterization of various complex systems, their application to HRV (and biomedical data more in general) still needs to be validated. An exhaustive overview of the main publications for non-linear HRV analysis for the past 25 years has been proposed in reference [35]. In their work, Sassi et al. present a critical review of the state of the art and new methodologies tested in sufficiently sized populations, with particular attention paid to the long-range correlation and fractal analysis, entropy and regularity, non-linear dynamical systems and chaotic behaviour.
Conversely from the approaches described previously in the text, this short communication aims at testing and analysing the performance of cyclostationary (CS) analysis for HRV signals. In most cases, the stationarity hypothesis is often an assumption of convenience rather than a realistic one, and for many biomedical signals (e.g., ECG, EMG, etc.) the use of cyclostationarity, i.e. the cyclic variation of the statistical properties, is more suitable rather than conventional stationary assumption [36-38]. Compared to standard analysis, it provides some extra information due to the hidden periodicities in the signal. Taking advantage of these properties obviously leads to more powerful processing than possible with the stationary approach. Moreover, this extra information often counter-balances the complication that it may involve as compared to other standard approaches.
Methodologies exploiting CS theory for heart monitoring have been proposed by several authors. In reference [39], a CS approach for heart and respiration rates monitoring exploiting a 2.4 GHz Doppler radar is presented. CS theory has also been applied to ECG signals for several applications, such as foetal ECG extraction [40] or for the study of non-linearity in the HRV signal [41]. In this framework, we propose to apply the CS methodology to the ECG signal in order to analyse the HRV. The main advantage of the CS analysis for HRV signals consists in the possibility of studying simultaneously the standard spectral coverage of the ECG signal in the classical frequency domain, but also the cyclic spectral components related to the physiological behaviour of the HRV. Another important advantage is that the analysis is performed directly in the time domain after the ECG recording and does not require any RR interval extraction, which makes this tool more robust.
The remainder of the paper is organised as follows: Section 2 provides a mathematical overview of CS theory, Section 3 proposes the methodology involved in this paper and Section 4 presents some numerical results and real data processing. Finally, Section 5 closes the paper and draws some conclusions.
2. FUNDAMENTALS OF CYCLOSTATIONARY THEORY
CS extends the class of stationary signals to those signals whose statistical properties change periodically with time. In this theoretical framework, the minimum “period” of a CS signal is called cycle [38].
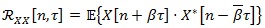
Conversely from standard non-stationary signals, CS is a well-defined property and can exploit a powerful spectral analysis in a wide sense, employing the same tools that have been developed historically for stationary signals [42]. The instantaneous auto-correlation function
 of a random signal
 , with Δ denoting the sampling period, can be defined as:
 |
(1) |
where n and τ are two time variables,
 is the statistical mean operator and
 β The β. The parameter in Eq. (1) allows a general formulation of various equivalent definitions found in the literature (for example typical values are β = 1/2 for the symmetric instantaneous autocorrelation function, and β = 1 or β = 0 for the asymmetric case) [38].
By definition, the instantaneous auto-correlation function of a (quasi-) CS signal is (quasi-) periodic, and therefore it can be decomposed in a Fourier series:
 |
(2) |
over the spectrum A = {αi} of the cyclic frequencies associated to non-zero Fourier coefficients:
 |
(3) |
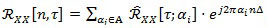
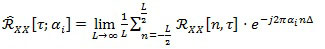
Coefficients in Eq. (3), which are function of the time τ and of the cyclic frequency ai, are called the cyclic auto-correlation function of the random signal X[n]. Finally, by exploiting Eq. (3), the Cyclic Power Spectrum (CPS) can be defined as:
 |
(4) |
As well known in the spectral analysis, there is no consistent estimator of the CPS, i.e. an estimator whose variance tends to zero as the length of observation time increases [42, 43] Although not consistent, the averaged cyclic periodogram
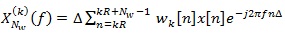
 is one of the most adopted spectral estimators. Given a sequence x{n} of the random CS signal and a positive and smooth Nw-long window W[n], and Wk [n] = W[n - KR] its shifted version of multiple of R samples, the averaged cyclic periodogram can be computed via:
 |
(5) |
where,
 |
(6) |
is the short Discrete-Time Fourier Transform (DTFT) of the K-th weighted sequence
 (where the operator. rounds the argument to rounds the argument to the next smaller integer).
In this manuscript, we want to evaluate the CPS of an ECG signal, therefore, we apply Eq. (5) for the estimation of CPS in order to perform a more complete spectral analysis.
3. METHODS
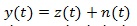
Let us consider a recorded ECG signal:
 |
(7) |
where z (t) is the noise free signal and n (t) is the additive noise term which can be modelled as uncorrelated and Gaussian distributed.
As first step after the acquisition, a bandpass filter is applied in order to remove the frequency components below 0.5 Hz, which are mainly related to breathing, and the components above 40 Hz, which are due to external interferences. Next, a derivative filter is exploited to isolate and strengthen the QRS information. The motivation behind this choice lies in the attempt to reduce the effects of the P and T waves compared to the QRS complex since the main information regarding HRV is related to the QRS peaks.
Subsequently, the CS spectrum is computed. As described in Section 2, the procedure requires the computation of the auto-correlation function
 followed by the estimation of the cyclic power spectrum
. In other words, Eqs. (1, 5 and 6) are computed.
followed by the estimation of the cyclic power spectrum
. In other words, Eqs. (1, 5 and 6) are computed.
Conversely from classical HRV spectra, the information arising from the cyclostationary analysis has two dimensions, i.e. the spectral frequencies and the cyclic frequencies f, and spread on both positive and negative frequency a values. Therefore, in order to isolate the HRV information and improve its readability, a further spectrum, namely folded-projected cyclic power spectrum (FPCPS), is computed. The first step consists in integrating the CPS over the spectral frequencies:
 |
(8) |
The signal
 , with respect to the CPS, has lost the information about the frequency components of the ECG signal y (t), keeping only the dependency on the cyclic frequencies α which contains information about the HRV.
Another transformation is required in order to refer to the shift of the cyclic frequency values α from the central cyclic frequency αav, i.e. the mean heart rhythm, instead of considering the absolute values. Moreover, since we are interested in the amplitude of the cyclic frequency shifts from the average value, both positive and negative shifts are worth for this evaluation. Thus, a “folding-and-sum” operation around the zero cyclic frequency is performed, obtaining the FPCPS:
 |
(9) |
in which u(.) represents the Heaviside step function.
4. RESULTS
In order to show the potentiality of cyclostationary analysis for the study of Heart Rate Variability (HRV), results related to both simulated and real case study are presented.
4.1. Simulated Data: Gaussian Template
A synthetic signal z (t) was generated by replicating M times a template function over time. The template function simulated the signal related to one heart beat, while the delays of the replicas take into account the heart rhythm and the HRV. Analytically, the simulated signal can be expressed as:
 |
(10) |
where,
 |
(11) |
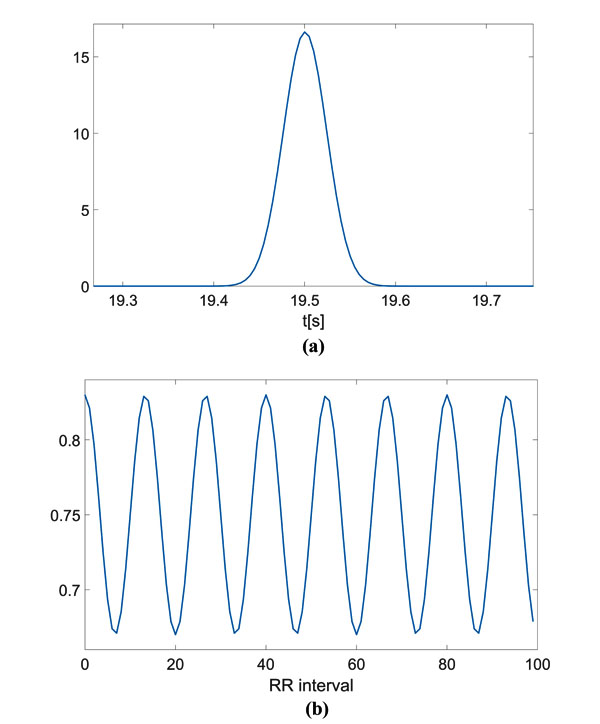
and RR [i] is the time distance between the i-th and the (i + 1)- th heartbeat. For this simulation, we considered as template p(t) a Gaussian function and the following model for the RR intervals:
 |
(12) |
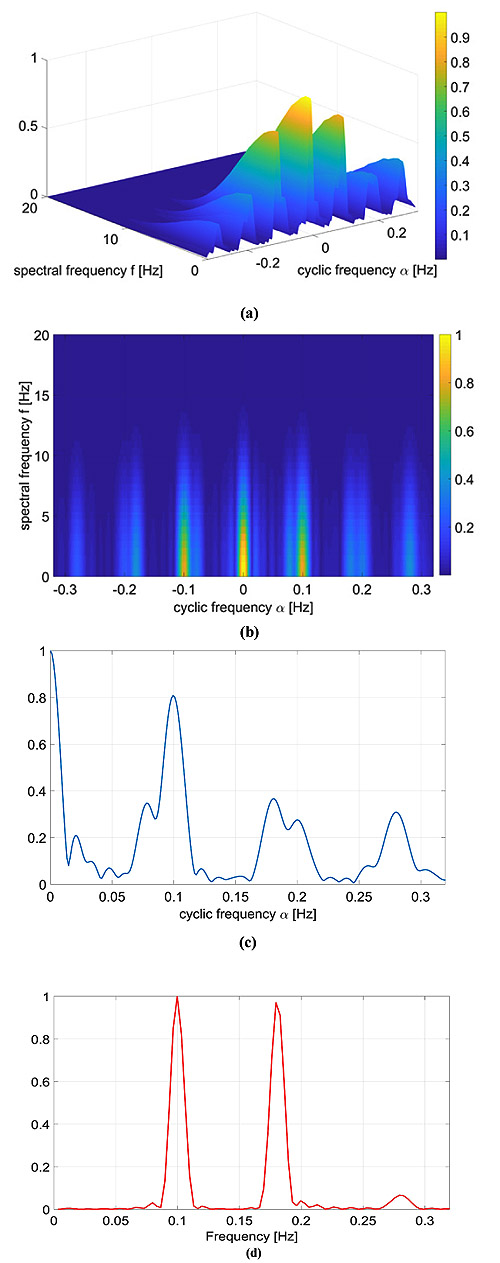
in which RRav is the average RR interval (constant), and α1 represents the amplitude of the deviations from the average RR value. In other words, we considered a sinusoidal behaviour of the HRV. In this example, we assumed RRav = 1 s and a1 = 0.07 , corresponding to a variation of approximately compared to the RRav f1 refers to the frequency involved in the numerical model and the parameter m identifies the m-th RR interval. This choice seems to be realistic, as proved by averaged oscillations in healthy patients. We assumed the sampling frequency fs = 200 Hz, a number of heartbeats M = 100 and an HRV frequency f1 = 0.1 Hz. Fig. (1). reports the Gaussian template function employed for the synthetic signal generation and the RR-interval amplitudes described by the model in Eq. (12).
The computed CPS is reported as surface and as an image in Fig. (2a and b), respectively. On the spectral frequency axis (f), information about the components of the signal template can be appreciated, while on the cyclic frequency axis (α), the HRV can be evaluated. For the sake of clarity, the figures show the cyclic frequency axis (α) centred at αav = 1/RRav, which corresponds to the zero cyclic frequency. In can be noticed that the peaks at are in correspondence with the considered HRV frequency f1 Hz. Of course, harmonics at 0.2 Hz and 0.3 Hz are present.
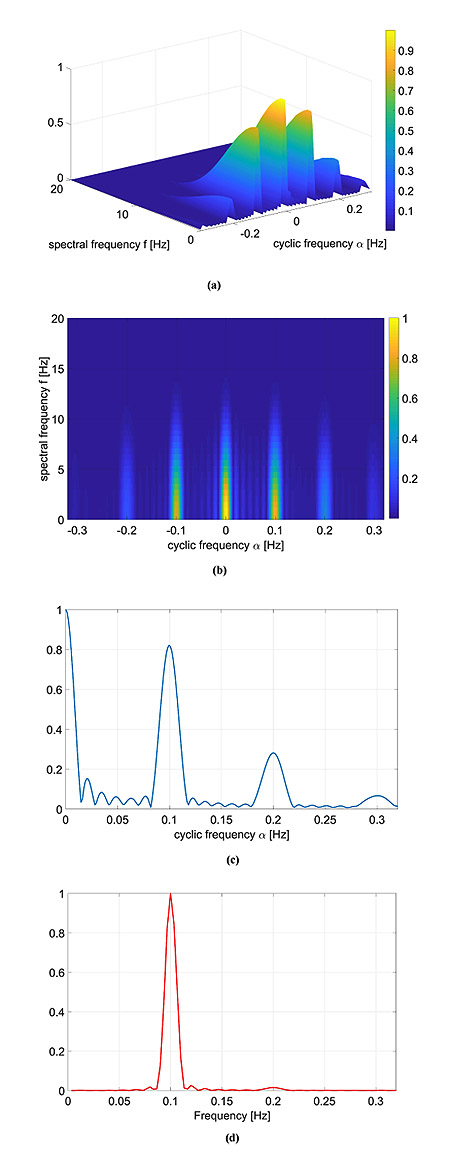
In Fig. (2c), the FPCPS computed according to Eq. (9) is reported. It can be observed that both the contributions at f = 0 (corresponding to RRav) and f1 = 0.1 Hz are present in the spectrum, even though also some other harmonics at multiple of f1 can be detected in the spectrum. In order to provide a reference, the LS spectrum is reported in Fig. (2d). Such a result confirms the presence of the HRV frequency at 0.1 Hz. It should be noted that the DC component does not appear in the LS spectrum due to the fact that the Matlab function used for this comparison does not evaluate the component centred at f = 0 Hz.
A Monte Carlo (MC) simulation has been implemented in order to evaluate the robustness with respect to noise. First, a white Gaussian noise has been added to the ECG signal Z (t) of Eq. (10), i.e.
 |
(13) |
where
 with the noise standard deviation σ fixed. One hundred signal realizations have been considered, and for each, the CS spectrum has been computed and the position of the contribution close to f = 0.1 Hz has been measured. The analysis has been repeated for σecg varying between 1 (SNR of about 50 dB) and 50 (SNR of about 18 dB), and the results are reported in Table 1. It can be appreciated that the mean value of the peak position slightly changes (in case of σecg = 50 it increases of about 11%). Of course, in case of high noise level, the stability of the peak position greatly decreases, with a standard deviation of 0.04 in case of σecg = 30 and higher. Nevertheless, it can be noted that, in case of noise σecg = 10 (SNR of about 30dB) or below, the standard deviation of the estimation is in the order of magnitude of 1.10-3 or lower.
| Noise Level | Peak Position (Mean) | Peak Position (STD) |
|---|---|---|
| σecg = 1 | 0.0992 | 0.0000 |
| σecg = 2 | 0.0992 | 0.0001 |
| σecg = 3 | 0.0993 | 0.0006 |
| σecg = 5 | 0.0995 | 0.0006 |
| σecg = 10 | 0.0996 | 0.0013 |
| σecg = 20 | 0.0994 | 0.0250 |
| σecg = 30 | 0.1053 | 0.0407 |
| σecg = 50 | 0.1132 | 0.0466 |
A second MC simulation has been implemented in order to evaluate the effect of noise corrupting the RR intervals. Samples from a white Gaussian random variable have been added to the time instants Tm defined in Eq. (11). As in the previous simulation, 100 MC iterations have been considered and for each, the frequency peak close to f = 0.1 Hz has been identified. The performances were evaluated in case noise standard deviation σt ranging from 5.10-3 to 2.10-1, and results are reported in Table 2. Compared to the previous MC simulation, a different behaviour can be appreciated: When the noise standard deviation is greater than, performances rapidly deteriorate, while remaining good in case of lower values of σt.
| Noise Level | Peak Position (Mean) | Peak Position (STD) |
|---|---|---|
| σt = 0.005 | 0.0995 | 0.0012 |
| σt = 0.001 | 0.0997 | 0.0022 |
| σt = 0.002 | 0.1001 | 0.0048 |
| σt = 0.003 | 0.0995 | 0.0810 |
| σt = 0.004 | 0.1002 | 0.0105 |
| σt = 0.005 | 0.0978 | 0.0180 |
| σt = 0.01 | 0.0903 | 0.0419 |
| σt = 0.02 | 0.1258 | 0.0591 |
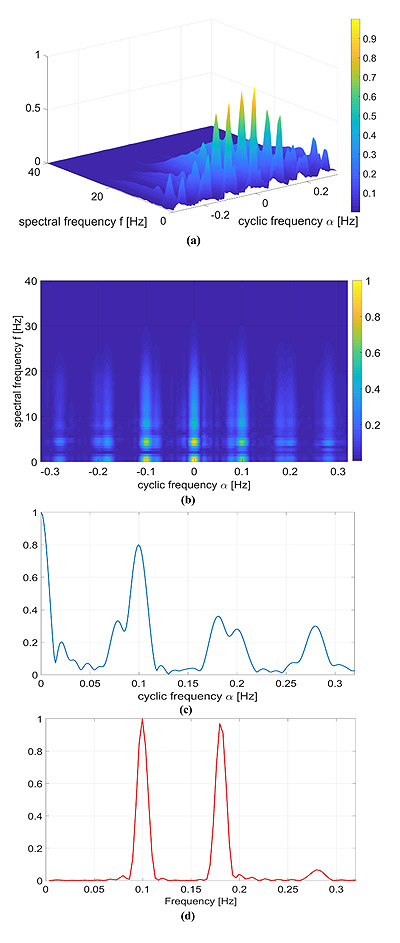
As a second numerical example, a second cosine component was added to the RR model:
 |
(14) |
with α2 = 0.07 and f2 = 0.18 Hz and the other parameters equal to the previous case. As in the previous case, the FPCPS and the LS periodogram are reported in Fig. (3).
Again, there is a good agreement between the LS spectrum and the FPCPS, as shown in Fig. (3c, d). Conversely from the previous case study, the presence of more than one frequency is responsible for the intermodulation effects, which results in more lobes than what was expected from the case of a single frequency. Intermodulation effects which are visible in the LS case are still visible in the FPCPS case.
4.2. Simulated data: QRS template
A more realistic numerical example in which the signal template p(t) is a real QRS complex is considered. Again, we considered the RR model containing two sinusoidal components reported in Eq. (14) with α1 = α2 = 0.07, f1 = 0.1 and f2 = 0.18 Hz.
The results are shown in Fig. (4). The HRV information carried by the cyclic frequencies α was close to the one reported in the previous examples, but, as expected, in this case, the CPS was richer in the spectral components. More in detail, the adopted QRS signal template p(t) was characterized by a much wider and complex spectrum in comparison with the Gaussian-shaped template considered in Section 4.1, and therefore the CPS shows several components up to f = 30Hz.
4.3. Real data
To validate the proposed numerical analysis, some real datasets from the Physionet repository have been considered [44]. Three different patients with physiological ECG were analysed (ID: 16272, 16483 and 16539) from the MIT-BIH normal sinus rhythm database [45]. It includes 18 long-term ECG recordings of subjects which were found to have had no significant arrhythmias. The people involved in this study include people aged from 20 to 50. Signals have been acquired with a sampling frequency equal to 128 Hz for a duration of 300 seconds.
As previously pointed out in Section 3, the ECG signals have been pre-processed by means of a band-pass filter and a derivative filter in order to emphasize the effect of QRS complex compared to the other waves. Then, the CPS of these signals was evaluated via Eq. (5) and reported in Fig, (5).
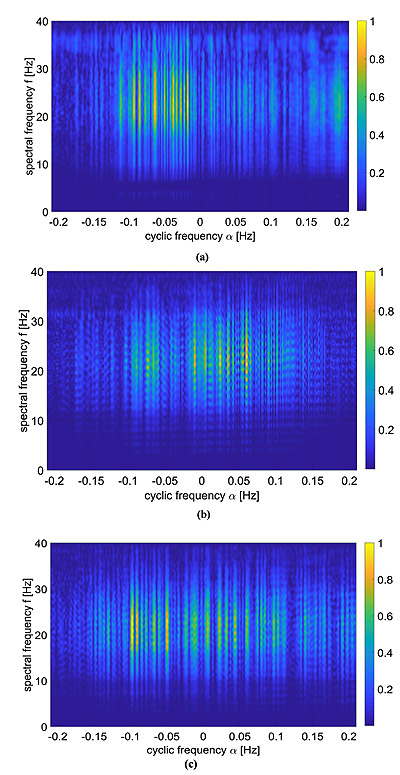
These kind of images provide both spectral information as well as cyclic spectral representation, but it is not easy to be interpreted as it is. A way to ease the analysis of this information lies in the use of Eq. (9), which is reported in Fig. (6) and compared with standard LS spectrum.
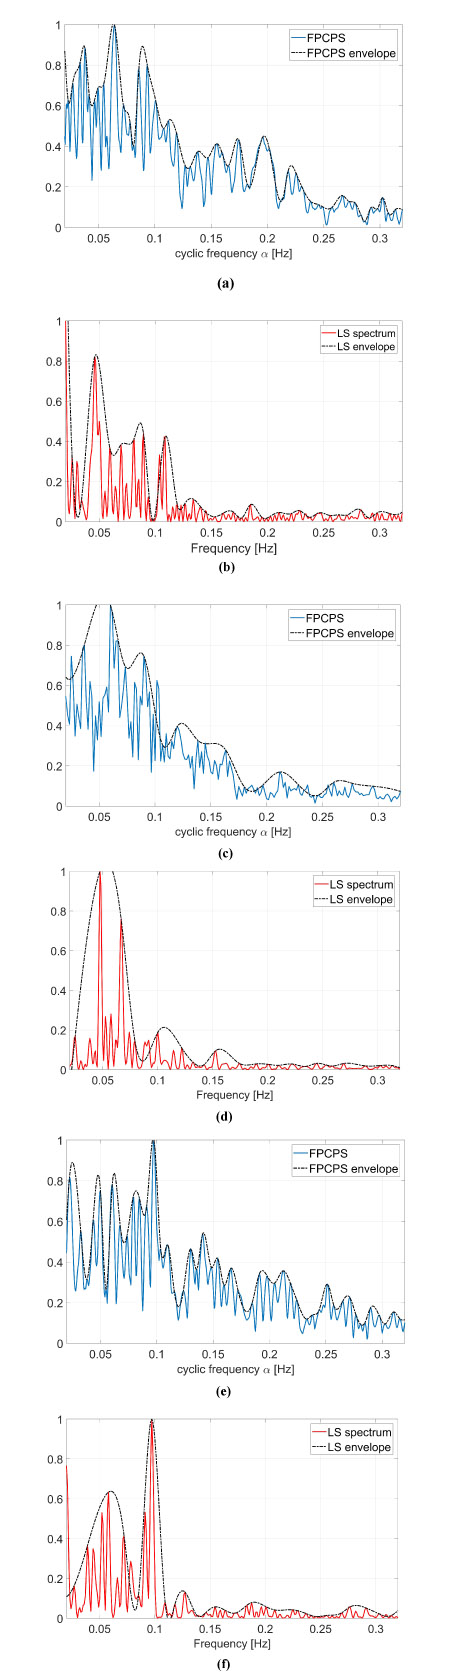
In the resting physiological subject, three main spectral components for the HRV analysis can be distinguished in short-term ECG recordings: Very Low Frequency (VLF), Low Frequency (LF) and High Frequency (HF). The distribution of the power and the central frequency of LF and HF are not fixed and may vary due to changes in the modulation by the autonomic nervous system [46], whereas the HF components, synchronous with the respiration, occurs at 0.25 Hz approximately. The study of VLF ( Hz) phenomena, which might contain clinically relevant information, requires long-period uninterrupted data; thus, the DC component and the whole range of the VLF have not been addressed in this manuscript, and therefore the frequency axis will be limited in the useful range (0.02-0-32) Hz. Both total power of HRV spectrum as well as the LF-to-HF ratio has proved to be selective indices of cardiac parasympathetic activity [44], and this motivates the interest in the study of these components.
In order to ease the analysis of the two-dimensional spectra proposed in Fig. (5), an easier and more straight comparison has been carried out via the evaluation of Eq. (9) and comparing these results with the standard LS spectrum. The proposed comparison has been reported in Fig. (6), in which the FPCPS per each patient is compared with the corresponding LS spectrum. From a first analysis, it can be observed that for all the considered cases, most of the signal power is located in the VLF and LF bandwidths. All the cases reported in Fig. (6) are characterised by a main lobe in the VLF range and by another strong contribution of around 0.1 Hz, both in the FPCPS as well as LS spectra. Conversely from the standard LS analysis, the FPCPS also underlines some non-negligible contributions in the HF bandwidth, but still fits with the clinical considerations arising from standard analysis of HRV LS spectrum. Hopefully, this apparent higher sensitivity to HF bandwidth could be beneficial in the early diagnosis of some pathological dysfunctions. However, further investigation is required to test the proposed formulation for pathological patients prior to clinical use.
CONCLUSION
In this paper, the performance of CS for HRV signal analysis has been evaluated. More in detail, the performance of a CPS estimator has been analysed and tested for synthetic numerical experiments with Gaussian function replica and ECG-like waveforms, proving a good agreement with the LS spectrum. Moreover, CS is also able to evaluate signal frequency components and does not require the RR interval extraction from the ECG signal.
Finally, CS analysis has also been conducted on real data, confirming the interesting performance observed numerically.
CONSENT FOR PUBLICATION
Not applicable.
CONFLICT OF INTEREST
The authors declare no conflict of interest, financial or otherwise.
ACKNOWLEDGEMENTS
Declared none.

