
maGUI: A Graphical User Interface for Analysis and Annotation of DNA Microarray Data
Abstract
Summary:
maGUI is a graphical user interface designed to analyze microarray data produced from experiments performed on various platforms such as Affymetrix, Agilent, Illumina, and Nimblegen and so on, automatically. It follows an integrated workflow for pre-processing and analysis of the microarray data. The user may proceed from loading of microarray data to normalization, quality check, filtering, differential gene expression, principal component analysis, clustering and classification. It also provides miscellaneous applications such as gene set test and enrichment analysis for identifying gene symbols using Bioconductor packages. Further, the user can build a co-expression network for differentially expressed genes. Tables and figures generated during the analysis can be viewed and exported to local disks. The graphical user interface is very friendly especially for the biologists to perform the most microarray data analyses and annotations without much need of learning R command line programming.
Availability and Implementation:
maGUI is an R package which can be downloaded freely from Comprehensive R Archive Network resource. It can be installed in any R environment with version 3.0.2 or above.
1. INTRODUCTION
A large number of microarray experiments are carried on microarrays developed by different manufacturers such as Affymetrix, Agilent, Illumina and Nimblegen and so on. The data generated from these experiments are in various formats and hence the pre-processing is different. Though R programming language [1] provides the most sophisticated software environment to analyze and annotate the microarray data, yet it is difficult for the biologists who are not familiar with the programming languages. Further, the available packages and softwares are restricted to either a single platform or to the extent of analysis, and also the manual processing and analysis of the data is a time consuming and tedious process, it is extremely important to develop an R package that integrates and simplifies the process of analysis and annotation of microarray data belonging to different platforms.
In the present study, “maGUI”, a graphical user interface (GUI) [2], is developed using gWidgets, tcltk and other packages of R to analyze and annotate the microarray data easily and more user-friendly. It integrates limma [3], affy [4], lumi [5, 6] and several other packages of bioconductor [7]. It enables the pre-processing of microarray data and identification of differentially expressed genes automatically. Further, the user can identify functional categories and pathways for different genes in the microarray data. Therefore, the GUI is very much useful in solving challenges arising during the analysis and annotation of DNA microarray data.
2. APPROACH
2.1. The maGUI User Interface
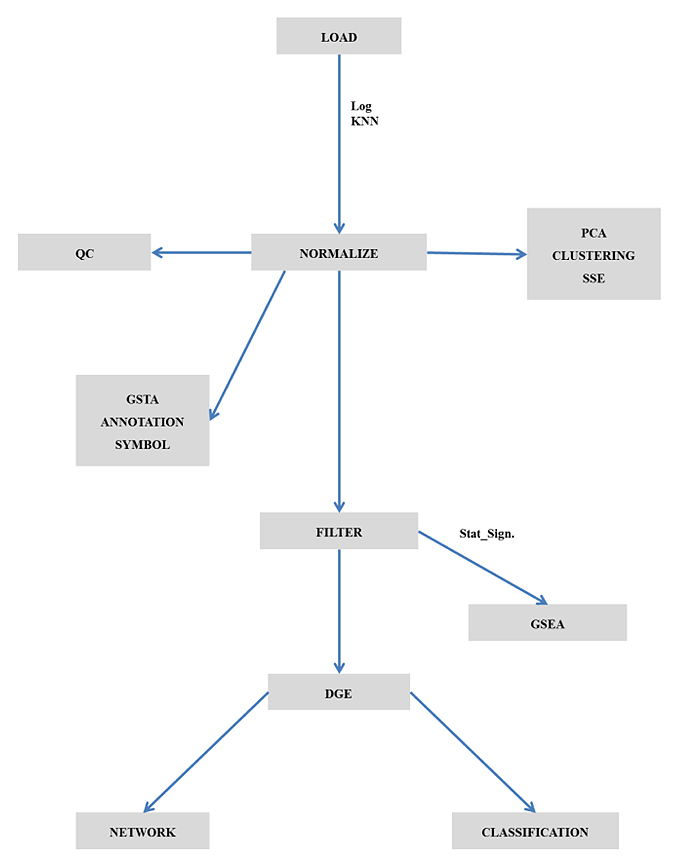
The maGUI package is available at Comprehensive R Archive Network (CRAN) repository and hence the GUI can be installed as any other R package. It provides the user with a graphical user interface on top of the normal graphical functions, allowing the user to interactively pre-process and analyze the microarray data easily and efficiently. The GUI consists of menus for pre-processing, analyzing, and annotating the microarray data, a container for hierarchical nature of tasks performed on any microarray data and a graphical region for viewing figures and tables that are generated during analysis and annotation of the microarray data. Fig. (1) represents the flow chart for the application of maGUI.
2.2. Pre-processing Microarray Data
Once the GUI is launched, the user can import the microarray data of various platforms from the file menu. The user can also load microarray SOFT file and series matrix file for the analysis. The loaded microarray data can be preprocessed and normalized from the preprocessing menu. The GUI utilizes different packages for quantile normalization such as limma, bead array [8] or lumi based on the microarray experimental platform. Quality assessment is made using quality control plots and box plots. Such data is used for clustering, classification, finding differentially expressed genes and so on from the Analysis menu.
2.3. Analysis of Microarray Data
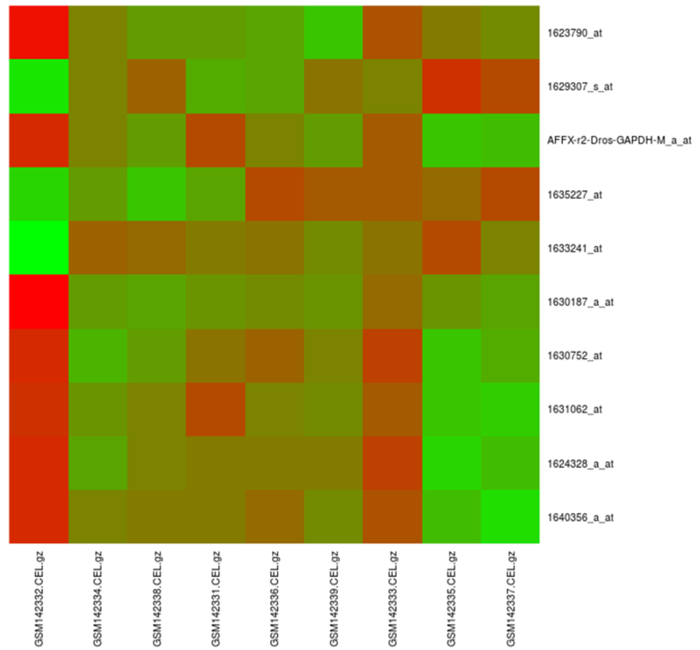
maGUI facilitates clustering of samples with Pearson correlation coefficient and complete linkage methods. It plots principal component analysis (PCA) using singular value decomposition method. The normalized data is filtered specifically providing control and test sample names of one or multiple groups. Alternatively, the user can choose for unspecific filtering with an expression filter or standard deviation filter. Both specific and non-specific filtering employs fitting linear model and empirical Bayes moderation provided by limma package. During filtration of data, genes with a p-value less than 0.01 are extracted and stored as statistically significant genes. Differentially expressed genes (DGE) are identified based on the number of groups in specific filtering or using unspecific filtered data. Further, the user can filter out the top differentially expressed genes with the log fold change value. Classification of data is performed based on the expression profiles of differentially expressed genes and can be viewed as a red and green color heat map. Such an analysis helps the user in not only describing the relationships between genes but also characterizing the specific molecular differences associated with them [9]. The following Fig. (2) is a heatmap of top 10 differentially expressed genes for the NCBI GEO [10] experiment number GSE6141, which was performed for the global analysis of the Drosophila NELF complex [11].
2.4. Gene Set Analysis
Expression data of the significant genes is combined with other knowledge to find the functional relevance of the genes. This is achieved through the enrichment of the genes under different biochemical pathways [12] and functional categories such as biological processes, molecular functions and cellular components [13]. In addition, all genes of the microarray data can be annotated to various GO domains and KEGG pathways through gene set test analysis. Both the gene set enrichment and test analyses can be performed from the Miscellaneous menu of the maGUI utilizing annotation databases [14, 15]. The source for these annotation databases is the Bioconductor [7], which is an open source and open development. With the maGUI package, the GO terms of any domain can be generated as graphs with yellow nodes representing the genes present in the current microarray data while white nodes as their parents. The KEGG pathways can also be generated as a graph using their KEGG IDs and inbuilt organism codes obtained from KEGG resource. In the KEGG graph, red-colored nodes represent up-regulated genes while green colored nodes represent down regulated genes. Nodes colored in grey are the genes present but are not differentially regulated in the current microarray data while white colored nodes are their parents. Thus, the maGUI helps not only in identifying gene regulations and pathways but also in making interesting biological interpretations from the microarray data [16].
2.5. Additional Features
The maGUI enables the user to perform and visualize sample size estimation with a 2 fold change which is critical in designing any microarray experiment. It also maps all the identifiers from normalized microarray data to their corresponding gene symbols using the annotation database. Further, it builds a co-expression network using the expression correlation of differentially expressed genes [17]. A network of such links helps in identifying genes associated with the disease state. The user can also identify protein-protein associations among all the genes in two different normalized microarray data using the correlation of co-expression profile of each gene [18]. Such protein associations play a major role in identifying various cellular and biochemical pathways.
2.6. Data Export
All the tables and figures generated during microarray data analysis such as clustering of samples, PCA, classification and so on can be visualized from the View menu and exported to local drives from the Export menu. Further, the images can be directly saved from the graphical region. Objects generated during microarray data analysis and annotation can be saved as an R data file.
2.7. Availability and Implementation
maGUI is an R package that can be freely downloaded from CRAN resource. It is associated with various other packages such as gWidgets, RGtk2, RSQLite and so on which will be installed along with the package in any R environment with version 3.0.2 or later. It is successfully tested on Linux, Windows and OS X operating systems. Reference manual of the package is available at https:// cran.r-project.org/web / packages/maGUI/maGUI.pdf. Tutorial documentation with examples for various applications of the maGUI can be downloaded from http:// bif.uohyd.ac.in/maGUI / maGUI_Tutorial.pdf.
CONCLUSION
maGUI is a user-friendly, cross-platform GUI for analysis and annotation of microarray data. It provides various features for efficient analysis and interpretation of the microarray data. It also relates genes to various knowledge-based databases to infer functional significance. The GUI is especially useful for the biologists who are not familiar with any programming language. The package is freely available at CRAN resource (https://cran.r-project.org/web/packages/maGUI/).
CONSENT FOR PUBLICATION
Not applicable.
AVAILABILITY OF DATA AND MATERIALS
The data supporting the findings of the article is available in the Comprehensive R Archive Network at https://cran.r- project.org/web/packages/maGUI/index.html reference number maGUI.
FUNDING
There was no specific funding for the study.
CONFLICT OF INTEREST
The authors declare no conflict of interest, financial or otherwise.
ACKNOWLEDGEMENTS
Authors would like to thank funding support from DST-PURSE, UPE to Department of Biotechnology and Bioinformatics, University of Hyderabad. DB is supported by UGC fellowship.

