
Complex Automatic Determination of Morphological Parameters for Bone Tissue in Human Paranasal Sinuses
Authors Info & Affiliations
Abstract
Introduction:
Application of automated analysis currently occupies a leading position in every field of science and technology.
The aim of our study was to provide a complex automatic determination of morphological parameters for bone tissue in human paranasal sinuses.
Materials and Methods:
The study involved 50 patients aged 20 to 60, male and female without signs of inflammatory or other pathological processes in the paranasal sinuses (PNSs).
Results:
Bone density in a high-contrast image of the section can be determined by fluctuations in colour intensity. Before cleaning, the image is blurred using the Gaussian function. As a result of this operation, the images become less clear and small details merge. An algorithm known as the Connie Border Detector has found widespread use.
The curves denoting the contours can run vertically, horizontally or diagonally at different angles. Detection of the direction of curves passing vertically and horizontally is not complicated, and for curves of the diagonal direction, the Sobel operator is used, with the vertical direction Gy and horizontal Gx as the value of the first derivative. Selection of areas of bone tissue requires the assessment of brightness gradient along the long side of the area. For clarity, this operation was shown graphically.
Conclusion:
Within the scope of this work, we have developed a method for an automatic comprehensive assessment of the morphological structure of the PNSs walls with the measurement of bone density and thickness.
1. INTRODUCTION
The development of technologies for medical image analysis that utilize computer vision algorithms for the assessment of scans is on high demand nowadays [1]. This approach is based on CT scans processing as an input data for further evaluation and decision-making.
Computed tomography, in particular, Spiral Computed Tomography (SCT), is one of the fastest growing research methods today. This research method is employed to quickly, accurately, informatively and non-invasively obtain a two- or even three-dimensional image of any anatomical region of the human body, draw conclusions about the presence or absence of abnormal changes, and describe in detail their localization and nature. It can even be employed in the examination of medical staff [2].
The widespread introduction of computed tomography in almost all branches of medicine has a positive effect on the accuracy of diagnosis of a number of diseases, but significantly increases the burden on medical staff. The method of manual calculation of indicators, examined on CT images, has become routine nowadays. Thus, interpretation of SCT scans requires significant time and effort from physicians. In this regard, there is a need to develop a basic algorithm to automate this process. Traumatology became one of the first branches of medicine where this task was successfully developed and implemented to interpret the condition of the bone tissue of long tubular bones. (The Mathworks Inc., Natick, MA) [3]. Attempts to automate the calculation of fetal bone parameters are also known [4]. Also of interest is the introduction of a method for automating the evaluation of images when working with scintigrams. There is a study [5] describing segmentation of images obtained in patients with prostate cancer, for which an algorithm was developed to automatically determine the presence of foci of metastatic nature throughout the human body.
There is a series of studies [6, 7], and [8] on evaluation of the volume of individual bones as well as measurement and visualization of cortical bone thickness. These studies refer to the manual approach, semi-automated and automated methods respectively. The measurement was based on voxel generation and segmentation, the segmentation was performed using MeVisLab V1.6 tool (MeVis Medical Solutions AG, Bremen, Germany) [6]. Moreover, the classifier, automatically separating all voxels labeled as “bone” into two classes “femur” and “tibia/fibula” was applied. In addition, there is a study [5] presenting a deep learning-based image interpretation system for skeleton segmentation as a novel approach for automated measurement of the bone scan index. However, the accuracy and duration of the measurement procedure in the above-mentioned researches are not suitable for measuring the skull bones in ENT field.
It should also be noted that despite the abundant amount of researches on the automation of the study of medical images, insufficient attention is paid to determine the structure and size of the skull bones. There are only a few studies dealing with this aspect. However, these studies take into account panoramic images, not tomograms [9] and there are no studies aimed at measuring bone density.
The evaluation and interpretation of medical images are of particular interest and importance in otolaryngology [10]. To date, ENT diseases, in particular, the nose and paranasal sinuses, rank a leading position among all diseases of the upper respiratory tract and have a steady upward trend. The number of both acute and chronic forms of rhino sinusitis, as well as the percentage of complications, are growing every year. Considering the inaccessibility of the ENT organs during examination, often only additional methods are employed to make a diagnosis [11, 12], thereby selecting the most effective method of treatment. However, the widespread introduction of SCT into the protocols for the diagnosis and treatment of ENT disorders entails a significant increase in the burden on the medical staff, which inevitably leads to inaccuracies and diagnostic errors [13, 14].
One of the most important structural parameters of the walls of the paranasal sinuses, which directly affect the occurrence and progression of inflammatory processes in the paranasal sinuses (PNSs), namely rhinosinusitis, are the thickness and density of the bone. Moreover, preliminary assessment of the bone thickness and density can be helpful in avoiding the development of further complications of rhinosinusitis.
Calculation of these indicators is a rather time-consuming process, taking a lot of time and efforts. In addition, the issue of the method and choice of the correct points for computing the values of the required indicators remains open.
Thus, automation of measurement for CT images of the paranasal sinuses is a promising method. Taking into account all of the above, the aim of our study was to develop a comprehensive method for automatic assessment of the morphological structure of the PNS’s walls, their thickness and density.
2. MATERIALS AND METHODS
The study involved the examination of 50 SCT scans of men and women aged 20 to 50 without ENT disorders, who underwent SCT procedures due to conditions not related to ENT diseases (unconfirmed stroke, etc.).
Spiral CT scanner Toshiba Aquilion 64, Japan, was used to obtain the scans. Toshiba Aquilion 64-slice is a new model in the portfolio of CT scanners of Toshiba Corporation (Japan), which utilizes state-of-the-art technological developments and provides a high-quality diagnosis with reduced radiation exposure.
Generally, image analysis has been an active research in many branches of medicine. It gives the possibility to obtain histological [15], roentgen or other images. It results in the development of a scientific computing program for obtaining adequate data for biomedical, epidemiological [16-18] studies.
The appropriate parameters were measured using the RadiANT DICOM viewer, which is widely used for the study of medical images [19-21]. It is employed for most accurate determination of the maximum and minimum values of parameters for bone thickness and density [22].
The first task was to define the minimum bone thickness. The maxillary sinus was chosen for the experiment as it is responsible for the maximum incidence of abnormal changes. It is characterized by maximum size, proximity of the location of the teeth and complexity of the location of the natural anastomosis with the nasal cavity. The upper wall is of particular interest due to the high risk of intra-orbital complications [23, 24].
The first part (Fig. 1) of the study is described in detail in the material [25].
Preparatory stage involved preliminary arrangement of CT images: areas of the maxillary sinus wall with a minimum thickness, coordinates of points with a minimum density on the Hounsfield scale [26]. A site of known length (25 mm) was marked on the SCT image for calibration.
The software analyzes the contour of the image, measures the image thickness, denoting bone tissue, setting the size of the image in required locations. As soon as an element of a predetermined size is identified in the image, automatic conversion to millimeters or other units is performed.
Thus, the measurement of bone thickness was not so complicated from the technical point of view. Density measurement caused many predicaments. The specified parameter is characterized by excessive variability in values. In this regard, it was decided to use a coordinate system for a more accurate calculation of density indicators.
For example, in the presented image (Fig. 2) the minimum value of the density index corresponds to the coordinates X: 156, Y: 264, as indicated in the lower left corner of the image. Similar points were found on all sections of the SCT in all cases under investigation.
Obviously, the measurement procedure for bone density at an arbitrary point should be divided into several steps. Firstly, it is necessary to determine the points of minimum (hereinafter referred to as the MIND) and maximum (MAXD)) density. The MAXD point is only needed to calibrate the range and does not provide useful information for the physician, so it is not marked on the images. Determination of the MIND point is associated with a number of difficulties. To begin with, let us consider the codification of information in the photo. The image is black and white with grayscale. The image contains a large amount of noise in the form of fragments of white stake on a black or gray background, or vice versa, fragments of black on a white or gray background.

Densitometric parameters of bones and other parts of the body are encoded by the brightness of the colour. Soft tissues have +40 units on the Hounsfield scale, bones +400 and above. Soft tissues have the appearance of dull areas on radiographs; bones are bright white. The transitions between tissue types are usually clear.
Images of bones located at different distances from the film or camera also differ in intensity. Images of bones located at a big distance can almost merge with the image of soft tissues.
Obviously, before processing, the photo should be cleaned from noise. The operation is described in many sources, in particular in another study [27-29], so we would like to focus on the main points. Before cleaning, the image is blurred using the Gaussian function, as described [30]. As a result of this operation, the images become less cleaned and small details merge.
The next step is to mark the contours on the image. From a human point of view, a contour is a visible edge that separates an object from the background. From the point of view of software, the contour is a curve along which there is a sharp change in brightness. The internal content of the object is not taken into account. If a distinct edge cannot be detected, or if the contours overlap, errors, such as incorrect contour selection, may occur.
The algorithm known as the Canny Edge Detector [31] has found widespread use.
The curves denoting the contours can run vertically, horizontally or diagonally at different angles. Detection of the direction of curves passing vertically and horizontally is not challenging. In order to identify the curves in the diagonal direction, the Sobel operator is implemented. The first derivative was calculated to detect the vertical direction Gy and the horizontal Gx.
These parameters allow us to obtain the angle of the direction of the contour boundary according to the expression Q = arctan (Gx / Gy). The angle of the boundary is rounded to one of four angles, which are vertical, horizontal, and two diagonals, such as 0, 45, 90, and 135 degrees.
For instance, for a 3x3 grid:
- If the angle of the gradient is zero, the point will be considered as a border; while its brightness is greater than the points above and below this point,
- If the angle of the gradient is equal to 90 degrees, the point will be considered the border, given that its brightness is greater than the points on the left and right,
- If the angle of the gradient is equal to 135 degrees, the point will be considered the border, while its brightness is greater than the points located in the upper left and lower right corners of this point.
Thus, it is possible to obtain an image that contains the boundaries of the contours.
The next step involves the removal of all the small contours containing noise. It has been experimentally proved that all contours smaller than 10x10 pixels can be considered noise for images of 512 by 512 pixels.
Here, there is a risk of accidental removal of small parts of the image, so the algorithm should be supplemented by analysis of the location of the contours (e.g., for overlapping contours which can potentially become one large contour).
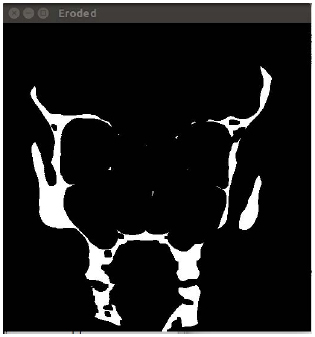
Binarization of the image with a certain threshold enables the detection of white areas that mark the bone tissue. The method of obtaining such an image and determining the type of tissue is described in another study [28]. Within the current research, the threshold was chosen empirically by the authors. The calculation of the optimal binarization threshold will be performed in our future studies.
After the selection of areas of bone tissue, it is necessary to provide the assessment of the brightness gradient along the long side of the area. For clarity, this operation is shown graphically.
From the brightness values at each point, an array is formed, in which it is easy to find the minimum and maximum points. The maximum value is not currently used, and the minimum means the area where bone density is the lowest.
It should be understood that it is determined not by absolute but by relative density. To determine the absolute density of the image, it is necessary to identify a region of predetermined density, for example, on the Hounsfield scale, or to have a table of the ratio of density-brightness of the image. The issue of determining the absolute density will be considered in further studies. Series of experiments will be performed to establish a calibration curve of density. For each given pixel of CT, a relative linear attenuation coefficient will be determined, then the value of the coefficient will be normalized to the reference material, in particular water. The obtained result will be multiplied by magnified constant, which depends on the CT scanner. The creation of the calibration curve for each scanner will allow us to quantify and minimize inter- and intrascanner variations and obtain the absolute density of CT image.
Python 3.10 programming language and additional Open CV library were used for image processing.
The next steps are performed according to the following algorithm:
(1) Image blurring using Gaussian function [25].
(2) Cleaning the image from noise [27-29].
(3) Creating a copy of the image of determining the areas of the minimum thickness of the thickness of the bones.
(4) Determining the minimum bone thickness areas.
(5) Creating a copy of the image to determine areas of minimum bone density.
(6) Determining the minimum bone density areas.
(7) Overlaying on the original image of the markers of minimum thickness and minimum density.
(8) Outputting of additional information, in particular relative or absolute thickness and density.
Information on bone density in areas of their minimum thickness (Fig. 3) may also be useful, so these figures are also derived.

3. RESULTS
To assess the accuracy of the method, several series of tests were performed on real images; the results are summarized in the table, showing calculated average and maximum error of the method.
The results of applying the method are shown in Table 1.
| SCT name | X auto | Y auto | X man | Y man | dX | dY | dL | % x | % y | Density, Hu |
|---|---|---|---|---|---|---|---|---|---|---|
| 1 | 2 | 3 | 4 | 5 | 6 | 7 | 8 | 9 | 10 | 11 |
| r1 | 276 | 238 | 278 | 241 | 2 | 3 | 3,61 | 0,72 | 1,26 | 54 |
| r5 | 182 | 96 | 181 | 104 | -1 | 8 | 8,06 | 0,55 | 8,33 | 30 |
| r6 | 336 | 559 | 324 | 555 | -12 | -4 | 12,65 | 3,57 | 0,72 | 23 |
| r7 | 250 | 440 | 251 | 438 | 1 | -2 | 2,24 | 0,40 | 0,45 | 142 |
| r12 | 168 | 310 | 165 | 315 | -3 | 5 | 5,83 | 1,79 | 1,61 | 127 |
| r13 | 340 | 249 | 339 | 266 | -1 | 17 | 17,03 | 0,29 | 6,83 | 28 |
| r17 | 368 | 383 | 370 | 391 | 2 | 8 | 8,25 | 0,54 | 2,09 | 86 |
| r18 | 332 | 242 | 334 | 250 | 2 | 8 | 8,25 | 0,60 | 3,31 | 52 |
| r19 | 74 | 256 | 53 | 191 | -21 | -65 | 68,31 | 0,00 | 0,00 | 73 |
| r23 | 159 | 329 | 160 | 333 | 1 | 4 | 4,12 | 0,63 | 1,22 | 62 |
| r24 | 373 | 585 | 369 | 593 | -4 | 8 | 8,94 | 1,07 | 1,37 | 245 |
| r25 | 13 | 268 | 13 | 267 | 0 | -1 | 1,00 | 0,00 | 0,37 | 61 |
| r29 | 223 | 437 | 222 | 437 | -1 | 0 | 1,00 | 0,45 | 0,00 | 41 |
| r30 | 263 | 335 | 263 | 339 | 0 | 4 | 4,00 | 0,00 | 1,19 | 209 |
| r31 | 276 | 305 | 277 | 294 | 1 | -11 | 11,05 | 0,36 | 3,61 | 256 |
| r36 | 138 | 250 | 130 | 241 | -8 | -9 | 12,04 | 5,80 | 3,60 | 294 |
| r37 | 101 | 170 | 96 | 181 | -5 | 11 | 12,08 | 4,95 | 6,47 | 263 |
| r38 | 68 | 67 | 68 | 68 | 0 | 1 | 1,00 | 0,00 | 1,49 | 76 |
| r42 | 42 | 247 | 43 | 250 | 1 | 3 | 3,16 | 2,38 | 1,21 | 263 |
| r43 | 4 | 313 | 4 | 313 | 0 | 0 | 0,00 | 0,00 | 0,00 | 76 |
| r44 | 311 | 284 | 311 | 290 | 0 | 6 | 6,00 | 0,00 | 2,11 | 175 |
| r48 | 37 | 278 | 37 | 278 | 0 | 0 | 0,00 | 0,00 | 0,00 | 35 |
| r49 | 164 | 506 | 167 | 509 | 3 | 3 | 4,24 | 1,83 | 0,59 | 333 |
| r50 | 6 | 233 | 2 | 244 | -4 | 11 | 11,70 | 66,67 | 4,72 | 249 |
Column SCT name indicates the name of the scan which was processed, column X auto shows the coordinate of the point of least bone thickness along the X axis, column Y auto along the Y axis, respectively. Columns X man and Y man indicate the coordinates of the point of smallest thickness defined by the operator manually.
Columns dX, dY and dL indicate the difference between the point defined by the software and the point defined by the operator on the X and Y axes, as well as the distance along the line.
Columns% x and% y show the same percentage.
Table 1 shows that in some cases the evaluation of the software and the operator coincides completely, in most cases the deviation is small, but there may be poor quality photo, which causes difficulties for the software.
Thus, it is noteworthy the strong discrepancy (68 pixels) between the evaluation of the software and the operator when processing photos R19. The discrepancy is caused by the low quality of the photo; in particular, the image is placed diagonally. Taking into account this image, the average deviation along the X axis is 8.6%, and 5.6% along the Y axis which, in the opinion of the authors, is quite acceptable for practical use.
In the case of culling a low-quality image, the average deviation along the X axis is 6.6%, and 3.7% along the Y axis.
4. DISCUSSION
To date, this study is the first to develop a method for automatic evaluation of human PNSs images. Despite the huge number of available investigations [4-6], concerning various areas of research, a single unified algorithm for automatic SCT diagnosis of the state of PNSs has not been developed yet. This study is of great medical importance; it is essential for understanding the development of pathological processes in PNSs and preventing their complications.
The area of human PNSs at this point in time is rather poorly understood. Perhaps, this fact is associated with many emerging intra- and postoperative complications [30]. In view of the small amount of knowledge about the PNS structure, most of the information is obtained by otolaryngologists in the course of diagnostic or therapeutic procedures, which does not bring positive effects.
Attempts have been made to study these values separately; however, in our opinion, only a comprehensive assessment will allow us to assess the real picture of the state of PNSs, to calculate the risks of rhinosinusitis and their complications.
Bone density has received too little attention today. There are only a few works devoted to this indicator and they were mostly carried out on animals [31] rather than on humans. However, the degree of density decrease can correlate with the degree of bone alteration, expressed in rarefaction and disappearance of trabeculae and focal sclerosis.
There is also a point of view about the relationship between destructive changes in the walls of the PNSs and a decrease in the minimum bone thickness.
However, it can be assumed that the simultaneous measurement of these indicators would be more informative.
Thus, this study helps to automatically measure the bone density of the walls of human PNSs according to SCT as accurately as possible. Moreover, it reduces the measurement time significantly compared to other methods. For instance, manual measurement requires approximately 180 s, the procedure of measurement according to the method presented in another study [5] takes 112 s, while the measurement time according to our method ranges from 3.5 to 9.3 s. One more advantage of the proposed method is the ability to obtain data from previously taken images, which makes it possible to track the time course of changes in the densitometric parameters of the patient's bones.
The developed method can be useful not only for PNSs, but also in dentistry to diagnose disorders of neighboring soft tissues [32] or even processes of reparation [33] and predict complications of some diseases [34, 35] for cohort study [36, 37].
Experiments have also shown that the output of information is sometimes superimposed, making it a little tricky in terms of perception. The developers have identified several ways to overcome this disadvantage, in particular, the definition of the minimum information areas in the image and the output of information to them, or a switch that can turn off the output of information in part or in full. The optimal solution regarding the ergonomics is planned to be defined after implementation of methods in practice and interviewing of a focus group of medical doctors and other users of the software.
This study is a continuation of our previous work aimed at studying and detailing the structure of human PNSs. Earlier attempts were made to calculate the uncertainty of the values of morphological parameters of the walls of the PNSs and the ostiomeatal complex [38, 39] both in physiological conditions and during the development of abnormal processes in them. The obtained results were validated on the 3D model of the PNSs and ostiomeatal complex built by authors and during the subsequent measurement of the pressure in the anastomosis
The developed method can help save time and facilitate the daily routine of medical personnel, which means that, as soon as possible, accurately and effectively determine the structural features of the PNSs.
CONCLUSION
Within the scope of this study, we have developed a method for an automatic comprehensive assessment of the morphological structure of the PNSs walls with the measurement of bone density and thickness. The obtained results make it possible to provide an automatic, accurate and informative assessment of the main indicators of the bone tissue structure of the PNSs walls. Today, this method can be optimal in the study of CST of the PNSs, as it will allow to exclude operator error when assessing the state of the PNSs, to prevent the development of complications of inflammatory processes and reduce the risk of injury during surgical interventions. Our future research will be related to the development of algorithm for automatic identification of paranasal sinuses` areas with minimal density and thickness as a sign that leads to the development of intracranial or intraorbital complications.
AUTHORS' CONTRIBUTIONS
Labaratory Practices: Alina Nechyporenko, Radiy Radutny.
Concept: Victoriia Alekseeva, Ganna Titova.
Design: Alina Nechyporenko, VitaliyGargin.
Data Collection or Processing: Victoriia Alekseeva, Ganna Titova.
Analysis or Interpretation: Vitaliy Gargin, Radiy Radutny.
Literature Search: Ganna Titova, Radiy Radutny.
Writing: Victoriia Alekseeva, Alina Nechyporenko, Vitaliy Gargin.
ETHICS APPROVAL AND CONSENT TO PARTICIPATE
The study was approved by the Commission on Bioethics of Kharkiv National Medical University (Nº 5 of 11.11.2019).
HUMAN AND ANIMAL RIGHTS
No animals were used in this research. All human research procedures were followed in accordance with the ethical standards of the committee responsible for human experimentation (institutional and national), and with the Helsinki Declaration of 1975, as revised in 2013.
CONSENT FOR PUBLICATION
Аll patients under the investigation gave their voluntary consent to participate in the study.
AVAILABILITY OF DATA AND MATERIALS
The data supporting the findings of the article is available within the article.
FUNDING
None.
CONFLICT OF INTEREST
The authors declare no conflict of interest, financial or otherwise.
ACKNOWLEDGEMENTS
Declared none.

