
Use of Two Complementary Bioinformatic Approaches to Identify Differentially Methylated Regions in Neonatal Sepsis
Authors Info & Affiliations
Abstract
Background:
Neonatal sepsis is a heterogeneous condition affecting preterm infants whose underlying mechanisms remain unknown. The analysis of changes in the DNA methylation pattern can contribute to improving the understanding of molecular pathways underlying disease pathophysiology. Methylation EPIC 850K BeadChip technology is an excellent tool for genome-wide methylation analyses and the detection of differentially methylated regions (DMRs).
Objective:
The aim is to identify DNA methylation traits in complex diseases, such as neonatal sepsis, using data from Methylation EPIC 850K BeadChip arrays.
Methods:
Two different bioinformatic methods, DMRcate (a supervised approach) and mCSEA (an unsupervised approach), were used to identify DMRs using EPIC data from leukocytes of neonatal septic patients. Here, we describe with detail the implementation of both methods as well as their applicability, briefly discussing the results obtained for neonatal sepsis.
Results:
Differences in methylation levels were observed in neonatal sepsis patients. Moreover, differences were identified between the two subsets of the disease: Early-Onset neonatal Sepsis (EOS) and Late-Onset Neonatal Sepsis (LOS).
Conclusion:
This approach by using DMRcate and mCSA helped us to gain insight into the intricate mechanisms that may drive EOS and LOS development and progression in newborns.
1. INTRODUCTION
Epigenetics encompasses all mechanisms that control the gene expression pattern without altering the DNA sequence itself, which participate in cell development and differentiation, lineage identity and transcriptional regulation. These mechanisms include DNA methylation (DNAm), histone post-translational modifications and non-coding RNAs (ncRNAs) [1-3]. As they play an important role in modulating gene expression, changes in the epigenetic program lead to the alteration of biological processes underlying different diseases, contributing to disease onset and progression. Therefore, the study of epigenetic traits through Epigenome-Wide Association Studies (EWAS) can be useful to understand the underlying mechanisms of diseases, contributing to the development of a new strategy of diagnosis and prognosis by means of epigenetic biomarkers. In particular, DNA methylation consists of the addition of a methyl group to the fifth carbon position of cytosines (5mC) and almost exclusively at cytosine-guanine dinucleotides (CpG), which has been mostly associated with transcriptional repression. Methylation marks occur across the genome, mainly at promoter regions, intergenic regulatory regions transposable elements or enhancers and within the body of genes.
The present study aims to propose an analysis strategy to identify DNAm traits in neonatal sepsis using Illumina Infinium Methylation EPIC 850k BeadChip array data for identifying not only differentially methylated CpGs (DMCs) but also differentially methylated regions (DMRs). Notably, the clinical importance of DNAm patterns relies on contiguous methylated CpGs that conform a DMR rather than single CpG sites [4-6]. The identification of DMCs is performed by means of the standard differential analysis, while the discovery of DMRs entails a greater complexity because they integrate the methylation data of consecutive CpGs, and in some cases, an accurate FDR control is non-trivial. Different methods have been implemented to date, which are classified in two general approaches: 1) supervised methods, which look for de novo DMRs without considering previous annotations, and 2) unsupervised methods, which test for DMRs in predefined genomic regions (e.g., genes, promoters and CGIs) [4, 7].
Neonatal sepsis is an important health-care concern worldwide, occurring more frequently in premature newborns [8]. Neonatal sepsis is known to be conditioned by both genetic and epigenetic factors [9]. Very-low-birth-weight (VLBW, <1500 g birth weight) neonates are at high risk for both early- and late-onset sepsis (EOS and LOS, respectively), especially in infants at neonatal intensive care units [8]. The septic process is characterized by both pro-inflammatory and anti-inflammatory responses and both innate and adaptive immune systems responses happening simultaneously [10, 11]. Given the complexity of the pathophysiology, a holistic approach of the molecular, cellular and metabolic events in neonatal sepsis will accelerate the development of new biomarkers for accurate diagnosis and improvement of the clinical management and diagnosis, which remain a challenge for neonatal intensive care units [12]. Moreover, previous studies have indicated that epigenetic mechanisms play a role in the immune system impaired response characteristic of sepsis [13, 14], suggesting that epigenetics can improve our understanding of the disease and the discovery of novel diagnosis and prognosis approaches.
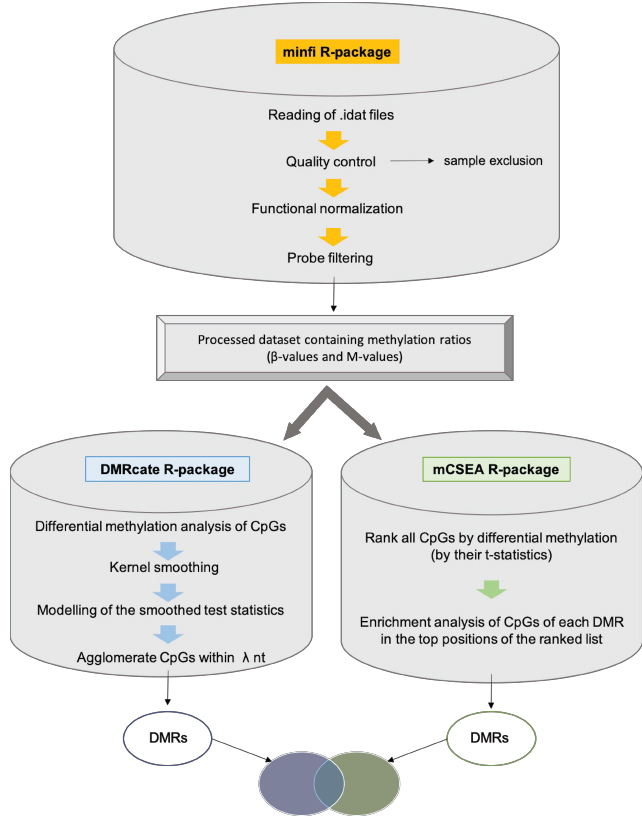
Since the concurrence of numerous cellular processes in neonatal sepsis hinders the discovery of useful biomarkers in this type of complex disorders, two different bioinformatic methods have been used in order to reveal differential methylation patterns: DMRcate, a supervised method with high precision, and mCSEA, an unsupervised method with high sensitivity (Fig. 1). In this work, we used both approaches (DMRcate and mCSEA) to find DMRs, which help to identify relevant pathways underlying molecular events occurring in complex disease, particularly in our study in neonatal sepsis, and in turn, propose reliable epigenetic markers. Furthermore, EOS samples and LOS samples were also analyzed for differential methylation with the aim of elucidating differences between both types. Lastly, we have also obtained a reliable set of DMRs as candidates by overlapping the results of both methods, which may be validated by other experimental approaches. Taking together all these results, the study of epigenetic traits will help us to give insight into the mechanisms that drive sepsis development and progression, contributing to the discovery of epigenetic markers for diagnosis and prognosis in complex disorders such as neonatal sepsis. It is noteworthy, that despite there are numerous biomarkers that have been evaluated for early detection of neonatal sepsis, till date, there is no single ideal biomarker that fulfills all essential criteria for being an ideal biomarker for neonatal sepsis [15]. The methodology of processing and differential methylation analysis of EPIC data detailed here can serve as a useful resource for application in different diseases with the aim of detecting DMRs.
2. MATERIALS AND METHODS
2.1. Experimental Design
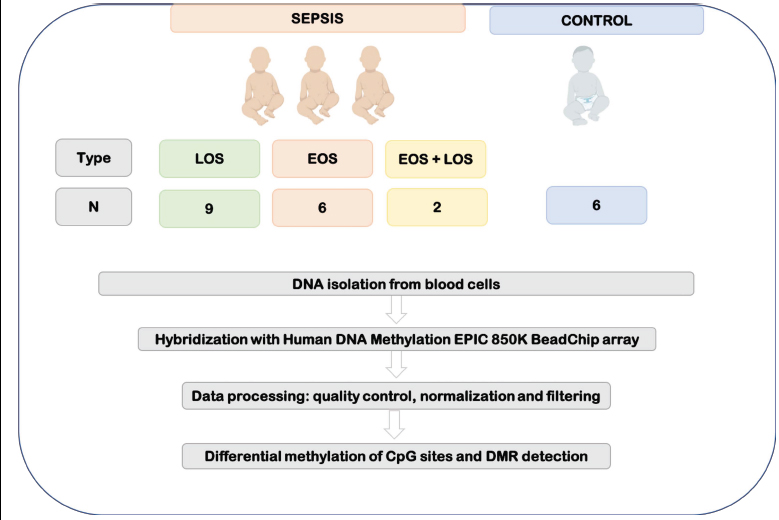
Biological samples from preterm infants (≤ 32 weeks of corrected gestation age) were collected as part of the study protocol from a global project under the title “Omics applied to the diagnosis of bacterial sepsis during the neonatal period” performed at the Division of Neonatology of the University and Polytechnic Hospital La Fe (Valencia, Spain) and granted by the Instituto de Investigación en Salud Carlos III (PI18/01292). This is a prospective observational study whose study protocol followed the stringent recommendations of the Spanish Neonatal Society and was approved by the Institutional Review Board of our hospital (Comité de Ética e Investigación Médica) with the protocol number 2019/099 and also registry number 2020-383-1. Informed consent was signed by the parents of all participants. Recruitment protocol has been extensively described in the previously published article [16]. Samples from 23 neonates were collected at 5-7 days after birth. Patients who met early-onset (EOS) and late-onset (LOS) sepsis criteria according to the criteria of Töllner [17] and Goldstein [18] were included in the study. Concretely, nine patients were diagnosed with LOS, six patients with EOS, and two patients with EOS and LOS. In order to perform the differential analysis, six healthy preterm neonates with similar gestational and postnatal ages and perinatal characteristics but free of infection and without suspicion of sepsis were used as controls (Fig. 2).
Standard blood cultures led to the identification of LOS (hospital-acquired infection) when there was a positive culture. However, the diagnosis of EOS (caused by pathogens transmitted from mother to infant before or during delivery) required a positive peripheral smear culture, suggestive symptoms and/or an increase of C-reactive protein or IL-6. Because sometimes blood culture renders negative due to the low blood volume available, sometimes the diagnosis of sepsis is set as “clinical sepsis” instead “culture-positive sepsis”. Clinical sepsis is characterized by the presence of evident clinical signs that can be or are not accompanied by changes in acute phase reactant biomarkers such as CRP, IL-6 or PCT. As these criteria are not mutually exclusive, two preterm neonates were diagnosed with EOS and LOS. More information about the characteristics of patients included in the study can be found in our previous work by Lorente-Pozo et al. [19].
2.2. Samples
Blood (0.5 mL) was sampled using a heparinized syringe after admission to the NICU. Blood was centrifuged (1500g × 10 minutes) at 4°C to separate plasma from the cell pellet. Cell fractions were stored at -80°C until processed.
2.3. DNA Extraction
Total DNA was isolated from the cell pellet with All-In-One DNA/RNA Miniprep Kit (BS88203, Bio Basic Canda Inc, Canada) following the manufacturer’s instructions. Purified DNA was quantified with NanoDrop, quantified by the fluorometric method (Quant-iT PicoGreen dsDNA Assay, Life Technologies, Carlsbad, California), and assessed for purity with NanoDrop (Thermo Scientific, Waltham, Massachusetts) 260/280 and 260/ 230 ratio measurements. The DNA integrity of fresh frozen samples was checked by electrophoresis in 1.3% agarose gel.
2.4. DNA Methylation Profiling using Illumina EPIC 850k Array
The measurement of the methylation levels on the 23 samples was performed by means of the Infinium Human DNA Methylation EPIC 850K BeadChip arrays (Illumina Inc, San Diego, California) which interrogates over 850.000 CpG sites across the genome, being a powerful technology for EWAS studies and improving the coverage of the previous platform (HumanMethylation450K), mainly in important regulatory regions. Probes of the EPIC Bead Chip are designed so that they cover the following regions: gene promoters (200-1500 bp upstream of TSS), 5’ UTRs, 3’ UTRs, first exon, gene bodies and intergenic regions, including regulatory regions identified by the ENCODE and FANTOM5 projects.
The Human Methylation 850K EPIC BeadChips require the bisulphite treatment of genomic DNA followed by a whole genome amplification step, enzymatic endpoint fragmentation, precipitation and resuspension. The processed samples are then hybridized (at 48°C for 16 hours) on the bead array containing the 50-bp probes complementary to the CpG locus. After washing away unhybridized and non-specifically bound DNA, a single nucleotide extension using nucleotides labelled with biotin (ddCTP and ddGTP) and 2,4-dinitrophenol (ddATP and ddTTP) was performed. Repeated rounds of staining were performed with a combination of antibodies that differentiate DNP and biotin by fixing them with different fluorophores. Finally, the BeadChip was washed and protected to scan it on an Illumina HiScan SQ scanner (Illumina Inc, San Diego, California).
2.5. Data Processing: Quality Control, Normalization and Filtering
Data processing, as well as the differential methylation analysis, were performed using house-made R scripts, using the following Bioconductor packages: minfi (version 1.32), limma (version 3.42.2), DMRcate (version 2.0.7) and mCSEA (version 1.6.0). Moreover, the annotation data for the Illumina HumanMethylationEPIC array is contained in the Bioconductor AnnotationData package IlluminaHumanMethylation EPICanno.ilm10b4.hg19, as well as the IlluminaHumanMeth ylationEPICmanifest, which need to be loaded in the R environment. The code is available as Supplementary Material.
The raw data obtained from the Illumina EPIC methylation array consists of two .idat files per sample, which store the intensities for each probe in binary format, each file corresponding to the two different channels (red and green). The .idat files of the 23 samples were deposited on Gene Expression Omnibus (GEO) with the number GSE155952. In the first script (MethylationDataProcessing.R), the minfi R-package was used to read the .idat files, assess their quality, perform the normalization and the exclusion of probes that may interfere in the posterior analysis [20].
First, the reading of the raw data was performed, obtaining a ‘RGChannelSet’ object in which the data is organized at probe level in both red and green channels. For the reading of .idat files, minfi R-package requires a csv samplesheet which is based on a samplesheet provided by Illumina and must contain one sample per line and the following columns describing pheno-data in order: Sample_Name, Sample_Well, Sample_Plate, Sample_Group, Pool_ID, Sentrix_ID, Sentrix_position and Basename. The column ‘Basename’ must contain the absolute path to the .idat file, including the name of the file: sentrix ID + “_” + sentrix position.
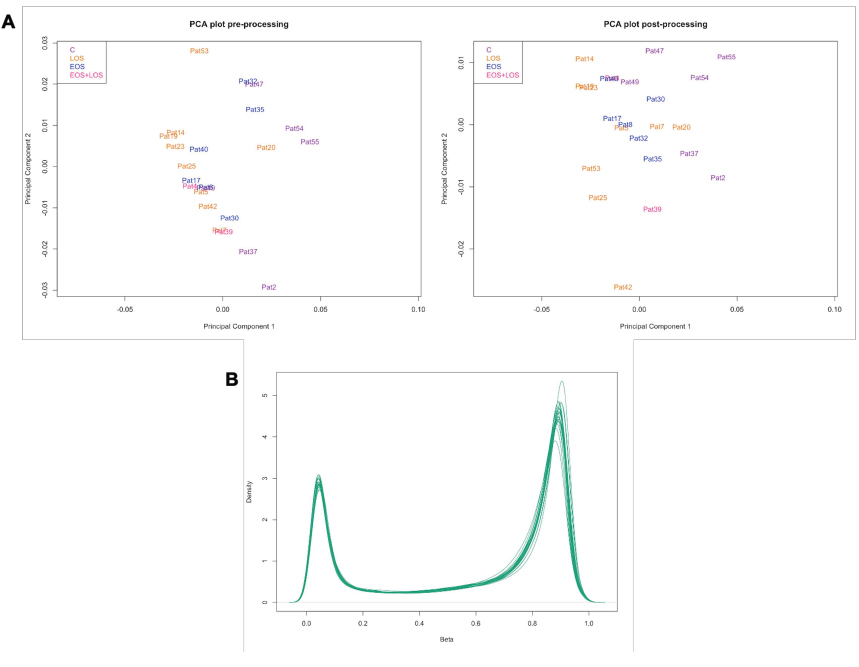
Afterwards, a quality control report was generated, in which the density plot shows the distribution of the beta values per sample (Fig. 3). The quality of the signal is assessed by the detection p-value at each CpG, and by calculating the mean detection p-value among probes in each sample, the quality of each sample can be evaluated, identifying poor quality samples that will be excluded from the analysis using a detection p-value cutoff of 0.05, where higher p-values indicate unreliable signal so that samples with a p-value greater than 0.05 are removed.
The normalization was then performed, by means of the functional normalization method for Illumina methylation arrays, a between-array normalization which removes unwanted technical variation by regressing out variability explained by the control probes present on the array [21]. The output is a ‘GenomicRatioSet’ object. This GRSet is organized at CpG locus level, contains two channels -beta values and M-values- and it is mapped to the genome. Beta-values, which range from 0 to 1, are widely used to measure the percentage of methylation; while M-values are the log2 ratio of the intensities of methylated probe versus unmethylated probe (logit transformation of the beta-values).
The filtering step comprises the removal of probes with poor detection p-value (>0.01) in any of the samples which may be unreliable, CpGs located at the sexual chromosomes Y and X, which introduce variability that may alter the differential analysis, probes known to have common SNPs that may affect the CpG sites and cross-reactive probes [22] which map multiple locations in the genome, therefore resulting in spurious signals which can lead to invalid conclusions in downstream analyses.
2.6. Differential Methylation Analysis of CpG Sites
DMCs were identified by means of the linear model for differential analysis using limma [23] between the following clinical groups: neonatal sepsis versus control individuals, LOS compared to control individuals, EOS compared to control individuals and LOS compared to EOS patients. The significance threshold selected for the False Discovery Rate (FDR), adjusted by Benjamini-Hochberg correction (BH), is 0.05. Importantly, the methylation measure that should be used for the differential analysis of methylation levels are M-values, which have been described as more statistically valid for significance testing [24].
2.7. DMR Detection
As we discussed previously, in order to identify DMRs, we used two packages, DMRcate and mCSEA, which use different approaches: DMRcate is a supervised method, while mCSEA is an unsupervised method. The identification of DMRs is performed by the scripts dmrcateAnalysis.R and mcseaAnalysis.R. Supervised methods consist of a first step in which a statistic is computed for each CpG (t-statistic or corresponding p-value), and a posterior step where differential CpGs in consecutive genomic regions are identified, in which previous annotations are not considered, and therefore, they look for DMRs de novo. Conversely, unsupervised methods analyze predefined regions, previously grouping CpG sites into genomic regions. Both methods -DMRcate and mCSEA- apply limma to fit the linear model (23), in the case of DMRcate obtaining the differentially methylated CpGs, and in the case of mCSEA, a ranked list of all CpGs according to their differential methylation (t-statistic), and not only the significant CpG sites.
DMRcate [5] is a data-driven approach where intergenic CpGs that lack a gene or promoter annotation are also considered, being able to detect differential methylation at enhancers and other regulatory regions in addition to annotated genes and promoters. DMRcate identifies chromosomal coordinates by collapsing contiguous differentially methylated CpGs that are within lambda nucleotides from each other. Firstly, we performed a standard linear modelling of CpGs using the clinical groups obtaining a t-statistic per CpG site which evaluates the methylation difference between the groups for that CpG and keeping the significant DMCs for the next step of DMR detection. Then, a Gaussian kernel smoothing was applied to the squared t-statistics (Yi = ti2) of CpGs separated by chromosome. The squares of the t-statistics, which are unsigned, are used with the aim of combining genomically nearby CpG site effects without considering the direction of effect (hyper- or hypomethylation) and allowing the identification of DMRs where the methylation is influenced by CpG landscape. Kernel smoothing [25] is a nonparametric approach in which data points are averaged with their neighbors in a series, redistributing mass around an observation according to two settings: A kernel function, which is a symmetrical probability density function, and a bandwidth, which is the maximum distance from the kernel’s center at which mass is spread. The Yi metric is smoothed within a given window or bandwidth (lambda parameter) which correspond to the distance in nucleotides between the significant CpG probes. Afterwards, the smoothed test statistics are modeled by the Satterthwaite method [26], computing p-values. Then, these p-values are adjusted by BH correction to control the False Discovery Rate [27], and finally, DMRs are defined by collapsing groups of the remaining CpG sites that are within lambda nucleotides. The parameters used for the implementation of DMRcate in the present analysis were a lambda of 1000 nucleotides and a scaling factor for bandwidth of 2.
DMRcate is a popular approach, which shows good performance and has proven to be useful and reliable, with a good precision, a controlled type I error rate (small false positive rate), and fast execution times [4]. However, DMRcate method lacks power, especially for small effect size, in other words, to detect DMRs with real effect as true positives when methylation changes are small [4]. Complex diseases are characterized by small methylation differences between phenotypes (<10%), so a sensitive DMR detection tool is needed to analyze the changes among neonates with sepsis to discover differences between LOS and EOS. With this purpose, in addition to DMRcate we used a novel approach based on mCSEA (methylated CpGs Set Enrichment Analysis), which focuses on detecting subtle methylation changes with a consistent pattern among the different phenotypes analyzed.
mCSEA [28] is an unsupervised method where CpGs are previously annotated to predefined regions (genes, promoters and predefined regions). It is based on the Gene Set Enrichment Analysis (GSEA) method to identify DMRs from Illumina Infinium 450K and EPIC array data, where gene sets are defined as sets of CpG sites in predefined regions for DMR finding. First of all, limma is used to fit a linear model, obtaining a list of all the CpG probes sorted by their t-statistic or differential methylation. mCSEA applies a weighted Kolmogorov-Smirnov (KS) statistic to the t-statistic metric to calculate an Enrichment Score (ES) for each DMR. Basically, it is calculated running through the entire ranked list of CpGs, increasing the score when a CpG in the region is encountered and decreasing the score when the CpG encountered is not in the analyzed DMR. Hence, it evaluates the enrichment of CpG sites belonging to the same region in the top positions of the ranked list. The significance of each set is calculated by permuting the sets and recomputing ES. Finally, DMRs are retrieved by selecting a threshold of 0.05 for the adjusted p-value (BH corrected). The mean beta difference for each region is not implemented in the mCSEA package, so it was calculated in the mcseaAnalysis.R script as the mean of the beta differences of its associated CpGs between groups.
3. RESULTS AND DISCUSSION
3.1. Quality Control of the Raw and Processed Data
When exploring the quality of the samples before processing, the mean detection p-value of all samples was smaller than the selected cutoff of 0.05, which is indicative of the good quality of the signal, outlining the good quality of all the samples in terms of overall signal reliability, without the need of removing any of them from the analysis (Fig. 3A). In addition, the quality control report of raw data showed an expected per-sample distribution of beta-values, which is bimodal with one peak around 0.1 and another peak around 0.9 representing unmethylated and methylated probes. The density plot of beta values after the normalization maintains the same distribution, although cleaner (Fig. 3B).
The exploration of data before and after the processing was performed by a PCA analysis (Fig. 3A), which shows that samples tend to separate between sepsis and control samples with some overlap. LOS samples exhibit the greatest separation from control samples, while EOS samples are closer to controls.
Regarding probes, a total of 774.920 probes of 865.859 passed the four filtering steps. Only 3.224 were removed due to a low-quality signal (or detection p-value higher than 0.01 in any of the samples). The rest were sex-related probes (19.152), SNPs (29.039) and cross-reactive probes (39.524).
3.2. DMR Finding Approaches
As hypothesized, DNA methylation is altered in preterm neonates suffering from sepsis not only at the CpG level but also at the region level.
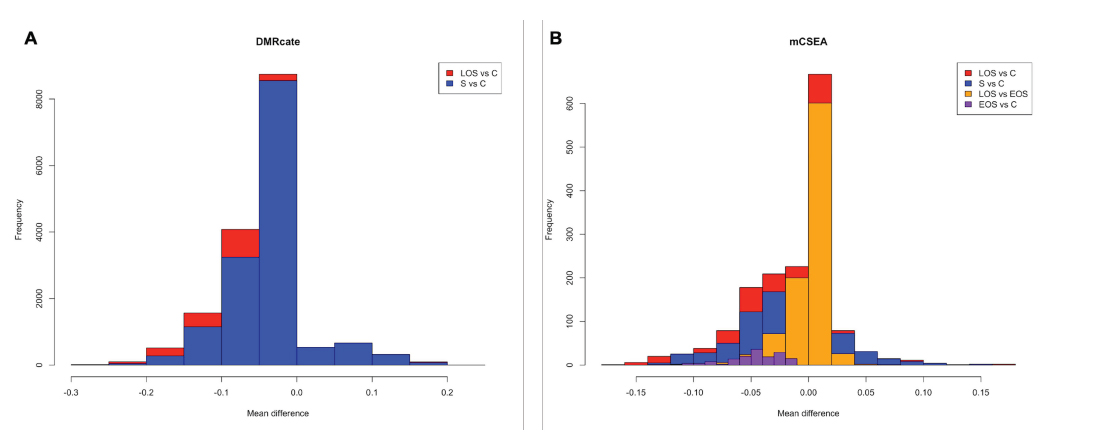
Both DMR detection methods, DMRcate and mCSEA, are complementary. The first tool allowed us to detect a wide range of de novo DMRs. In fact, DMRcate yields a greater number of DMRs among comparisons for neonatal sepsis versus controls, with 14.846 regions, and LOS versus controls, with 16.303 regions (Fig. 4A). As it is a supervised method, it allows the detection of intergenic regions as well as other not predefined regions in which more than one gene can be annotated because of their short sequence, for instance, which are not detected by mCSEA method. Besides looking for de novo genomic annotation, DMRcate is agnostic to the direction of the differential methylation signal, meaning it spatially fits nearby significant CpGs without regard to the direction of effect (hyper- or hypomethylation). This DMRs finding approach is useful when there are contiguous differential CpGs but is not able to obtain DMRs between conditions with small effect sizes when limma does not return differential probes with the specified threshold, as occurs in the LOS versus EOS and EOS versus control comparisons.
On the other hand, mCSEA revealed DMRs exhibiting small and consistent methylation changes, as it occurs in the LOS versus EOS comparison and the EOS versus control comparison (Fig. 4B) mCSEA detected 1.170 DMRs in the sepsis versus control comparison and 1.587 DMRs in the LOS versus control comparison. More importantly, thanks to the sensitivity of mCSEA, we were able to discover regions with smaller differences between conditions whose CpGs exhibit subtle differences, which are not detected by limma as differential, with consistency along relatively large regions, which are predefined. Due to this, the only mCSEA is able to detect changes between EOS and control individuals, with 152 regions, and between LOS and EOS, with 938 regions.
After overlapping the DMR sets obtained in mCSEA and DMRcate, 302 promoters and 108 genes were found to be hypomethylated and 143 promoters hypermethylated (beta differences (>10%)) when compared neonatal sepsis (EOS and LOS) to control neonates. These results were presented in a recent work we published. Among promoters and genes with differential methylation we found those involved in immune cell differentiation and T-cell activation (i.e. LRG1, CD300LB, CD3G, CD3D, TXK, UBASH3, SIT1), immune response (i.e. PRTN3, LTA) and inflammation (i.e. TREM1, LTA); and immunosuppression and anti-inflammatory responses (e.g. S100A8, IL10) [19]. Furthermore, DMR sets obtained using both, mCSEA and DMRcate methods, for sepsis vs. control comparison provided similar GO biological processes related to immune response. In this regard, after the overlapping of the DMRs for genes and promoters, obtained with mCSEA and DMRcate, we found the enrichment of hypermethylated regions in T-cell activation and T-cell differentiation, among other relevant GO terms which demonstrate the scarce immunoreactivity of T cells in neonates suffering from sepsis [19].
The overlap of both DMR sets resulted in a reliable set of regions, which are differentially methylated between the conditions and can be selected for a posterior validation analysis. The early diagnosis of neonatal sepsis requires biomarkers that are quick, sensitive, specific and affordable. With this purpose, further research should focus on the validation of specific differentially methylated regions, which may lead to the discovery of novel diagnostic or predictive biomarkers for neonatal sepsis to provide better clinical management of the disease and in the end, improve neonatal outcomes.
CONCLUSION
The present work offers a comprehensive resource for application in DMR detection in complex diseases, such as neonatal sepsis, with the aim of exploring a wide range of regions. Both methods proved useful for differential methylation analysis because, on the one hand, DMRcate overcomes mCSEA in precision, and on the other hand, mCSEA has better sensitivity. Therefore, they can be used in a complementary manner. Furthermore, the use of both methods allows the overlap of DMRs with the objective of improving the reliability of the findings. We propose that this methodology can be used in other clinical outcomes in order to identify more accurately methylation patterns involved in complex diseases.
ETHICS APPROVAL AND CONSENT TO PARTICIPATE
Blood samples from neonates were obtaioned after the study was approved by the Institutional Review Board of our hospital (Comité de Ética e Investigación Médica) with the protocol number 2019/099 and also registry number 2020-383-1.
HUMAN AND ANIMAL RIGHTS
No animals were used in this research. All human research procedures followed were in accordance with the ethical standards of the committee responsible for human experimentation (institutional and national), and with the Helsinki Declaration of 1975, as revised in 2013.
CONSENT FOR PUBLICATION
Informed consent was signed by the parents of all participants.
AVAILABILITY OF DATA AND MATERIALS
Not applicable.
FUNDING
This work was supported by the AES2018 (ISCIII) with grant number PI19/00994, co-financed by the European Regional Development Fund (ERDF), by RETICS grant number [PN 2018-2021]; by ISCIII- Sub-Directorate General for Research Assessment and Promotion and the European Regional Development Fund (FEDER) grant number [RD16/0022] and ACCI2018-09 from Instituto de Salud Carlos III through CIBERer (Biomedical Network Research Center for Rare Diseases and INGENIO2010). This work was funded by the Fundación Mutua Madrileña (AP174352020). MJG was supported by the Competitiveness Programme for the Promotion of Talent and its Employability in R+D+I “Torres Quevedo grant from Spanish Ministerio de Ciencia e Innovación (PTQ2019-010552).
CONFLICT OF INTEREST
The authors declare no conflict of interest, financial or otherwise.
ACKNOWLEDGEMENTS
The authors would like to thank Dr. Juan Sandoval and the Epigenomics Unit of the Instituto de Investigación Sanitaria La Fe for their support in performing Infinium Human DNA Methylation EPIC 850K arrays.
Data analysis was performed with the support of EpiDisease S.L. (Spin-off from the Center for Biomedical Network Research, CIBER-SCIII, Spain). SL-P acknowledges a PFIS FI18/00131 grant from the Instituto de Investigación Carlos III (Spanish Ministry of Science, Innovation and Universities).

