
Unsupervised Clustering in Epidemiological Factor Analysis
Abstract
Background:
The analysis of epidemiological data at an early phase of an epidemiological situation, when the confident correlation of contributing factors to the outcome has not yet been established, may present a challenge for conventional methods of data analysis.
Objective:
This study aimed to develop approaches for the early analysis of epidemiological data that can be effective in the areas with less labeled data.
Methods:
An analysis of a combined dataset of epidemiological statistics of national and subnational jurisdictions, aligned at approximately two months after the first local exposure to COVID-19 with unsupervised machine learning methods, including principal component analysis and deep neural network dimensionality reduction, to identify the principal factors of influence was performed.
Results:
The approach and methods utilized in the study allow to clearly separate milder background cases from those with the most rapid and aggressive onset of the epidemics.
Conclusion:
The findings can be used in the evaluation of possible epidemiological scenarios and as an effective modeling approach to identify possible negative epidemiological scenarios and design corrective and preventative measures to avoid the development of epidemiological situations with potentially severe impacts.
1. INTRODUCTION
In the early phases of a novel and an unknown infectious disease, prompt and reliable identification of the environmental factors, including physical and social, with the strongest influence on the developing scenario can be of paramount importance in controlling the spread and minimizing the impact on the society. However, a number of factors may complicate this analysis, such as quantity, reliability, and compatibility of data reported by and from different jurisdictions with different practices, a wide range of reporting jurisdictions by a large number of factors, of different nature, complexity, and accuracy in measurement, the possibility of complex interactions of factors, and others. In these situations, the application of conventional methods of statistical analysis that often require large volumes of accurate data for a confident conclusion may not be feasible, thereby indicating the need to develop an effective early response.
In the analysis of factors that can influence the development of the COVID-19 epidemiological scenario in a given jurisdiction, where epidemiological data is collected and reported, a considerable number of factors of different nature have been investigated, including demographic factors, such as gender and age [1, 2], ethnicity [3], genetic characteristics [4], social habits such as drinking and smoking [5], social factors, such as the condition of a public health care system and quality of policy, availability of universal immunization programs [6-8], and other. Statistical methods, such as linear correlation analysis (Pearson correlation coefficient) and linear and polynomial regression [9, 10], among many others, are used in the daily practice of statistical research to evaluate the significance of the relationship between potential factors of influence and the outcome of interest.
The strength of the conclusion derived from the application of these methods is often linked to the volume and confidence of the analyzed data, so the aggregation of significant volumes of data becomes a prerequisite of a confident statement of correlation, for example, in the drug approval process. This process can be time-consuming, and in some cases, it takes a long time to detect side effects [11]. This precondition is certainly necessary for the determination of the safety of products that can be used by millions of consumers; however, it may present a challenge in novel and rapidly developing situations, such as infectious epidemics, where the time factor can be essential or even critical in developing effective measures. Another challenge may arise due to a large number of factors that may have an influence on the outcome of the epidemics in a given jurisdiction, and identification of the principal ones with the strongest influence on the outcome can be difficult due to the number, complexity, and interaction of contributing factors.
In approaching these challenges, unsupervised machine learning methods have shown significant potential because they do not necessarily require a large volume of data confidently associated with the outcome (i.e., “labeled data”). In applying these methods, a data point or “case” is represented by a set of observable parameters or factors, for example, population density or age demographics in a country or region reporting epidemiological data. The association of data points with known outcomes is not required for these methods, unlike in common supervised learning and classification approaches. Unsupervised learning methods can be effective even with limited sets of recorded data while capable of producing indications of potential relationships between the factors, for example, clusters of similar cases that can be used as an input to an analysis of correlation with the outcome.
In this work, we follow the direction in the application of methods of unsupervised machine learning proposed in the earlier studies [12] by performing an analysis of a combined dataset of COVID-19 statistical data provided by national and subnational reporting jurisdictions, aligned at the time point of approximately two months after the first local exposure to the epidemics, with the intent to demonstrate the usability of these methods in the epidemiological data analysis in the early and rapidly developing epidemiological situations, making them an essential and valuable addition to the toolset of epidemiological analysis, especially in the early and developing phases when and where large volumes of confidential data have not yet been aggregated and compiled. Two essentially different and independent methods of unsupervised machine learning were chosen based on their effectiveness in other tasks and applications [13-16], with the objectives of 1) demonstrating the effectiveness of methods of unsupervised learning in early data analysis with less confident labels, and 2) evaluating the consistency of the results produced by independent and unrelated methods.
The unsupervised dimensionality/redundancy reduction methods, such as Principal Component Analysis (PCA) [13], and unsupervised deep artificial neural network models, such as Autoencoders (AE) [17], allow to analyze the distribution of case data points in the informative parameters identified by these methods and to identify characteristic regions associated with the outcome of interest, such as in this work, the severity of the epidemiological outcome in a reporting jurisdiction. Establishing combinations of latent and observable parameters that identify such regions can be instrumental in early evaluation and prediction of the risks of severe epidemiological impacts in the jurisdiction proactively with the opportunity to make necessary corrections before the explosive onset of the epidemics could inflict heavy impact on the society.
2. METHODOLOGY
The history of the pandemics to date shows that timing can be a critical factor in the development of the epidemics and provides an accurate analysis of the corresponding statistical data. To ensure the correctness of the analysis in the study, we used two approaches: 1) Data aligned concerning the duration of the exposure in the reporting jurisdiction, i.e., the dataset composed mainly of the cases that have the same or similar time of the exposure. Where it is not the case, 2) Time-based adjustment of the data is made so that the statistical records are taken at the same or similar time of local exposure. To simplify the timing analysis, the global zero time of the start of the COVID-19 pandemics was defined as TZ = 31.12.2019 [2]. The exposure time in the study in the format TZ + y months is relative to this time point.
A number of known factors expected to have a strong influence on the course of the epidemics in the cases were identified in the cited and other studies, including the time of the local exposure, demographics, social and traditional factors, lifestyle, the level of economic and social development, the quality and efficiency of the healthcare system, the quality of public health policymaking and execution.
The methodology of this research is based on processing the input data expressed as a set of observable parameters identified and described in the study using unsupervised machine learning methods to identify and extract a smaller set of informative features. In many cases, evaluating the distributions of data in the representations of informative components such as, principal components in PCA, or dimensionality reduction with neural network autoencoder models allowed to identify and separate characteristic classes of cases in the observable data by essential latent parameters that can be linked to the observed outcome.
2.1. Data
Evidently, the time of the local exposure to the epidemics is one of the critical parameters of the impact, so the case data was adjusted and aligned at a similar phase in the development of the epidemics, based on the availability of data at approximately local Time Zero + two months, i.e., approximately two months after the first local exposure to the infection. In the study, this translates to the beginning of April, 2020, for Wave 1 case (i.e., those with local Time Zero at the end of January, 2020) and the end of April - beginning of May, 2020 for Wave 2 (LTZ end of February to early March, 2020).
A combined dataset of approximately forty national and subnational cases was constructed based on the criteria of reliability and consistency, essentially, bringing together cases with similar social and economic parameters to minimize the number of potentially influencing factors, along with the expectation of a certain minimal level of exposure to the epidemics and reliability of the reported data.
The dataset was constructed from the publicly available current data on the epidemic’s impact per case, i.e., reporting jurisdiction. As previously published statistical data in the public domain containing no individual identification, the data used in the study were excerpted from a review by the Institutional Review Board [18]. The dataset comprised the current value of the epidemiological impact recorded in the jurisdiction (case) and measured in mortality per capita m(t) (M.p.c.), per million of population, and a number of observable parameters selected, as described further in this section, with the hypothesis of a certain level of correlation between the observable parameter set and the severity of the outcome.
On the relative scale of impact by jurisdiction, the “explosive” cases were normally identified as those with the relative impact (i.e., relative to the maximum among all reporting jurisdictions at the time of reporting) of around and above 0.3. This subgroup of cases included all reported cases of high epidemic’s impact at the time of writing.
In the evaluation of distribution in the coordinates of principal components, two higher impact clusters of cases were identified by relative impact: explosive cases with a relative impact above 0.8 groups included the well-known first wave cases: Italy, Spain, and New York with the highest impact worldwide observed to date. In the second group, milder-impact cases, including the United Kingdom, France, Belgium, Netherlands, Ireland, and Quebec (Canada), with relative impact in the range from 0.3 to 0.8, were included.
The outcome parameter was not used in the training of the unsupervised learning models (i.e., excluded from the training dataset) but only for identification of the regions of interest (i.e., those with higher epidemiological impact) in the latent representations produced by the models as a result of training.
2.2. Observable Parameters
The examples of factors of influence are genetic differences, population density, social traditions and cultural practices, past widespread public policy, such as immunization, smoking habits, and the epidemiological policy of the jurisdiction aimed at controlling the spread of the disease.
In addition to the common measurable factors, such as population density, age demographics, smoking prevalence, a number of additional factors with potential impact on the severity of the epidemic pattern were considered in this study, as described in this section. Due to the limitation of time and resources, a rating scale approach was chosen for those factors that could not or would be challenging to measure directly. Understandably, such an approach can be influenced by subjective perceptions; however, we believe that more robust and objective techniques can be developed over time, improving the quality of the analysis and the resulting conclusion.
2.2.1. Connectivity
It is intended to measure the intensity of international and regional connections in the jurisdiction of the case, for example, international, inter and intra-regional travel and migration, tourism, seasonal and work-related movement of the population, activity, and so on. Furthermore, more intensive connection hubs can be expected to have higher exposure to the pandemics, increasing the probability of a severe impact.
2.2.2. Social Proximity
It is intended to reflect the closeness of interpersonal connections in the case, again in multiple spheres and domains, for example: family connections, social practices, and traditions, the intensity of business connections, lifestyle practices, social events, and others. Again, as described previously, when modeling such a complex factor, a single value parameter may open the analysis of the vulnerability of subjects; yet we believed that it could be important for the analysis and improvements to make its evaluation more objective and accurate in the future studies.
We also used three rating parameters intended to measure the policy of the jurisdiction related to the response to the pandemics. They are 1) epidemiological preparedness of the public healthcare system to the intensive and rapid development of an epidemic, 2) the effectiveness of the policy response, and 3) the timeliness of the public health epidemiological response.
2.2.3. Epidemiological Preparedness
It is intended to measure the preparedness of the health care system to handle a rapid onset of a large-scale epidemic. This parameter is intended to be specific to the epidemiological situation rather than the general state of the health care system, its technological level, funding, etc.
2.2.4. Effectiveness of Policy Response
It indicates the quality of the public health policy in controlling the epidemics based on available scientific data at the time, including its clarity and availability for understanding and following by the general population facilitating its preparedness to participate. While some concerns can be expressed that this factor can be influenced by post-impact considerations with the potential post-factum correlated with the outcome, we believe that with the accurate approach these risks can be minimized. For example, it is evident that an unclear or misleading policy message could be highly detrimental to the intended effect and one does not need the outcome to judge such policy parameters objectively at the time the decision is made and before the outcome is recorded.
2.2.5. Timeliness
It measures the relative timing of the introduction of the epidemiological policy to the local exposure and development of the epidemics.
2.2.6. Universal BCG Immunization Record
It indicates the record of a current or previous immunization program, according to the classification introduced in a previous study [19]. The detailed definition is provided in the Appendix Table 1.
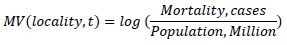
The outcome parameter, the epidemiological impact was measured in COVID-19 as caused mortality per 1 million capital, relative to the world maximum value at the time of the analysis.
Due to a large spread within the range of the impact of the epidemics in the dataset, the logarithmic scale was also used in the evaluation of the impact of the epidemics represented by the Measured Value parameter (MV) being the logarithm of mortality per capita (in cases per 1M of the population in the jurisdiction).
It needs to be noted that in the framework of unsupervised analysis, the epidemiological impact is not known a priori and for that reason, it was not used in the evaluation of data with the selected methods. It was used, however, to analyze distributions obtained with the models and identify regions of potential interest, such as combinations of observable parameters associated with the areas of higher epidemiological impact.
The resulting dataset of 40 national and subnational cases with the identified observable parameters and the recorded epidemiological impact at the time of preparation is presented in Appendix Table 1.
Reservations and qualifications:
1. Consistency and reliability of data reported by the national, regional, and local health administrations.
2. Alignment at the time of reporting may not be consistent between all jurisdictions due to possible differences in reporting practices.
Sources:
Google coronavirus map [20], World statistical data [21, 22], World BCG atlas [23], National and subnational jurisdictions COVID-19 information and statistics sources [24-26].
Media reports and others sources were used.
2.3. Methods of Unsupervised Machine Learning
To evaluate the hypothesis of the correlation between the identified parameters and the epidemiological outcome of the cases in the dataset, two well-known and commonly used machine learning methods were used. Different methods were used to verify the consistency of the findings and eliminate the influence of the specific choice of the models, the possibility of fluctuations in the data, and so on, such as:
1. Principal Component Analysis and identification of principal informative factors (Table 1).
2. Unsupervised deep neural network-based dimensionality reduction and selection of dominant informative factors.
Principal Component Analysis [13] produces a linear transformation of the data to the coordinates with the highest variance. The method is based on the internal characteristics of the data and does not require prior knowledge of the outcome.
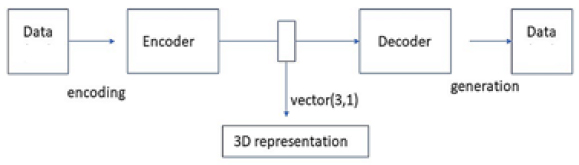
A deep neural network autoencoder performs a non-linear dimensionality reduction of the observable data to the lower-dimensional representation with identified informative features. The diagram of the architecture of the unsupervised autoencoder model is given in Fig. (1).
The neural network model of a deep autoencoder used in this analysis had 5 fully interconnected layers of size 3 – 30, with a total of approximately 8,000 trainable parameters. The data were scaled to the interval (0, 1), and “sigmoid” activation in the output layer with Mean Squared Error (MSE) cost function was used for unsupervised training of the model with the dataset observable parameters, excluding the impact. Models of this and similar architecture were found to be effective in the earlier studies of unsupervised latent representations, including the Internet [27] and different types of visual data [28, 29]. A detailed description of the deep neural network model architecture similar to those used in the study is provided previously [27]. It is expected that with larger datasets with higher numbers and complexity of the parameters, the complexity of the models, including the size and depth can be extended in future studies.
In the unsupervised training phase, the neural network model is trained to reproduce the data in the training dataset with good accuracy (i.e., an incentive to reduce the deviation of the output and input) and does not require labels marked with the outcome; the same applies to PCA. Achieving an improvement in the accuracy of the reproduction of the input data, which can be measured by a number of training metrics, indicates that the model has learned some essential characteristics of the initial distribution. The aim of unsupervised learning is thus to minimize the deviation of the original training sample from its regeneration created by the model.
3. RESULTS AND DISCUSSION
In this section, we present the results of the analysis of the dataset the methods outlined in the previous section with a brief discussion.
3.1. Principal Component Analysis
The principal component analysis identified three principal components with overall influence above 95%, as shown in Table 2. The highest influence factors in the PCA analysis were mostly aligned with the results of the linear regression analysis, such as policy-timing, connection hub, social proximity, BCG, and smoking prevalence.
PCA transformation is an inherently unsupervised method of learning, which means that the prior known outcome labels are not required to learn the principal components as well as representation of the input data in the coordinates of identifying principal component eigenvectors. By plotting the data in the coordinates of the identified principal component vectors, interesting results can be obtained, indicating the cases with the highest recorded impact of the epidemics.
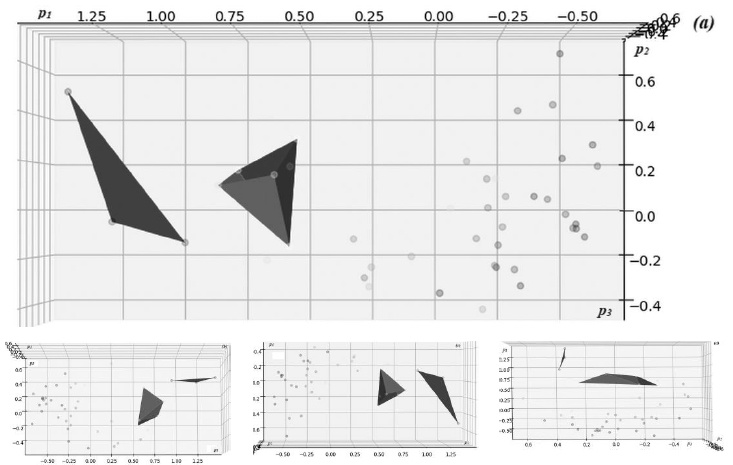
Fig. (2) presents visualizations of the distribution of the dataset of epidemiological cases in the latent coordinates of the three leading principal components {p1, p2, p3} with the highest variation identified by PCA analysis, corresponding to the axes described in Table 1. The cases and approximated region of the high-impact cluster are shown in blue, defining the region of principal coordinate values with the highest recorded impact of the epidemics; in a similar way, a cluster with medium impact is shown in magenta.
| Eigen Vector | Observable Parameters | Weight |
|---|---|---|
| Axis 1 (p1) | Policy-time, BCG | 0.570 |
| Axis 2 (p2) | BCG, smoking | 0.166 |
| Axis 3 (p3) | Connection hub, social proximity | 0.127 |
A clear separation of the high-impact case clusters from the general background cases can be clearly observed in the diagrams. It allowed identifying the region where the cases with potentially higher impact, including the “explosive” pattern, are distributed in the latent coordinates of the principal component representation.
3.2. Data Analysis with Unsupervised Neural Network Model
A similar approach can be demonstrated with an unsupervised neural network autoencoder model that reduces the number of parameters by compressing the observable data space into a lower-dimensional representation in an unsupervised training process aimed at improving the accuracy of regeneration from the compressed representation. Models of a similar type were used to create structured unsupervised representations of different data types via unsupervised autoencoder training with minimization of generative error [15-17, 27].
The dimensionality of the unsupervised representation for the models in the study, which is defined by the size of its central encoding layer, was chosen based on the results of the Principal Component Analysis in the previous section, indicating the three most informative components. The identified latent coordinates {q1, q2, q3} represented activations of the neurons in the central, “encoding” layer of the neural network model.
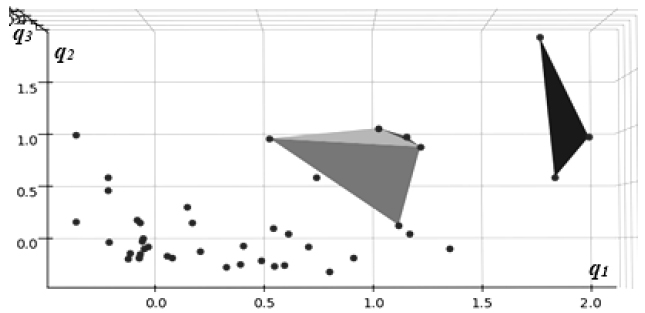
Presented in Fig. (3) are direct visualizations of the distributions of data in the coordinates of the latent representation created by an autoencoder neural network model trained in an unsupervised process without outcome labels.
The highest impact cluster of three cases is shown in green, whereas the medium one (7 cases), in orange. Again, a similar pattern of clear separation of high-impact cases from the general background can be observed with these models, consistent with the results of PCA analysis in the previous section, as indicated in Table 2.
| Method | Number of Characteristic Regions | Separation of Regions | Correlation to Outcome(1) |
|---|---|---|---|
| Principal Component Analysis (PCA) | 5 | Yes | 0.998 |
| Deep Neural Network autoencoder (AE) | 4 | Yes | 0.986 |
The consistency between the results of two independent and unrelated methods applied to the same dataset's observable parameters indicates with high confidence that the observed effect represented a genuine relation of parameters in the dataset and not a spurious artifact.
It is worth noting that as with PCA, autoencoder models, though essentially non-linear, also allow identifying the higher-impact regions in the coordinates of the observable parameters. This can be achieved by forward-propagating through the generative part of the model, the identified region of interest, defined by a set of characteristic points in the latent representation, defining the corresponding region in observable parameters. The combinations of observable parameters that produce the effect of interest can be identified proactively and used in the development of an effective preventative or mitigating epidemiological policy.
3.3. Observable Regions of Interest
It is essential to note that the regions of interest, such as those with a higher impact of the epidemics identified in the analysis with unsupervised models can be translated into the observable parameters, identifying the regions in the observable space with potentially high impact {Rimp}.
In the case of PCA, which is a linear model, the set of identifying vortices in the coordinates of principal components can be expanded to the initial dimension with a number of strategies, for example by adding the median values of other components. The obtained n-dimensional polyhedron region can then be transformed into the observable coordinates via inverse PCA transformation.
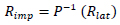
Where P is the linear PCA transformation operator.
With artificial neural network-based unsupervised models that are essentially non-linear, the transformation is not as straightforward but still possible. With a sufficiently accurate generative model (Fig. 1) produced by a successful unsupervised training process, the observable image of any point of interest in the latent space of the model Xlat can between approximated by its regeneration by the generative model, Gen(Xlat).
Then, the region of interest in the observation space can be approximated by a polyhedron of generating points:
Where Gen is the generative submodel of the autoencoder.
Thus, in both considered cases, the identified regions of interest in the informative parameters can be translated into the observable ones, providing important early input for the development of preventative policies.
3.4. Trend Analysis with Identified Informative Factors
The informative factors identified in the unsupervised phase of the analysis can be used to evaluate early trends in the development of the epidemiological scenario, providing an essential input in the development of the containment policy.
Linear regression with identified observable parameters of highest influence [30] produced a trend with a strong correlation to the outcome, with the value of 0.9 out of 1.0 maximum, as shown in Table 3.
| Factor | Linear Regression Score | Correlation |
|---|---|---|
| Policy, timing | 0.534 | 0.906 |
| Policy, effectiveness | 0.094 | 0.856 |
| Social proximity | 0.078 | 0.794 |
| Connection hub | 0.196 | 0.697 |
| Immunization | 0.092 | 0.686 |
Policy factors, described in a number of studies [31], have a strong influence on the outcome that is confirmed by the results of the linear regression analysis. Furthermore, the importance of other factors, such as connection intensity, social proximity culture, immunization record, and smoking prevalence was observed.
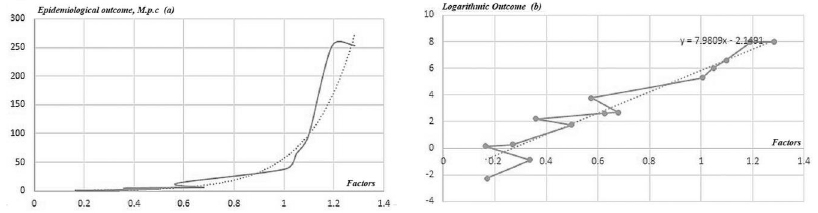
Influencing factors identified with methods of unsupervised machine learning can be used in trend analysis of the factor(s) of interest, such as epidemiological outcome, with standard statistical methods. For example, trend analysis [32] produced a clear exponential trend with a similar dataset of epidemiological cases (Fig. 4).
In Fig. (4a) (left), the epidemiological outcome shows a clear exponential trend with respect to the sum of identified main factors of influence, like policy, connectivity, and immunization. Fig. (4b) (right) shows the logarithmic outcome with a clear linear trend. A number of the outlier data points that are present in the linear diagram on the right can be explained by the influence of other factors in the data, factors that have not yet been identified, and/or statistical fluctuations.
CONCLUSION
The methods of unsupervised machine learning can be effective in identifying and separating the informative features in complex general data [13-16]. In this work, two different methods of unsupervised learning applied independently, consistently demonstrated good separation of cases with a higher COVID-19 epidemiological’ impact from the general background.
The analysis and the findings of the study can be used in the evaluation of possible epidemiological scenarios based on the evaluation of the factors identified and discussed in this work, as well as those that can be added in the subsequent studies. Such an audit can be a highly instrumental tool in the early identification of risks associated with high-impact epidemiological scenarios. Further research and development in this direction will have the potential of producing effective modeling tools to identify the areas of potential epidemiological risks in the public healthcare infrastructure, possibly within a more general Infection Prevention and Control policy framework and design corrective and/or preventative measures to avoid the severe impact scenarios.
Future studies can be focused on improving the accuracy of measurement of the identified observable parameters as well as introducing additional factors, with the potential to improve the accuracy and confidence of the analysis.
ETHICS APPROVAL AND CONSENT TO PARTICIPATE
Not applicable.
HUMAN AND ANIMAL RIGHTS
Not applicable.
CONSENT FOR PUBLICATION
Not applicable.
AVAILABILITY OF DATA AND MATERIALS
The data sets used during the current study can be provided from the corresponding author [S.D], upon reasonable request.
FUNDING
None.
CONFLICT OF INTEREST
The authors declare no conflict of interest, financial or otherwise.
ACKNOWLEDGEMENTS
Declared none.
APPENDIX
| Case | Policy | Conn | Bcg | Smo | Den | Soc | Age | Impact (R.rel) | ||
|---|---|---|---|---|---|---|---|---|---|---|
| p-prep | p-qlty | p-tme | ||||||||
| Taiwan | 0 | 0 | 0 | 0.1 | 0 | 0.34 | 0.3 | 0.2 | 0.3 | 0.001 |
| Japan | 0.1 | 0.1 | 0 | 0.6 | 0 | 0.674 | 0.3 | 0.2 | 0.5 | 0.002 |
| Singapore | 0 | 0 | 0 | 0.4 | 0 | 0.33 | 0.5 | 0.3 | 0.25 | 0.004 |
| Australia | 0.2 | 0.2 | 0 | 0.2 | 0.3 | 0.298 | -0.5 | 0.3 | -0.4 | 0.005 |
| South Korea | 0.1 | 0.2 | 0 | 0.2 | 0 | 0.996 | 0.3 | 0.2 | 0 | 0.013 |
| Finland | 0.3 | 0.2 | 0.1 | 0.1 | 0.3 | 0.418 | -0.2 | 0.2 | 0.3 | 0.017 |
| Canada | 0.4 | 0.2 | 0.2 | 0.3 | 0.8 | 0.354 | -0.5 | 0.4 | 0 | 0.023 |
| Ontario (Canada) | 0.4 | 0.2 | 0.25 | 0.3 | 0.8 | 0.258 | -0.2 | 0.4 | 0 | 0.025 |
| Germany | 0.3 | 0.2 | 0.2 | 0.5 | 0.2 | 0.608 | 0.2 | 0.4 | 0.5 | 0.052 |
| Sweden | 0.3 | 0.3 | 0.3 | 0.1 | 0.6 | 0.412 | 0.0 | 0.3 | 0 | 0.148 |
| UK | 0.5 | 0.7 | 0.7 | 0.7 | 0.8 | 0.398 | 0.2 | 0.5 | 0 | 0.248 |
| France | 0.5 | 0.5 | 0.6 | 0.7 | 0.6 | 0.596 | 0.2 | 0.7 | -0.2 | 0.371 |
| Belgium | 0.5 | 0.4 | 0.5 | 0.7 | 1 | 0.53 | 0.2 | 0.5 | 0 | 0.429 |
| Spain | 0.8 | 0.7 | 0.8 | 0.5 | 0.8 | 0.584 | 0.2 | 0.8 | 0.5 | 0.965 |
| Italy | 0.8 | 0.8 | 0.9 | 0.7 | 1 | 0.566 | 0.2 | 0.8 | 0.5 | 0.969 |
| USA | 0.5 | 0.5 | 0.5 | 0.3 | 1 | 0.39 | -0.2 | 0.4 | -0.4 | 0.095 |
| New York (USA) | 0.8 | 0.8 | 0.9 | 1 | 1 | 0.25 | 0.5 | 0.8 | -0.5 | 1.000 |
| California (USA) | 0.5 | 0.3 | 0.2 | 0.5 | 1 | 0.226 | 0.1 | 0.4 | -0.5 | 0.040 |
| Slovakia | 0.2 | 0.2 | 0.2 | 0 | 0 | 0.794 | 0.2 | 0.2 | -0.1 | 0.016 |
| Argentina | 0.4 | 0.3 | 0.3 | 0 | 0 | 0.478 | -0.2 | 0.3 | -0.5 | 0.019 |
| Chile | 0.2 | 0.2 | 0.1 | 0 | 0 | 0.76 | 0.1 | 0.2 | -0.5 | 0.050 |
| Ukraine | 0.6 | 0.4 | 0.3 | 0 | 0 | 0.94 | 0.2 | 0.4 | 0.1 | 0.027 |
| Poland | 0.3 | 0.2 | 0.1 | 0.2 | 0 | 0.648 | 0.2 | 0.3 | -0.1 | 0.066 |
| Moldova | 0.6 | 0.4 | 0.3 | 0 | 0 | 0.56 | 0.2 | 0.4 | -0.4 | 0.125 |
| Czechia | 0.3 | 0.2 | 0.1 | 0.1 | 0 | 0.766 | 0.2 | 0.25 | 0 | 0.082 |
| Croatia | 0.3 | 0.2 | 0.1 | 0 | 0 | 0.74 | 0.2 | 0.25 | 0.5 | 0.068 |
| Albania | 0.3 | 0.2 | 0.1 | 0 | 0 | 0.8 | 0.2 | 0.25 | -0.5 | 0.038 |
| Greece | 0.2 | 0.1 | 0 | 0.4 | 0 | 1 | 0.2 | 0.5 | 0.5 | 0.049 |
| Israel | 0.1 | 0.1 | 0.1 | 0.4 | 0.3 | 0.382 | 0.2 | 0.2 | -0.5 | 0.094 |
| Prairies (1) (Canada) | 0.3 | 0.2 | 0.2 | 0 | 0.6 | 0.292 | -0.3 | 0.2 | -0.3 | 0.016 |
| Quebec (Canada) | 0.6 | 0.4 | 0.5 | 0.3 | 0.8 | 0.304 | -0.2 | 0.5 | 0.3 | 0.396 |
| Norway | 0.2 | 0.2 | 0.2 | 0.2 | 0.2 | 0.452 | -0.2 | 0.25 | -0.1 | 0.060 |
| Denmark | 0.2 | 0.2 | 0.2 | 0.1 | 0.3 | 0.352 | 0.2 | 0.25 | 0.1 | 0.132 |
| Switzerland | 0.2 | 0.2 | 0.2 | 0.2 | 0.3 | 0.51 | 0.2 | 0.25 | 0.25 | 0.262 |
| Austria | 0.2 | 0.2 | 0.2 | 0.2 | 0.2 | 0.704 | 0.2 | 0.25 | 0.4 | 0.104 |
| Portugal | 0.3 | 0.3 | 0.3 | 0.3 | 0 | 0.63 | 0.2 | 0.5 | 0.5 | 0.155 |
| Ireland (2) | 0.4 | 0.3 | 0.5 | 0.4 | 0.2 | 0.444 | 0.2 | 0.6 | -0.4 | 0.406 |
| Netherlands | 0.3 | 0.4 | 0.4 | 0.5 | 1 | 0.524 | 0.3 | 0.25 | 0.4 | 0.449 |
2 Inconsistencies in implementation of universal BCG policy [19].
OBSERVABLE FACTORS
Policy
P-Prep: health care preparedness, range 0 .. 1, lower to higher preparedness
p-qlty: response measures, range 0 .. 1, lower to higher epidemiological policy quality;
p-tme: response timing, range 0 .. 1, timely to delayed
Conn: connection intensity, range 0 .. 1, lower to higher connection intensity
BCG: BCG immunization record, range 0 .. 1. The value of 0 indicates current or very recent universal immunization policy; the value of 1 indicates no effective immunization policy and equivalent cases [2]. A value between 0 and 1 indicates a previous universal immunization policy relative to the time after cessation.
Smo: smoking prevalence in the population. In the cases with a large disparity between genders and so on, the higher of values was taken.
Den: population density. Due to significant variability in population density between the cases in the dataset, a logarithmic band scale was used; additionally, in cases with a very large territory, a negative offset was added to account for non-homogeneousness of the distribution of individual cases and the delay in propagation of the epidemics due to geographical distance. A higher granularity analysis of national jurisdictions with very high geographical spread can be attempted in a future study.
Age: age demographics, median age, logarithmic band of the deviation from the dataset mean, range: -0.5 .. 0.5.
EPIDEMIOLOGICAL OUTCOME
The epidemiological impact in the jurisdiction at the time of analysis was measured as mortality per 1 Million capita (R).
Other measures of outcome used in the study:
Epidemiological outcome relative to world highest at the time:R.rel = R / R.max
Logarithmic impact, R.log = log (R)

