
Development of a Genetic Method for X-ray Images Analysis based on a Neural Network Model
Authors Info & Affiliations
Abstract
Background:
Modern medicine depends on technical advances in the field of medical instrumentation and the development of medical software. One of the most important tasks for doctors is determination of the exact boundaries of tumors and other abnormal formations in the tissues of the human body.
Objective:
The paper considers the problems and methods of machine classification and recognition of radiographic images, as well as the improvement of artificial neural networks used to increase the quality and accuracy of detection of abnormal structures on chest radiographs.
Methods:
A modified genetic method for the optimization of parameters of the model on the basis of a convolutional neural network was developed to solve the problem of recognition of diagnostically significant signs of pneumonia on an X-ray of the lungs. The fundamental difference between the proposed genetic method and existing analogs is in the use of a special mutation operator in the form of an additive convolution of two mutation operators, which reduces neural network training time and also identifies "oneighborhood of solutions" that is most suitable for investigation.
Results:
A comparative evaluation of the effectiveness of the proposed method and known methods was given. It showed an improvement in accuracy of solving the problem of finding signs of pathology on an X-ray of the lungs.
Conclusion:
Practical use of the developed method will reduce complexity, increase reliability of search, accelerate the process of diagnosis of diseases and reduce a part of errors and repeated inspections of patients.
1. INTRODUCTION
Nowadays respiratory diseases are among the diseases that pose a serious threat to public health. In 2016, the World Health Organization (WHO) included them in the top 10 causes of death in the world [1].
Respiratory diseases require careful and timely diagnosis, on which the patient's life often depends.
Among all the methods of instrumental diagnosis of respiratory diseases, the X-ray method of diagnosis is the most frequently used and reliable. The main task of this method is the analysis of X-rays in order to identify signs of pathology [2].
The traditional expert method of pathology diagnosing by X-ray of the lungs is based on the search and evaluation of radiological signs that are characteristic of a particular pathology by an expert in the field of analysis of lungs X-rays. The expert follows a certain sequence of actions. First of all, the shadow picture is described. It is determined whether the selected area of the image (object) is obscuration or enlightenment. Then the localization of the object is determined in the lobes and segments of the lungs. Next, the size, shape, contours, intensity and structure of the object are evaluated [3].
That is why the method of visual search and evaluation of small low-contrast diagnostically significant objects on the X-ray is labor-intensive and requires highly qualified radiologists. Also because of the limited time given for image description, it does not exclude diagnostic errors.
In the last few years, significant progress was made in the development and use of neural networks and methods of so-called deep learning. These methods have shown high efficiency in solving a wide range of problems of analysis, classification and recognition of X-ray digital images [4].
Thus, the development of methods and algorithms for radiographic image recognition, in particular methods based on the use of neural networks that speed up the diagnosis of diseases and reduce the number of re-examinations, is an urgent task [4].
This paper proposes a modified genetic method for recognition of diagnostically significant signs of pneumonia on lungs X-ray, which reduces the complexity, increases the reliability of the search, speeds up the process of diseases diagnosing and reduces some errors and re-examinations of patients.
2. ANALYSIS OF PUBLISHED DATA AND PROBLEM DEFINITION
In the process of medical diagnostics of many diseases, the tasks of analyzing images of various tissues for the presence of pathological features arise. Traditionally, these tasks are solved by qualified experts through visual assessment. Meanwhile, the development of computerized systems for automatic diagnostics capable of learning and recognizing biomedical images can significantly increase the speed of the diagnostic procedure and reduce its cost.
The article [5] considers the method of radiographic image recognition, based on the decision tree method. The authors showed that the proposed method saved computing resources, allowed to optimize the procedures for classification features selection and to significantly limit the number of features used in the recognition of specific objects. The disadvantage of this method is that too complex structures that do not fully represent the data can be created in the process of decision tree building.
In [6], a method for digital processing and recognition of halftone raster images of chest radiographs using the method of ant colonies was proposed. This method uses a distributed algorithm based on an ant population. Each ant in the proposed model has the ability to remember the location of the object, which will be updated when a new goal is reached. A fuzzy connectivity measure is taken to assess the similarity between the target object and the object currently being referenced by the ant. In the developed method, the behavior of one ant affects the behavior of neighbors and united actions during the exchange of information and the evaporation of the pheromone. The advantage of the developed method is its ability to preserve the details of the object and its immunity to noise. The disadvantage of the proposed method is the tendency to get into the local optimal solution and the dependence of the result on the tuning parameters, which are selected only experimentally.
In [7], a gradient method for detection of lung contours on a matrix of a halftone raster image of a chest radiograph is proposed. This method consists of calculating the norm or the squared norm of the gradient of brightness change for all points of the raster image. Then, on a new black-and-white monochrome matrix, all elements that have a norm value or a squared norm of the gradient greater than the threshold value are highlighted in black on a white background. Connected configurations of black elements are taken as contours of objects on a monochrome matrix. Then the threshold value of the squared norm of the gradient is calculated as the product of this coefficient by the sum of the squares of the mean values of the modules of the brightness change of adjacent pixels by rows and by columns. Accordingly, among the connected configurations of black elements on a monochrome matrix, configurations in which the number of input elements is less than 5-7 are immediately discarded. For other configurations, the average measure of the neighborhood is calculated in the form of the quotient of the sum of all elements of the configuration of adjacent elements divided by the sum of the elements in the configuration. Сonfigurations in which the average degree of neighborhood is less than 3 are rejected, and the remaining ones are accepted as the desired contours of objects.
The disadvantages of this method are that it has too many parameters, which are empirically configurable and do not allow obtaining decisive rules suitable for images of the same class. With fuzzy segments, it is almost impossible to choose such parameters.
The work [8] describes the method of radiographic image segmentation. The proposed method consists of two stages: growing and subsequent merge of segments. The growing of regions in this method is used to perform an initial conscious redundant segmentation, and the merging of regions, based on methods of graph theory, aims to achieve the final optimal state of segmentation. The determination of crystallization centers in this method occurs in an automatic mode based on a gradient image obtained from the original one using the Kirsch mask operator. The use of a gradient image allows a fairly universal solution to the problem of automatic detection of crystallization centers, since the minima of the function of the gradient image will correspond to points with the most homogeneous margin (potential connection centers of segments).
However, the disadvantage of using the Kirsch operator in the proposed method is its spatial limitation. When searching for crystallization centers, it would be useful to investigate the neighborhood of a point on a large scale in order to take into account low-frequency changes in the image brightness function and thus to carry out further determination of connection centers more accurately.
The article [9] presents a method for the optimal selection of a set of features for the classification of chest X-ray images, which includes GA and a System Induction Tree (SID). This approach simultaneously minimizes the number of features used for classifier work and contributes to the improvement of the classifier's performance. GA is used to search in space for possible subsets of a larger set of candidate features. For the received subset of features, the SID creates a decision tree. The value of the fitness function for this subset of features is the quality of the decision tree operation on new data. This value is then used by the GA to obtain the best feature set. The process of interaction between GA and SID is repeated until an optimal set of features is found, with which classifier works satisfactorily.
The advantage of this method is that it provides a decrease in descriptive complexity and an improvement in the quality of recognition in comparison with standard methods of feature extraction for a classifier.
The disadvantage is that decision trees are prone to overfitting, and they are also vulnerable to class misalignments, which are found in most datasets. A good solution in this case is to periodically balance the classes (class weights, sampling, defined loss function).
In [10] experiments were carried out using convolutional neural networks to classify the presence of tuberculosis on X-ray images. The preprocessing consisted of obtaining a lung mask after segmentation. Then the original image was cropped along the edges of the resulting mask. For classification the following convolutional neural network models were used, pre-trained on imagenet: AlexNet, VGG-16, VGG-19, ResNet-50, Xception. The training process took place only for a small block of fully connected layers located behind the last convolutional layer. In the article, the AlexNet network showed the best results. Along with the above models, a small convolutional neural network was considered. It consisted of three convolutional layers with a 3x3 filter, after each of which MaxPooling was applied with a 2x2 window and a step equal to 2. Then a fully connected layer and a Dropout layer were placed. At the end there was placed a fully connected prediction layer with two outputs and a softmax activation function. The results of this model were worse in comparison with AlexNet in terms of accuracy and AUC.
From the obtained experimental results, it can be concluded that the advantage of using a convolutional neural network is that it contains fewer parameters than a conventional fully connected network. The disadvantage is that the high-speed neural network has a long training time and the need for a large amount of data.
In [11] the authors propose to use a special genetic algorithm (RCGA), grounding on the fact that genetic algorithms are based on principles borrowed from biology and genetics, which allows achieving good results. The method of consistent feature selection proposed by the authors for the classification of fluorography images is based on parallel Real Coding Genetic Algorithms (RCGA) in combination with AnyLogic simulation models. Distinctive feature of this approach is the use of agent-processes, which are autonomous genetic algorithms that operate synchronously in parallel streams and periodically exchange the best potential solutions. This provides a solution to the problem of genetic algorithms getting stuck in local extrema, and significantly improves the general procedure for solutions finding. The disadvantage of the proposed method is its implementation complexity, and it also requires a significant amount of computing resources.
In [12], the authors proposed a method for finding anomalies in X-rays using deep machine learning with use of image preprocessing for lung segmentation and bone removal. The proposed method works under the assumption that the value of the difference between the intensities of bone and lung tissue can vary from the center of the bone to its boundaries. However, this value remains virtually unchanged in adjacent areas along the parabolic curve. This assumption allows the method firstly to predict the difference in intensity in the center of the bone and then extend this value in the vertical direction to minimize the difference between the boundaries of the ribs and the lung tissue above or below the boundaries. The authors chose a standard model of convolutional neural networks based on the AlexNet architecture to classify bone tissue in images. The network contains eight layers: 5 convolutional layers and 3 fully connected layers. This neural network uses the ReLU activation function. The ReLU layer is located after each convolutional and fully connected layer.
The advantage of this method is its resistance to distortion of the original data, high classification efficiency and not too many setting parameters. However, the use of this method is associated with the complexity of its training and is often less productive than the use of template methods.
In [13] the method of computer diagnostics of respiratory diseases by means of the textural analysis of X-rays is offered and investigated. An approximate nearest neighbor search algorithm is proposed, in which the reference standard to be tested next is selected so as to maximize the conditional probability density of the distances to the reference images tested in the previous steps. The results of experiments showed increased computational efficiency of the developed algorithm in comparison with known methods. The disadvantage of this method is that finding the nearest neighbor in a reasonable time is not easy. You must have enough memory to store the entire sample and to conduct a search procedure that allows you to quickly find the nearest neighbor to the new retrieved item.
In [14] the solution of the problem of classification of chest X-rays by means of the convolutional neural network trained on small data sets is presented. The training binary classifier is used to detect the presence or absence of pathology of the lower respiratory tract. This paper presents the results of a computational experiment and shows that the use of convolutional neural networks to isolate quantitative features of images is a much more effective approach compared to traditional methods. Also, the use of neural networks provides such advantages as: Adaptation to environmental changes, resistance to noise in the input data and potentially high performance.
Along with the above advantages, modern deep learning methods have one significant drawback: Effective learning of a convolutional neural network requires a very large number (tens and hundreds of thousands) of annotated images, which is especially difficult to provide in the case of biomedical images.
After analyzing the works [5-14], a comparative analysis of the investigated methods for recognition of images in the form of X-ray diffraction patterns was carried out Table 1.
After analyzing the existing works [5-14], it was found that in the process of pattern recognition in images for decision making, medical experts face a number of problems: incomplete and inaccurate source information, high variability of attributes and small sample size, limited decision time for conclusions.
These factors often lead to errors in diagnosis. In order to improve the efficiency and quality of medical image processing, such as chest radiographs, it is necessary to improve and modify the methods of visual data analysis to improve the accuracy and quality of disease diagnosis [14].
3. THE PURPOSE AND OBJECTIVES OF THE STUDY
The object of the research is the process of pneumonia disease patterns recognition.
The subject of research is methods of radiographic image recognition.
The aim of the work is to develop a modified genetic method for optimization of parameters of the model based on convolutional neural networks to solve the problem of recognition of diagnostically significant signs of pneumonia on an X-ray of the lungs.
Research method - traditional models (decision trees, nearest neighbor method, ant colony method), neural networks, combined methods (neural networks and genetic algorithms, neural networks and multi-agent systems).
4. MATERIALS AND METHODS
4.1. Development of a Modified Genetic Method for Optimizing Model Parameters based on a Convolutional Neural Network
To solve the problem stated earlier, it was decided to develop a modification of the GA, which will increase the accuracy of the neural network. The task of neural networks training consists in weights adjustment, and here genetic methods can be considered as the most acceptable mean. This assumption follows from the fact that in the initial stages of the network work there is no information about the input parameters for adjustment of the neural network weight parameters. Under conditions of uncertainty, evolutionary algorithms show the greatest efficiency [15]. The developed modification offers specialized crossing, selection and mutation operators that provide maximum adaptation to the specifics of the problem. Initially, the proposed genetic method carries out the formation of the initial population, namely, a randomly generated final set of test solutions according to formula (1):
| Methods | Advantages | Limitations |
|---|---|---|
| Decision tree | The method saves computing resources, optimizes the procedure for classification features selection and significantly limits the number of features used for recognition of specific objects. The method easily deals with “outliers” (anomalous values) simply by placing them in a separate node, clearing such “noise”. |
In the process of decision tree building, too complex structures can be created that do not fully represent the data. |
| Ant colony optimization algorithms | The method uses the memory of the entire colony, which is achieved by simulating the release of pheromones. The ability to use the method in dynamic applications (adapting to changes in the environment). The method has a higher speed of finding the optimal solution than traditional methods. |
The method is prone to falling into the local optimal solution and its result depends on the tuning parameters, which are selected only experimentally. |
| Genetic algorithm | The method provides a decrease in descriptive complexity and an improvement in the quality of recognition in comparison with standard methods of feature extraction for a classifier. It provides simple and transparent implementation of information encoding and decoding, as well as a reduced likelihood of looping of the search process in local optima. The method does not contain any restrictions on the type of objective function (fitness function). It can be integrated with artificial neural networks and fuzzy logic. |
The method has a highly iterative nature of the algorithm, a significant dependence of the search efficiency on the selected parameters, as well as a high probability of premature convergence of cyclic search. The disadvantage of this method is its implementation complexity and requirement of a significant amount of computational resources. |
| Artificial neural network | The method has the ability to reproduce complex nonlinear dependencies for a large number of input parameters. Thanks to its learning ability, the neural network can solve problems with unknown patterns and dependencies between the input and output data, which allows working with incomplete data. The neural network can detect parameters that are not informative for analysis and do their screening, and therefore there is no need for preliminary analysis of the input data. |
The method has a long training time and the need for a large amount of data. Neural networks are not capable of providing accurate and unambiguous answers. |
| Nearest neighbour algorithm | Ease of use of the results obtained. The solutions are not unique for a particular situation, it is possible to use them for other cases. The purpose of the search is not to guarantee to find the right solution, but the best possible one. |
This method does not create any models or rules that generalize previous experience. To choose a solution, they are based on the entire set of available historical data, so it is impossible to say on what basis the answers are based. When using the method, it is necessary to look over the whole training sample during recognition, a consequence of this is the computational complexity. |

where, g is the generation; n is the size of the population; X is a gene [15].
In the developed genetic method, a vector consisting of columns of the weight matrix W acts as a chromosome, and the following formula (2) is used to encode possible solutions in chromosomes:

where, M is the length (bit) of one gene; qi is an integer value of the i-th gene of chromosome from the set {0, .., 2M}; di is a real number from the range of admissible solutions [vi, wi] of the optimized parameter.
After the initial population is formed, the suitability of the suitability function for the W matrix is assessed. Since the weight matrix is a part of a neural network that recognizes pathologies, it must be reduced to such a value that the suitability function value is maximal. To do this, the obtained source vector Y should be compared with the reference sample Y′ using the Euclidean distance. Consequently, the suitability function is determined on the basis of the calculated distance and is calculated by formulas (3) and (4):


where, R is the Euclidean distance, y is the value of the original vector Y, Y′ is the value of the vector Y′, which is the reference sample.
The assessment of the suitability of the current generation is calculated by formula (5):

where, f is the suitability function; k is the generation number [16].
Then the method selects those individuals whose genetic material will participate in the formation of the next population of decisions, i.e. in the creation of the next generation. The developed genetic method uses the method of selection, called the roulette method. The idea of this method is that individuals are selected using n roulette runs, where n is the number of individuals in the population. The roulette wheel contains one sector for each individual in the population. The size of the i-th sector is proportional to the probability of an individual entering a new population P(i) and is calculated by formula (6):

where, i is the suitability of the i-th individual. The expected number of copies of the i-th chromosome after the roulette operator is determined by formula (7):

In this selection, members of the population with a higher value of the suitability function will be selected more often than individuals with low values [17].
The application of genetic operators to chromosomes obtained by selection leads to the formation of a new population of offspring from the parent population created in the previous step. In the proposed genetic method, two main genetic operators are used: The crossing operator and the mutation operator.
Formation of a new generation occurs using the operators of selection S, crossing C and mutations M by formula (8) [17]:

Uneven arithmetic crossing is chosen as the crossing operator. When using this crossing, based on the values of the genes of the parent chromosomes P1 and P2, two descendants p1 and p2 are created. The values of the i-th genes of descendants are calculated by formulas (9) and (10):


where, s
 [0; 1] is a real coefficient that is generated randomly on each iteration [18].
As a result of the work of the crossing operator, two new individuals appear in the population. To control the number of crossover operations, the cross factor fc which determines the proportion of descendants produced at each iteration is used. The number of offspring is determined by the formula (11):

where, Ck is the number of offspring obtained, fc is the crossing coefficient, Sp is the size of the initial population, round is the rounding operation [19].
A high value of the crossing coefficient increases the area of the search space and reduces the risk of falling into the local optimum. However, a value of this parameter that is too high will lead to an increase in the time of the method work, as well as to excessive exploration of unpromising areas of the search space.
The mutation is performed with a certain probability Pm, in which the allele is replaced by a random value. It is selected with equal probability in the field of gene determination. Note that it is due to mutation that the field of genetic search is expanding.
When performing a mutation, the mutation coefficient Rm is set and a random number Nm is generated, evenly distributed on the segment [0, 1]. If Rm> Nm, then the mutation point z is randomly selected [19].
We use a special mutation operator obtained by additive convolution of the mutation operator based on the gain and the classical mutation operator. The use of gain-based mutations allows the introduction of new genetic material into the population. This leads to an extension of the search space, which is necessary for an effective search for the optimum. The use of two types of mutation operator in one method at once makes it possible to carry out an effective search for the optimal solution, to obtain good results in a short period of time, and also to identify “neighbourhood of solutions” that is the most suitable for study [19].
Individuals with mutations remain in the population until a new population begins to form. The number of individuals that mutate is determined by the formula (12) and (13):


Where, Cm is the number of individuals obtained using the mutation operator, Ck is the number of offspring, fmp is the classical mutation coefficient, fmα is the mutation coefficient based on gain, fm is the total mutation coefficient, and round is the rounding operation [19].
The developed method allows one to regulate the balance between the classical mutation operator and the mutation based on the α-gain. With this feature, it is possible to adjust the method to the conditions of a specific task. With an increase in the proportion of usage of the classical mutation operator, the accuracy of the search in the vicinity of the best solutions based on the current genetic material increases. And with an increase in the proportion of mutations based on α-growth, the overall search space grows and the gene composition of the population is updated [20].
How much the population has increased can be determined using the total mutation coefficient fm and the crossing coefficient fc. The size of the current population is determined by the formula (14):

where, Sc is the size of the current population, Sp is the size of the initial population, Ck is the number of offspring obtained, Cm is the number of individuals obtained using the mutation operator [20].
The method then evaluates the suitability of the offspring obtained as a result of the crossover operation, as well as the individuals that were obtained as a result of the mutation operator. Based on the obtained values of the suitability function for each individual of the new population, the individuals with the smallest values of suitability function are removed. The method implements this task by sequentially removing an individual with a minimum value of the suitability function until the population size returns to its original value. The number of “dead” individuals is calculated by the formula (15):

where, Cd is the number of “dead” individuals, Ck is the number of offspring obtained, Cm is the number of individuals obtained using the mutation operator [20].
In the developed method as a stop criterion the mechanism based on an absence of changes of suitability function of the best individual during a certain number of iterations is used. It is also advisable to stop the method after reaching a certain number of iterations. If the stop condition is fulfilled, the algorithm gives the optimal solution, represented by the best individual, which will be transferred to the neural network as the initial matrix of weights W [20].
Thus, as a result of the work of the genetic method, a set of weight coefficients is obtained that ensure the correct operation of the neural network. The paper develops a modified genetic algorithm that uses real, not binary, numbers as gene values. This is because genes serve as the number of neurons that will be fed to the neural network.
4.2. Experiments of Initialization Methods for Initial Population in Evolutionary Algorithm
A dataset with pictures of pneumonia called “Chest X-Ray Images (Pneumonia)” was used to develop and test the models [21]. This data set was divided into three other datasets: one for training, the second for neural networks accuracy testing at the end of each era, and the third for final verification after neural networks training. Each dataset contains two folders, pictures with pneumonia and without pneumonia.
An important requirement for modeling data is their quantity and quality. If the data contain excessive noise, unclear sequence and incorrect format - this negatively affects the accuracy of forecasts, performance and quality of models [22, 23].
Also, data intended for use as training datasets for classical and evolutionary methods should be normalized and converted to one type, in order to reduce error and improve training quality.
Processing of the initial data before feeding to the model was done in the following sequence:
- Provided labels, class numbers for all photographs for division into two classes: pictures with pneumonia and without pneumonia;
- Conversion of data to the types that will be used in the calculations [24, 25].
To begin work on this topic, it was decided to test the quality of the work of classical methods of pattern recognition. A number of experiments were performed with such classical pattern recognition methods as:
- Decision trees
- Method of the nearest neighbor
- Ant colony method
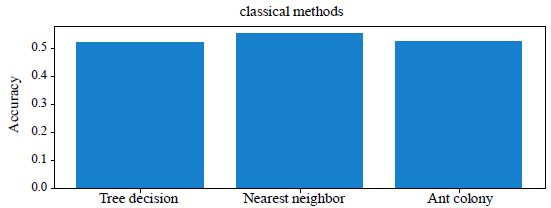
The results of the comparison of classical methods in terms of accuracy and execution time are given in Table 2. Comparison of the accuracy of classical methods is shown in Fig. (1).
| Methods | Accuracy, % | Time, Sec |
|---|---|---|
| Decision trees | 52% | 280 |
| The method of the nearest neighbor | 55% | 435 |
| Ant colony method | 52% | 194 |
From the Table 1 and Fig. (1) you can see that the best result is obtained using the method of the nearest neighbor, the accuracy of which is 55%. It showed a high percentage of correct answers in 435 seconds. Decision trees and the ant colony method showed 52% accuracy in solving problems in 280 seconds and 194 seconds, respectively. But the ant colony method is more optimal, as it spent the least time, 194 seconds, and gave 3% less accuracy than the nearest neighbor method. We will not dwell on the classical methods, we will move on to testing neural networks.
Next, we consider and compare the results of classical and modern neural networks, from a single-layer perceptron to convolutional neural networks. Theoretically convolutional neural networks are well suited for this task, but this should be tested in practice. The inspection will take place under the same conditions:
- Number of epochs
- Sub-sample size
- The size of datasets for training, testing, verification
- Metrics
- Optimizer
The following neural networks were chosen for experiments [26-33]:
- NN single-layer perceptron
- MLP two-layer perceptron
- RBNS - radially basic neural network
- CNN - convolutional neural network
- Inception v3- Inception v3 convolutional neurometer
- LSTM network of long short-term memory
In Figs. (2 and 3) the training of the RBF neural network is shown.
From Figs. (2 and 3) it can be seen that the RBNS model will differ from the previous ones, but is also not suitable for solving this problem. In Fig. (3) it is observed that in the 13th epoch neural network learning falls sharply, but the check on the validation dataset gives 58% accuracy.
In Figs. (4 and 5) shows the learning of the CNN neural network.
From Figs. (4 and 5) you can see that the CNN neural network gives a fairly high accuracy. Visually, the graph of the accuracy of the network accuracy for the CNN model (Fig. 5) is similar to the graph of the error of the network accuracy for the model NN and MLP, but the difference is that the validation dataset gave a much higher result. So in the process of learning of this network an “overfitting” occured. It can be corrected by changing the hyper and macro parameters of the neural network.


In Figs. (6 and 7) shows the training of the Inception neural network.
From Figs. (6 and 7) you can see that the Inception neural network gives 85% accuracy for about 3 learning epochs, and then gives less successful results. This suggests that further training is unlikely to yield better results.


In Fig. (8) shows the training of the LSTM neural network.
From Fig. (8) it can be seen that learning takes place during the first epochs. Thus, the neural network is not suitable for solving the problem of pattern recognition of pneumonia. High accuracy on the test dataset is not the final criterion for checking the performance of the neural network. The end result can be obtained by checking the neural network on the validation set.
| Network Name | Accuracy on the Validation Set, % | Time, Sec | Number of Epochs |
|---|---|---|---|
| NN | 52% | 390, sec | 25 |
| MLP | 54% | 410, sec | 25 |
| RBF | 58% | 910, sec | 25 |
| CNN | 75% | 3334, sec | 25 |
| Inception | 68% | 4158, sec | 25 |
| LSTM | 50% | 2154, sec | 25 |

Let's compare neural networks on the following grounds Table 3, accuracy on the validation set, working time and number of epochs.
From Table 3 you can see three columns that have the most value for testing and comparing neural networks. Accuracy on the validation set means how the neural network works with images that it has not seen in the learning process. The neural network may show a high percentage of correct answers on the test dataset (for example, about 80-90 percent), and on the validation dataset it will show a low percentage (for example, about 60-70 percent). Training time is also an important criterion, because if the training lasts long enough, it will be impossible to predict systemic and other failures. The last criterion, the number of epochs. In the presence of a large number of epochs, the neural network will be “overfitted” and will give a large error on the validation dataset, and on the test dataset the accuracy will be quite high, about 90%. From Table 3 it can be seen that the best accuracy result shows CNN (75%). Next one is Inception (68%), followed by NN (52%) and MLP (54%), followed by LSTM (50%). Optimal choice would be CNN neural networks, based on accuracy (75%) \ training time (3334 sec).
Let's compare the work of classical methods with neural networks. Table 4 shows the results of classical methods and neural networks on those parameters that can be compared.
| Names | Accuracy, % | Time, Sec |
|---|---|---|
| Decision trees | 52% | 280, sec |
| The method of the nearest neighbor | 55% | 435, sec |
| Ant colony method | 52% | 194, sec |
| NN | 52% | 390, sec |
| MLP | 54% | 410, sec |
| RBF | 58% | 910, sec |
| CNN | 75% | 3334, sec |
| Inception | 68% | 4158, sec |
| LSTM | 50% | 2154, sec |
In Table 4 it can be seen that in first places still CNN (75%), Inception (68%) and RBF (58%). They are followed by perceptrons and methods that have approximately the same result.
Table 5 presents the parameters that were used to upgrade CNN and their values.
| Parameter Names | Value |
|---|---|
| Number of individuals | 10 |
| Number of populations | 10 |
| Number of neurons in the first layer | 0 – 128(at 0 the layer is not created) |
| Number of neurons in the second layer | 0 – 128(at 0 the layer is not created) |
| Number of neurons in the third layer | 0 – 128(at 0 the layer is not created) |
| Number of neurons in the fourth layer | 0 – 128(at 0 the layer is not created) |
| Number of neurons in the fifth layer | 0 – 128(at 0 the layer is not created) |
| Dropout chance | 0.2 – 0.6 |
In Figs. (9 and 10) you can see graphs of training of the best model of the neural network, which was obtained after the modernization with the help of a modified GA.
From Fig. (10) it can be seen that the modernization of the CNN neural network gives a significantly better working time, as well as an increase in prediction accuracy.
Let’s make a comparative analysis of the CNN neural network and the CNN neural network modernized with GA (Table 6).
Thus a modified genetic method has been developed to solve the problem of radiographic image recognition, which will develop an effective NN architecture and increase the accuracy of recognition of pathological structures on radiographs.
| Names | Accuracy, % | Time, Sec |
|---|---|---|
| CNN | 75% | 3334, sec |
| CNN– GA (modified) | 81% | 2563, sec |


5. RESULTS AND DISCUSSION
Analyzing the obtained experimental results, it can be seen that when comparing classical recognition methods (Table 2), the best results in recognition accuracy were obtained with the nearest neighbor method, the recognition accuracy of which was 55%. For comparison, the recognition accuracy of the decision tree method and ant colony is 52%. However, the execution time of the nearest neighbor method was 435 s, which is much longer than that of the decision tree and ant colonies, in which the execution time is 280 s and 194 s respectively. Testing of classical and modern neural networks was carried out, from a single-layer perceptron to convolutional neural networks. During the training of the RBNS model, the following values were obtained: the network loss was 1.5, and the recognition accuracy was 50%. From Fig. (3), it can be seen that starting from the 13th epoch the training of RBNS neural network rapidly falls and stops decreasing. This indicates that the model becomes trained and further training no longer occurs. During the study of the CNN neural network, it was determined that the value of the loss network is 0.45, and the recognition accuracy is 81%. The Inception model was tested and it was found that the loss of the neural network is 2.3, and the accuracy of its recognition is 75%. So, from the results obtained, you can see that the use of neural networks gives an advantage in recognition accuracy. A comparison was made between classical methods and neural networks (Table 4), which were tested on a validation set, and it was found that the best results of pathological structures recognition on radiographs were obtained using CNN. The Recognition Accuracy of this model was 75% (for comparison, the accuracy of the ant colony method is 52%), but it is inferior in terms of execution time, which is 3334 s (the ant colony method execution time is 194 s). To overcome this problem, a modified genetic method for optimization of parameters of the model based on a convolutional neural network was developed. Testing the developed method (Table 6) showed that it allows increasing the recognition accuracy up to 81% and reducing the computation time to 2563 s, which is an acceptable indicator.
A convolutional neural network has a large number of hyperparameters that must be selected in the process of a neural network building and on which the learning outcome will significantly depend. The main parameters affecting the quality of X-ray image recognition include: the architecture of the convolutional neural network, the type of activation function, the learning rate parameter, the number of learning epochs, and the packet size. Sequential optimization of the listed parameters was performed. From the beginning, a neural network was tested with the following hyperparameters: the learning rate is 0.001, the size of one bundle is 20 elements, the number of epochs is 25, the activation function is ReLU. The recognition accuracy of this convolutional neural network model without appropriate selection of parameters was 76.58%, which can be increased by adjustment of a number of neural network parameters.
Then the selected activation function was changed from ReLU to ELU. In ReLU activation function, when the input value is less than zero, the output value and the derivative will also be equal to zero. This will result in the neuron being turned off, so that the neuron will no longer be updated in the future. ELU solves the problem of “paralysis” of the network that arises in the case of ReLU, and neurons are able to produce negative values. As a result, the error on the validation data decreases and approaches the error on the training data as much as possible, and the recognition accuracy of this model was increased to 80.54%.
A technique was tested when several images are fed to the input of the neural network at once during the training. As a result at each step of training, the error function obtained for several images at once will be minimized. In theory it should increase the learning rate. As a result, it was found that the larger the number of images simultaneously supplied, the fewer steps are needed to train the neural network. The total training time was calculated for different batch sizes. It showed that the time increases almost linearly and the rate of time growth is much higher than the decrease in the number of steps. Consequently, the increase in the size of the batch did not prove itself.
During selection of the structure of the convolutional neural network, the following trends were observed. Structures with an average number of neurons are more effective for these training parameters. A large number of neurons in a layer leads to a lack of resources for training. Accordingly, for training such networks, it is necessary to use a large number of epochs, which significantly increases the computational complexity.
An increase in the number of neurons in a layer with increasing layer number has a positive effect on efficiency.
Structures in which the size of the convolution kernel decreases with increasing layer number are more efficient.
Observing the course of training of the convolutional neural network, it was found that approximately on 25th epoch the error on the validation sample is as close as possible to the error on the training data, and then there is no significant change in it. A convolutional neural network trained over 25 epochs showed the best recognition results compared to using 20 and 40 epochs.
By reducing the number of learning epochs to 25 and adding the Dropout regularization, it was possible to increase the recognition accuracy of X-ray images to 81% and to avoid the effect of the neural network overfitting.
So, an effective modified genetic method has been developed, which implements part of the intellectual actions traditionally performed by an expert in searching for signs of pathology on an x-ray of the lungs.
CONCLUSION
The problems of machine classification and recognition of radiographic images, as well as the improvement of artificial neural networks, which are used to improve the quality and accuracy of detection of abnormal structures on chest radiographs, were considered. An overview of existing methods of deep learning and methods of X-ray recognition is made. A comparative analysis of classical methods and modern neural networks, from a single-layer perceptron to convolutional neural networks in terms of accuracy and execution time was conducted. It was found that the best results of recognition of pathological structures on radiographs were obtained using a convolutional neural network. The recognition accuracy of this model was 75% (for comparison, the accuracy of the ant colony method is 52%), but it isn't as strong in the execution time, which is equal to 3334s (the execution time of the ant colony method is equal to 194s). To overcome this problem, a modified genetic method for optimization of parameters of the model based on a convolutional neural network was developed. The presented method allows us to solve the problem of recognition of diagnostically significant signs of pneumonia on an X-ray of the lungs. The fundamental difference between the proposed genetic method and existing analogs is in the use of a special mutation operator in the form of an additive convolution of two mutation operators, which reduces neural network training time and also identifies “neighborhood of solutions” that is most suitable for investigation. Testing of the developed method showed that its recognition accuracy increased to 81%, and time decreased to 2563s, which is an acceptable indicator. Practical use of the developed method will reduce complexity, increase reliability of search, accelerate the process of diagnosis of diseases and reduce a part of errors and repeated inspections of patients. In the future, further research is possible for the development of systems for the early diagnosis of respiratory diseases, as well as those associated with the development of mathematical and algorithmic methods and software for an automated workstation for a radiologist.
ETHICS APPROVAL AND CONSENT TO PARTICIPATE
Not applicable.
HUMAN AND ANIMAL RIGHTS
No animals/humans were used for studies that are the basis of this research.
CONSENT FOR PUBLICATION
Not applicable.
AVAILABILITY OF DATA AND MATERIALS
The datasets used and/or analyzed during the current study are available from the corresponding author [https://www. kaggle.com/paultimothymooney/chest-xray-pneumonia?fbcli d=IwAR0EI6EteRRaMZmYgcrqbNR0zYZ4dp0TlzR25TRenCboiHTIcC7mX47B2V4] on request.
FUNDING
None.
CONFLICT OF INTEREST
The authors declare no conflict of interest, financial or otherwise.
ACKNOWLEDGEMENTS
The work was performed within the framework of the research theme “Methods and means of decision-making for data processing by the intelligent systems of pattern recognition” (State registration number 0117U003920) at the Department of Software at Zaporizhzhya National Technical University.

