
Mental Health Prediction in Students using Data Mining Techniques
Authors Info & Affiliations
Abstract
Background:
Mental health issues are common among university students. Depression poses a significant obstacle to long-term learning and the viability of the educational system as a whole. Many students enroll in colleges in other states, leaving their friends and family behind. Some students struggle to adjust to competition in a foreign setting and the pressures of college. With numerous technical and non-technical universities, Odisha is currently rising as the center of education. There has been much research that has examined mental health issues in India, but few of them specifically target university students in Odisha. Our study aimed to predict the prevalence, factors, and effects of mental health problems (depression, social connectedness, and anxiety disorder) on college students in Odisha.
Methods:
An online survey was conducted that was circulated to several student classes at 3 colleges of an university, and it yielded 109 results. The survey included socio-demographic information along with the General Anxiety Disorder Questionnaire (GAD-7), the Revised Social Connectedness Scale (SCS), and a nine-item Patient Health Questionnaire (PHQ-9) scale. Correlation analysis has been applied to identify the correlation among attributes and regression analysis was applied for the prediction of the mental health status of the students based on the given attribute.
Results:
The prevalence rate of depression among students was determined to be 61.90%. Years of college and physical health showed a significant correlation with depression. Students in the early years of college have shown a greater depression rate. It was observed that anxiety and depression were positively correlated and social connectedness and depression were negatively correlated. We also found academic performance and depression to be correlated with each other. The hyperparameter-tuned logistic regression model provided better result in comparison to the other existing models in the literature.
Conclusion:
The findings hint at the high prevalence of depression in students and its association with anxiety disorders, social connectedness, and academic performance. This study emphasises how crucial it is for decision-makers to develop preventative measures and policies for a sustainable educational system.
1. INTRODUCTION
Depression is a prevalent mental illness affecting 3.8% of adults in the world, which amounts to approximately 280 million people in the world [1, 2]. India is described as the most depressed nation in the world, with at least 6.5 percent of the population suffering from some significant mental illnesses, according to a study by NCMH (National Care of Medical Health) and published by WHO on World Mental Health Day 2018 [3]. Mental health problems can lead to suicide, which is the fourth leading cause of mortality for those between the ages of 15 and 29 [4]. In this phase, a person's life is in a state of complete transition, and it is most susceptible to development between the ages of 18 and 25. This period also marks the entrance of some young adults into university [1]. Making independent decisions about their lives, blending into a new environment, adjusting to the pressure of college, and interacting with a variety of new people can take a toll on some students. This may be extremely stressful for some people, and some pre-existing mental health problems might get aggravated. This may sometimes lead to mild to severe depression in students, which can affect their academic performance or, in the worst case, lead to suicide. One of the main causes of severe anxiety and suicidal thoughts among young adults is exam stress. Therefore, it is imperative to address the problems before they worsen and become lethal at an early stage. The daily activities, social lives, and academic lives of students can all be impacted by depression and anxiety. Thus, it is necessary to comprehend the root causes and focus on developing policies that benefit students and provide them with a sense of security, which can lead to a happier environment and improve student performance.
The key risk factors for mental health problems, such as depression and anxiety disorders, among students, have been identified in the current study. Additionally, various machine learning models have been employed to predict patients' mental health status. According to research, anxiety and depression are the two main causes of mental health problems in students. Social connectivity and academic performance are also regarded as two important elements in the current study. The students of the State of Odisha have not been the subject of any research. Because of this, an ideal model was selected to forecast a student's state using data from university students in the State of Odisha and a methodical adaption of numerous machine learning models to identify the elements causing depression. With numerous technical and non-technical universities, Odisha is currently rising as the centre of education. Globally, COVID-19 has had an impact on both the educational system and people's mental health. Our aim for this research was to investigate the mental health of university students in the state of Odisha. The goals of the work have been broken down into five different phases. The first step was to poll students at different colleges in Odisha and compile a live dataset of them. Pre-processing the gathered data, developing a prediction model, correctly training the dataset, performing feature selection, contrasting behaviour with and without keeping all attributes, and deciding which algorithm produces the best model based on elements, like precision, recall, f1-score, and accuracy, have all been part of the second phase. Finding the relationship between social connectivity and anxiety disorders and depression constituted the third step. Finding the sociodemographic characteristics that can contribute to depression was the fourth step, and the fifth step involved looking at how depression affects a student's academic performance.
2. LITERATURE REVIEW
A vital component of the human body is the mind. So, it is important to have a healthy mind for the proper functioning of life, but nowadays, mental health issues have become eminent and are one of the leading causes of death across the globe. The fundamental problem is delayed diagnosis due to certain factors. Depression can lead to a number of other mental health problems, which may restrict a person from doing daily activities or even make them suicidal. To address the issue, several research projects have been carried out in the current study to bring about a change in society. This section provides an overview of the elements influencing students' mental health as well as current research on machine learning techniques for mental health problem prediction. Additionally, through this review, we have tried to identify the widely used machine learning algorithms used in this field.
2.1. Review on Factors Influencing Student’s Mental Health Issue
Seera et al. have proposed [5] multiple logistic regressions to determine the associations between selected factors and help-seeking from mental health professionals (MHPs). All analyses have been performed using IBM SPSS, version 21. The dataset involved 593 students, where 311 have been Thai students and 282 Indian students. In Thailand, compared to India, fewer pupils have been reported to seek expert assistance. In both nations, not being willing to seek assistance from MHPs was connected with having a high GHQ score, which indicates a likelihood of having mental health problems.
Lipson et al. studied over 350,000 students’ data from 373 institutions [6]. The data included the dataset between 2013 and 2021. The minimum age requirement to take the survey was 18 years old or older. Through athletics and academic advising, universities play a significant role in detecting risk factors and mental health issues of students. Previous research has shown a higher rate of mental health problems in students of colour. The data date back to the beginning of COVID-19.
In a paper reported previously [7], the authors have collected 300 students’ data from several universities of China. Obsessive-compulsive disorder, interpersonal sensitivity, and depression have been found to be the top three problems at the university level. Despite the fact that numerous studies have looked at mental health difficulties among Chinese college students, little has been said about the connections between mental health and factors, such as personal and familial situations, academic performance, and social support. In order to develop policy or psychological interventions and lessen mental health issues among university students in China, comparative studies are required to better understand the underlying mechanisms of mental health problems in college students and their long-term effects on the students' career development.
Johnson et al. collected datasets from 21 studies (15 randomized controlled trials and 6 non-randomized studies) [8]. The research was done from April 2006 to February 2020. The treatment gap for mental diseases may be bridged in part by digital technologies. Further, the authors have analyzed the research on technology-based interventions to enhance help-seeking for mental health and hypothesized that such interventions could be significant in favorably affecting the same.
Scheel et al. gathered information from 275 students (18–55 years old) [9]. 66% of respondents reported they had never considered suicide; 28.6% said that it had crossed their minds occasionally, 3.7% said it had occurred to them seriously, and 1.5% indicated that they had tried to kill themselves one or more times. The rates of suicidal ideation and attempts have been found to be considerably lower than those observed in studies of American Indian adolescents in general, and the proportion of students reporting current suicidal ideation has been very similar to the 13% discovered. However, 57% of participants reporting suicidal ideation have indicated that they would not seek the assistance of mental health professionals. 14% of individuals considering suicide said they were likely to use none of the available resources for assistance.
Mishra et al. collected datasets on 200 patients (125 males and 75 females) in AIIMS, New Delhi, from July-August 2009, comprising many catchment areas and also distant states [10]. A group of patients with mental health issues most frequently sought out psychiatrists as their first point of contact, followed by non-psychiatric medical professionals, such as family practitioners. The cost of treatment with non-psychiatric doctors was found to be higher than others. The authors suggested that to avoid treatment delays, there is a need to spread awareness about mental health.
Alsahali collected data from 330 students, where more than one-third (36%) of the participants agreed that people with mental illnesses would go to mental health clinics for professional assistance, and 32.4% of them said they would go to a doctor if they experienced emotional problems [11]. 60% of participants said they would not feel at ease discussing their personal troubles with healthcare professionals, and 48.8% said that they would feel ashamed if their friends knew they were obtaining professional assistance for emotional problems. Approximately 59% of the students thought that those with mental illnesses would be more likely to commit crimes.
Nguyen et al. gathered data from 268 students (67 domestic and 201 international) [1]. Intercultural interactions can lead to acculturative stress when international students settle into their new surroundings; thus, they must adjust to resolve any disputes that may arise. The fact that international students experience depression at a higher rate than domestic students may result from a variety of factors. First, acculturative stress is more intense for international students attending an international university, which increases their likelihood of developing depression. Second, compared to domestic students, international students have less access to mental health services. Third, compared to domestic students, international students have fewer options for finding sources of assistance. The main hypothesis that was supported by the study was that social connectedness and acculturative stress are both significantly negatively correlated with depression in both domestic and international students.
After studying the above literature, it has been found that there are several factors that can lead to mental health issues among students, of which depression and anxiety disorders are more prevalent. The symptoms of depression include severe sadness, anger, loss of interest, sleep disorder, appetite disturbances, slow thinking, suicidal thoughts, and guilt. Anxiety disorder is basically termed as an inability to regulate fear or worry. In our survey, the data have been collected based on depression, anxiety disorder, social connectedness, and class performance.
2.2. Machine Learning Approaches Adapted to Predict Depression and Anxiety Disorder
In a previous paper [12], the authors considered 4041 patients’ datasets in STAR*D and 665 patients’ datasets in COMED. A repeated k-fold cross-validation technique has been applied to create multiple test-train folds. 25 top predictors have been extracted after applying a data-driven feature selection approach. The gradient-boosting machine learning algorithm has been trained with the top 25 features to predict the treatment outcomes. In this study, the gradient boosting model showed an accuracy of 64.6%.
A machine learning approach to identify the various levels of mental health concerns has been suggested by Ahmed et al. [13]. Five distinct AI techniques, including convolutional neural networks, support vector machines, linear discriminate analysis, k Nearest Neighbour, and linear regression, have been employed in the study to analyse data related to anxiety and depression. The CNN model had shown the highest accuracy, with 96% for anxiety and 96.8% for depression.
Sau et al. proposed a predictive model for automated diagnosis of anxiety and depression among older patients using machine learning algorithms [14]. The authors have evaluated 10 classifiers with a dataset of 510 geriatric patients and tested with 10-fold cross-validation method. Out of 10 classifiers, the random forest has shown the highest prediction accuracy of 89%.
Generalized anxiety disorders were distinguished from healthy people and major depressive disorders by Hilbert et al. using machine learning techniques [15]. They employed a sample of people with generalized anxiety disorders, healthy individuals, and people suffering from serious depression to create the dataset. They used binary support vector machine and discovered that using the clinical questionnaire data made it difficult to predict generalized anxiety disorders. For the classification of normal case and disorder, the input involving the inclusion of cortisol and grey matter volume could achieve an accuracy of 90.10% and 67.46%, respectively.
| - |
Total (N=105) (%) |
Male (N=64) (%) |
Female (N=41) (%) |
|---|---|---|---|
| Year | |||
| 1st | 28.57 | 34.375 | 19.51 |
| 2nd | 12.38 | 6.25 | 21.95 |
| 3rd | 15.23 | 12.5 | 19.51 |
| 4th | 43.8 | 46.87 | 39.02 |
| Partner | |||
| Yes | 20.95 | 14.06 | 31.70 |
| No | 79.04 | 85.93 | 68.29 |
| Religious | |||
| Yes | 79.04 | 21.875 | 19.51 |
| No | 20.95 | 78.125 | 80.48 |
| Raised | |||
| Rural | 23.76 | 28.125 | 19.51 |
| Urban | 75.23 | 71.875 | 80.48 |
| Exercise | |||
| Occasionally | 51.42 | 50 | 53.65 |
| Often | 26.66 | 26.56 | 26.82 |
| Seldom | 21.90 | 23.43 | 19.51 |
Mengjun Luo has proposed [16] an improved decision tree, the improved ANN algorithm. In this study, the dataset has been collected from 49 students. The pressure on people with respect to living conditions, opportunities for learning and companionship, and employment conditions have been rising as a result of society's rapid and diverse development, which poses a serious psychological problem.
From the above literature, it can be observed that not a single classifier has given a better result for all the datasets. As classifying mental health data is generally very challenging, the features used in the machine learning algorithms significantly affect the performance of the classification. The performance of the classifier is dependent on the dataset used. Sau and Bhakta [14], Ahmed et al. [13], and Hilbert et al. [15] have applied the random forest and support vector machine in the classification of mental health problems, and they have provided comparatively better results. Most of the literature studies have involved a small sample size, and to the best of our knowledge, logistic regression and linear regression have not been efficiently used for this specific problem.
3. MATERIALS AND METHODS
3.1. Study Site
In this research, three colleges in Odisha have been selected as the study sites. The colleges have been selected because they accommodate students of ages 18-25, both from Odisha and outside of Odisha. These colleges also involve students from various branches and departments.
3.2. Participants
Males contributed to 49.2% of the reported population, while females comprised 59.8%. With 43% of students in their fourth year of college, just 28% in their first year, and 13.1% and 12.1% in their second and third years, respectively, there has been found a significant gap in the years of the students studying there. 78.5% of respondents have reported as not having an intimate partner, and 79.4% have reported to be religious. Only 24.3% of participants have reported to be raised in rural areas, compared to 75.7% who said that they were raised in an urban setting. When asked how often they worked out, only 26.2% of participants reported working out often, compared to 21.5% who said that they worked out seldom (Table 1).
3.3. Instruments of Measurement
The participants were required to fill out questionnaires on socio-demographic information, Patient Health Questionnaire (PHQ-9) [16-18], revised Social Connectedness Scale (SCS) [19, 20], General Anxiety Disorder (GAD-7) [21, 22], and questionnaire on academic performance [23-29].
3.3.1. Socio-demographic Questionnaire
The participants were questioned about their age, gender, college year, place of upbringing, intimate partner, exercise, and religion. The options given for raised were urban and rural, and for exercise, the options were seldom, often, and occasionally. Questions related to religion and intimate partner were both yes-or-no questions.
3.3.2. Patient Health Questionnaire
The PHQ-9 questionnaire is used to measure depression in adults [17, 18]. It is an easy-to-use self-administered tool to measure depression in adults based on the Diagnostic and Statistical Manual for Mental Disorders 4th Edition (DSM-IV). It serves two purposes by inquiring about different symptoms in the last two weeks. First, it can be used to diagnose depression, and second, it provides the severity of depression, from minimal depression to severe depression. The scoring is done from 0 to 3, where 0 is not at all and 3 is nearly every day.
3.3.3. Social Connectedness Scale
The Revised Social Connectedness Scale is a 20-item questionnaire that is used to evaluate the degree to which an individual feels connected to themselves and their environment [19, 20]. The 6-point Likert scale is used to assign scores to each item. A higher score denotes a stronger sense of connection to others. The scale spans from 1 (strongly disagree) to 6 (strongly agree).
3.3.4. General Anxiety Disorder Scale
The General Anxiety Disorder scale is a 7-item self-administered tool used for screening and indicating the severity of general anxiety disorder [21, 22]. It was developed by Spitzer and colleagues in 2006 [23]. Each item in the 7-item scale is based on the problems faced in the past two weeks, and the scores for each question range from 0 (not at all) to 3 (nearly every day).
3.3.5. Academic Performance
For the purpose of assessing the participants' academic performance, the current Cumulative Grade Point Average (CGPA) was considered [29]. The participants could choose from the three options: less than or equal to 7, greater than 7 but less than 9, and greater than 9.
3.4. Procedure
The research was conducted based on grounded theory, where the data from different university students have been collected in a systematic way using a survey link. The survey was conducted in an online format through a Google Form for two reasons: firstly, it is very common and used by a lot of people, and secondly, it was more cost-effective and easier to manage and maintain. The survey was distributed in various branches and departments of three colleges in Odisha. The survey was made available online and participants could fill it out at their convenience. The total response was 107 (link to the survey: https://forms.gle/usLPUkLFt5ZHbbu3A).
Prior to filling out the form, the participants were asked for their consent. Each participant had to read a consent form outlining the purpose, research methods, research team, their selection as a research subject, and potential benefits, risks, and discomforts of participating in the research. The participants had the option to choose between yes or no to participate in the research. By selecting “no,” the participants had the option to leave the survey at any point. In the case of agreeing to take the survey, a list of questions was shown to the participants.
3.5. Methodology
Microsoft Excel was used to edit the unprocessed data retrieved from the Google form. The various stages of data analysis we implemented are as follows: tables and graphs were first used to compare the data visually. The dataset was transformed into a .csv file, after which data cleaning, normalisation, one hot encoding, label encoding, and feature selection were carried out on the raw data. The dataset was then subjected to multiple logistic regression and multiple linear regression techniques. The pre-processed dataset was additionally subjected to the Chi-squared test and Pearson correlation in order to meet our additional goals.
3.5.1. Data Pre-processing
Data pre-processing is an integral part of data mining and it is used to clean and normalise the data before fitting it into a model for better accuracy. It is necessary because unprocessed raw data may contain noise, missing values, and duplicates that could compromise the model's accuracy. In our model, we had 0 duplicate values and 2 null values because participants refused to give consent for the survey. The dependent variables in the dataset were gender, raised in an urban or rural area, year of college, being religious, doing exercise, social connectedness, and anxiety disorder. Moreover, we performed one hot encoding and one label encoding on our categorical variables. One hot encoding was performed on gender, year, being religious, having a partner, and year of college, whereas label encoding was performed on doing exercise. The independent variable was depression, which was made categorical using the grading system in the PHQ-9 scale [17, 18]. We have assumed a person with a score greater than 5 to have depression. Afterward, feature selection has been performed on the dataset, and features with values greater than 0 have been maintained, while the others have been eliminated.
3.5.2. Prediction Models
A prediction model is a statistical method for predicting future values based on experiences and values from the past and the present [24]. The model functions by learning from previous and present data and incorporating what it discovers into a model that forecasts outcomes in the future. There are various types of predictive models available, such as time series, regression, association, clustering, decision trees, outlier detection, neural network, and factor analysis algorithms. We have used multiple logistic regression and multiple linear regression models in our study.
3.5.3. Logistic Regression
Logistic regression is a statistical method that is used for prediction analysis [25]. It predicts the probability of an event happening based on a number of independent variables. The independent variables in logistic regression can be both categorical and numerical, but the output is always categorical. When there is more than one independent variable, the logistic model is known as the multiple logistic regression model.
3.5.4. Linear Regression
Linear regression is one of the easiest models to find the relationship between independent variables (x) and dependent continuous variables (y). It analyses the input and determines whether and how changes in the input might impact the output variable. In order to minimize the difference between the anticipated and actual values, linear regression seeks to locate the line that fits the data the best. Linear regression works to find the best-fit line such that the error between the predicted and actual value is minimized [26].
3.5.5. Correlation
Correlation is a statistical technique to find the degree of relationship between two variables. The correlation coefficient ranges from -1 to 1. The value of 1 shows a perfect degree of correlation. The values above zero represent a positive correlation, whereas a value below zero shows a negative correlation between variables. There are many types of correlation techniques that can be used depending on the type of variables. The four most common types are Pearson, Kendall rank, Spearman, and Point-Biseral correlation. Pearson correlation has been used in our study to see the correlation between anxiety disorder and depression and social connectedness and depression.
3.5.6. Pearson Correlation
Pearson correlation is the most common statistical method for determining a relationship between two continuous and linearly related variables [27]. Pearson correlation assumes that both variables are normally distributed.
3.5.7. Hypothesis Testing
Statistical hypothesis testing is a technique used to find out if an assumption about a particular population is true or false. It is a set of techniques used to either accept or reject hypotheses.
3.5.8. Chi-squared Hypothesis
The Chi-squared hypothesis is used to find the statistical significance of categorical variables [28]. Chi-squared works by finding a difference between an observed value and an expected value. The null hypothesis is rejected if the critical value is less than or equal to the Chi-squared statistic or the significance level is greater than or equal to the p-value.
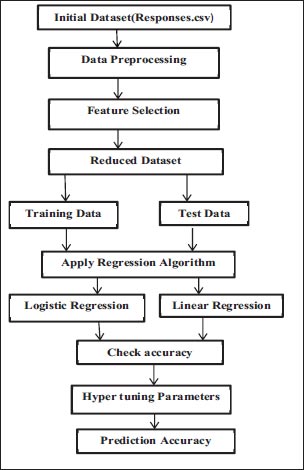
3.6. Model Diagram
The model diagram depicted in Fig. (1) describes the steps performed to predict the prevalence of depression.
The Google form's raw data were gathered and converted to.csv format (Responses.csv). The dataset was then imported into Jupyter Notebook, where data pre-processing was carried out. One hot encoding and label encoding were used during pre-processing, along with the removal of duplicates and null values from the dataset. Further, feature selection was carried out, where each feature's relevance was determined, and any features that had a value of 0 were deleted (reduced dataset). The data were then split into training and testing data, and both linear and logistic regression models were fitted to the data. Both models' accuracy was examined and compared. For greater accuracy, the logistic regression model's c parameter was hyper-tuned.
4. EXPERIMENTAL ANALYSIS AND DISCUSSION
4.1. Dataset Description
The initial dataset is shown in Table 2, where the row represents the samples and the columns represent the attributes for the study. Since the entire dataset could not be used in the test, only 5 samples are displayed in Table 2.
4.2. Feature Selection
The importance of each feature has been measured by the Chi-square test. Based on the test result, Table 3 represents the feature importance values for each feature. With respect to the feature importance value, some of the features have been selected as relevant features, and these are shown in Table 4. The table contains the list of features included in the reduced dataset.
| - | Gender | Year | Partner | Religious | Raised | Exercise | CGPA | Depression | Social Connectedness | Anxiety Disorder |
|---|---|---|---|---|---|---|---|---|---|---|
| 0 | Female | 4th | No | Yes | Urban | Seldom | >7 but<9 | 8 | 107 | 9 |
| 1 | Male | 4th | No | Yes | Rural | Seldom | >7 but<9 | 14 | 60 | 16 |
| 2 | Male | 4th | No | Yes | Urban | Often | >7 but<9 | 3 | 72 | 0 |
| 3 | Female | 4th | Yes | Yes | Rural | Occasionally | >7 but<9 | 14 | 62 | 8 |
| 4 | Male | 1st | Yes | Yes | Urban | Occasionally | > or=9 | 10 | 59 | 6 |
| - | Index | Feature | Feature Importance |
|---|---|---|---|
| 0 | 2 | Anxiety disorder | 0.415975 |
| 1 | 1 | Social connectedness | 0.310919 |
| 2 | 4 | Gender_Male | 0.069475 |
| 3 | 8 | Partner_yes | 0.060331 |
| 4 | 0 | Exercise | 0.056502 |
| 5 | 11 | Year_1 | 0.030694 |
| 6 | 14 | Year_4 | 0.023215 |
| 7 | 13 | Year_3 | 0.020271 |
| 8 | 6 | Raised_Urban | 0.012620 |
| 9 | 3 | Gender_Female | 0.000000 |
| 10 | 5 | Raised_Rural | 0.000000 |
| 11 | 7 | Partner_No | 0.000000 |
| 12 | 9 | Religious_No | 0.000000 |
| 13 | 10 | Religious_Yes | 0.000000 |
| 14 | 11 | Year_2 | 0.000000 |
| - | Social Connectedness |
|---|---|
| 1 | Gender_Male |
| 2 | Partner_yes |
| 3 | Exercise |
| 4 | Year_1 |
| 5 | Year_4 |
| 6 | Year_3 |
| 7 | Raised_Urban |
4.3. Descriptive Results
PHQ-9 results showed 61.9% of all respondents to have depression. Males had a higher rate of depression than females did. While mild depression was shown to be more prevalent in females (36.58), minimum depression was more prevalent in males (21.87). Among all students, mild depression was common (33.33%). In total, 7.61% of students reported severe depression, with nearly an equal number of males (7.81%) and females (7.31%). The rate of moderately severe depression was comparatively higher in males (12.5%) than females (4.87) (Table 5).
Table 6 displays the prevalence of depression based on socio-demographic characteristics, as reported by PHQ-9. Second-year college students reported having a higher depression rate than those in any other year. The lowest depression rate was reported by fourth-year students. However, female students in the third grade reported the highest rate of despair, at 87.5%. Compared to students who replied no, students with partners were shown to have higher levels of depression. Comparatively more women than men reported having depression. Students who answered “no” to being religious were found to be melancholy in 81.81% of cases. Males who declined to identify as religious had higher rates of depression than females, both among men and women, the level of depression was higher in male students who were born in rural areas. However, females were recorded as having a higher depression rate if they were born in an urban area. It was observed that students who exercised often showed lower depression rates as compared to students who exercised seldom or occasionally.
| Level of Depression | Total (N=105) Weighted% |
Male (N=64) Weighted% |
Female (N=41) Weighted% |
|---|---|---|---|
| Not depressed | 9.52 | 10.93 | 7.31 |
| Minimally depressed | 20 | 21.87 | 17.07 |
| Mildly depressed | 33.33 | 31.25 | 36.58 |
| Moderately depressed | 20 | 15.62 | 26.82 |
| Moderate severely depressed | 9.52 | 12.5 | 4.87 |
| Severely depressed | 7.61 | 7.81 | 7.31 |
| - |
Total (N=105) (%) |
Male (N=64) (%) |
Female (N=41) (%) |
|---|---|---|---|
| Year | |||
| 1st | 70.0 | 77.27 | 50.10 |
| 2nd | 76.92 | 75 | 77.77 |
| 3rd | 68.75 | 50 | 87.5 |
| 4th | 50.0 | 43.33 | 62.5 |
| Partner | |||
| Yes | 72.72 | 66.66 | 76.92 |
| No | 59.02 | 56.36 | 64.28 |
| Religious | |||
| Yes | 59.03 | 54 | 66.66 |
| No | 81.81 | 71.42 | 62.5 |
| Raised | |||
| Rural | 57.69 | 61.11 | 50 |
| Urban | 63.29 | 56.52 | 72.72 |
| Exercise | |||
| Occasionally | 72.22 | 65.62 | 81.81 |
| Often | 57.14 | 58.82 | 54.54 |
| Seldom | 82.60 | 80 | 87.5 |
| - |
Total (N=105) (%) |
Male (N=64) (%) |
Female (N=41) (%) |
|---|---|---|---|
| Year | |||
| 1st | 40.0 | 22.72 | 87.5 |
| 2nd | 46.15 | 25.0 | 55.55 |
| 3rd | 43.75 | 25.0 | 62.5 |
| 4th | 69.56 | 66.66 | 75.0 |
| Partner | |||
| Yes | 63.63 | 66.66 | 61.53 |
| No | 49.39 | 36.36 | 75 |
| Religious | |||
| Yes | 51.80 | 38.0 | 72.72 |
| No | 63.63 | 64.28 | 62.5 |
| Raised | |||
| Rural | 42.30 | 27.77 | 75.0 |
| Urban | 53.16 | 41.30 | 69.69 |
| Exercise | |||
| Occasionally | 51.85 | 43.75 | 63.63 |
| Often | 67.85 | 52.94 | 90.9 |
| Seldom | 43.47 | 33.33 | 62.5 |
| - |
Total (N=105) (%) |
Male (N=64) (%) |
Female (N=41) (%) |
|---|---|---|---|
| Year | |||
| 1st | 66.66 | 68.18 | 62.5 |
| 2nd | 84.61 | 100.0 | 77.77 |
| 3rd | 62.5 | 50.0 | 75.0 |
| 4th | 56.52 | 46.46 | 75.0 |
| Partner | |||
| Yes | 59.09 | 44.44 | 69.23 |
| No | 66.26 | 60.0 | 78.57 |
| Religious | |||
| Yes | 60.24 | 56.0 | 66.66 |
| No | 77.27 | 64.28 | 100.0 |
| Raised | |||
| Rural | 61.53 | 66.66 | 50.0 |
| Urban | 63.29 | 54.34 | 75.75 |
| Exercise | |||
| Occasionally | 62.96 | 59.37 | 68.18 |
| Often | 53.57 | 52.94 | 54.54 |
| Seldom | 73.91 | 60.0 | 100 |
| - | Logistic Regression | ||
|---|---|---|---|
| Training | Testing | Validation | |
| Before feature selection | 89.74 | 66.66 | 74.35 |
| After feature selection | 92.30 | 81.48 | 69.23 |
| After hyper-tuning c parameter | 92.30 | 90.18 | 84.35 |
Table 7 displays the prevalence of social connectedness based on socio-demographic factors, as reported by PHQ-9. Fourth-year college students reported having a higher social connectedness than those in any other year. However, female students in the first grade reported the highest rate of social connectedness, at 87.5%. Compared to students who replied yes, students with partners were shown to have higher levels of social connectedness. Comparatively more women than men reported having social connectedness. The level of social connectedness was higher in female students who were born in rural areas. It was observed that students who exercised often showed higher social connectedness rates as compared to students who exercised seldom or occasionally.
Table 8 displays the prevalence of anxiety disorder based on socio-demographic factors, as reported by PHQ-9. Second-year college students reported having a highest anxiety disorder rate than those in any other year. However, female students in the 2nd grade reported the highest rate of anxiety disorder, at 77.77%. Compared to students who replied no, students with partners were shown to have higher levels of anxiety disorder. Comparatively more women than men without partners reported higher anxiety disorder. Students who answered “no” to being religious were found to have an anxiety disorder in 77.27% of cases. Females who declined to identify as religious had higher rates of anxiety disorder than males. However, females were recorded to have a higher depression rate if they were born in an urban area. It was observed that female students who exercised seldom showed the highest anxiety disorder rates as compared to students who exercised occasionally.
4.4. Main Analysis
The dataset was split into 75% training and 25% testing sets. The dataset was also split into 50% training and 50% testing for validation. Prior to feature selection, the data were first fitted into a logistic regression model to determine accuracy. After feature selection, the data were once more fitted to test the results, and the accuracy has been found to be significantly improved. To improve accuracy and reduce log loss, the c parameter was hyper-tuned as well. (Tables 9 and 10). It was discovered that while the testing and validation accuracy improved, the training accuracy remained constant. The linear regression model provided an accuracy of 70.03% after feature selection. Table 11 displays the accuracy of the suggested model as well as the performance metrics for several models that have been used to analyze data on mental health issues in the literature. From the table, it is evident that the proposed model has provided better accuracy in comparison to other models, except for CNN. On the other hand, linear regression has not given satisfactory results for our data set.
| Measures | Average Rate |
|---|---|
| Precision | 0.95 |
| Recall | 0.86 |
| F1-score | 0.89 |
| Support | 14.5 |
| TPR | 0.86 |
| TNR | 0.86 |
| FPR | 0.13 |
| FNR | 0.13 |
| Paper | Dataset | Model | Accuracy |
|---|---|---|---|
| [13] | Dataset of depression and anxiety; dataset of 470 seafarers | (i) CatBoost (ii) Logistic regression (iii) Support vector machine (iv) Naive Bayes (v) Random forest |
Accuracy: (i) CatBoost: 89.3% (ii) Logistic regression: 87.5% (iii) Support vector machine: 87.5% (iv) Naive Bayes: 82.1% (v) Random forest: 78.6% |
| [14] | Dataset of depression and anxiety | (i) CNN (ii) Support vector machine (iii) Linear discriminant analysis (iv) K-nearest neighbour |
Highest accuracy achieved by CNN: 96.0% for anxiety and 96.8% for depression |
| [15] | Multimodal behavioural data with a sample of anxiety disorders, healthy persons, and major depression | Support vector machine | (i) 90.10% for the case classification (ii) 67.46% for the disorder classification |
| Proposed model | University student data | (i) Linear regression (ii) Logistic regression |
(i) 70.03% (ii) 90.18% |
| Pearson correlation (α =0.05) | 1 | 2 | 3 |
|---|---|---|---|
| 1. Depression | 1.00 | -0.29 | 0.56 |
| 2. Social connectedness | -0.29 | 1.00 | 0.06 |
| 3. General anxiety disorder | 0.56 | 0.06 | 1.00 |
| Socio-demographic Factors |
Chi-squared Statistic χ2 |
Critical Value | p-value | Reject/Accept Null Hypothesis |
| - | - | |||
| Gender | 1.16390493 | 3.81414588 | 0.28065716 | Accept |
| Year | 5.15932877 | 3.81414588 | 0.02312183 | Reject |
| Religious | 1.38227736 | 3.81414588 | 0.23971361 | Accept |
| Raised | 0.26002266 | 3.81414588 | 0.61010459 | Accept |
| Partner | 1.38227736 | 3.81414588 | 0.23971361 | Accept |
| Exercise | 5.47850474 | 3.81414588 | 0.01925172 | Reject |
| - |
Chi-squared Statistic χ2 |
Critical Value | p-value | Reject/Accept Null Hypothesis |
|---|---|---|---|---|
| CGPA | -4.390189709 | 3.841458821 | 0.03614629097 | Reject |
Table 11 shows that, for our dataset, the hyper-parameter tuned logistic regression model has outperformed all other models in the literature, excluding CNN.
4.5. Factors of Depression
The dataset in this study has involved both the numerical and categorical features. Social connectedness and anxiety disorder as numerical variables have been checked using Pearson correlation. The results have shown anxiety and depression to be correlated positively and social connectedness and depression to be correlated negatively. Chi-squared testing has been used for categorical variables. The findings have indicated exercise and the year of college to be linked to depression. The confusion matrix for the Pearson correlation coefficient is depicted in Table 12. Table 13 displays the results of the Chi-squared test on the category variables.
4.6. Effects of Depression
The association between academic achievement and depression was determined using the Cumulative Grade Point Average (CGPA). “There is no association between academic success and depression,” was taken as the null hypothesis. “There is a relationship between academic success and depression,” was taken as the alternative hypothesis. Through the Chi-squared test, the p-value was observed to be less than the significance level (α), rejecting the null hypothesis and indicating a relation between depression and academic performance (Table 13). The Chi-squared statistic χ2 was also found to be greater than the critical value, again rejecting the null hypothesis (Table 14).
CONCLUSION
The main focus of this study has been to find the prevalence, factors, and effects of depression on college students in Odisha. In a dataset of 105 students, the prevalence rate of depression has been estimated and found to be 61.90%. We have discovered 20% of students to have mild depression, whereas 7.66% of students have experienced severe depression, highlighting the urgent need for preventive measures. With a 92% accuracy rate, the logistic regression model has outperformed the linear regression model in its ability to predict depression. According to the findings, depression is prevalent among college students in Odisha. Additionally, it is concluded that logistic regression is the better model for this dataset.
Among the chosen categorical factors (gender, year, raised in a rural or urban area, being religious, and exercise), physical health and year of college have been found to be directly related to depression through the Chi-square test. A Pearson correlation test has revealed anxiety disorder to be related positively to depression, whereas social connectedness has been related negatively. Thus, it may be deduced that someone who feels anxious or who is less connected to their social environment is more likely to experience depression. Additionally, it has been found that maintaining good physical health is crucial for students and can result in positive changes.
Depression can affect an individual’s daily, personal, social, and professional life. Depression can cause a loss of concentration and can lead to poor academic performance. The dataset included a student's most recent CGPA, which was used to determine whether academic performance and depression were correlated. We discovered academic performance and depression as associated using a Chi-square test. Therefore, we conclude that if policies are adjusted and problems are handled, academics can be improved, which will then lead to a sustainable education system.
LIMITATIONS AND FUTURE SCOPE
The current study has a very broad scope. There are a few restrictions in this work, but they can be expanded in subsequent projects. By including additional variables, like eating and sleeping routines, as well as additional scales, like suicidal behaviour, the dataset can be made better. The findings could be redirected to focus on the significance of social connectivity in explaining mental health. For instance, the results could indicate that social connectivity, regardless of anxiety level, is a protective factor in depression. In this study, a score of 0 to 5 was assumed to indicate no depression. By adding more colleges and expanding the study to more states, the dataset can be expanded. The dataset now is unbalanced, with some attributes having insufficient data for all categories. This imbalance can be corrected by increasing the number of participants. The dataset for academic success can include a lot of other factors, such as the pressure of the exams and their level of study focus.
LIST OF ABBREVIATIONS
| GAD-7 | = General Anxiety Disorder Questionnaire |
| PHQ-9 | = Patient Health Questionnaire |
| SCS | = Social Connectedness Scale |
ETHICS APPROVAL AND CONSENT TO PARTICIPATE
The study was approved by the institutional ethics committee, i.e., Department of Computer Science and Engineering, Siksha ‘O’ Anusandhan Deemed to be University, Bhubaneswar, Odisha, India.
HUMAN AND ANIMAL RIGHTS
No animals were used in this research. All procedures performed in studies involving human participants were in accordance with the ethical standards of institutional and/or research committee, and with the 1975 Declaration of Helsinki, as revised in 2013.
CONSENT FOR PUBLICATION
Prior to filling out the form, participants were asked for their consent.
STANDARDS OF REPORTING
COREQ guidelines were followed.
AVAILABILITY OF DATA AND MATERIALS
The data supporting the findings of the article is available at [https://forms.gle/usLPUkLFt5ZHbbu3A].
FUNDING
None.
CONFLICT OF INTEREST
Dr. Satchidananda Dehuri is on the editorial advisory board of the journal The Open Bioinformatics Journal.
ACKNOWLEDGEMENTS
Declared none.

