
A Novel Application of K-means Cluster Prediction Model for Diabetes Early Identification using Dimensionality Reduction Techniques
Authors Info & Affiliations
Abstract
Purpose:
Diabetes is a condition where the body cannot utilize insulin properly. Maintenance of the levels of insulin in the body is mandatory, otherwise it will lead to several disorders of kidney failure, heart attack, nervous weakness, blindness, etc. Among the 10 majority diseases, diabetes is occupying the second role by covering 34.2 million individuals as for the National Diabetes Statistics report. According to the World Health Organization, diabetes is playing the 7th role in cause of death. Thus early identification of diabetes can overcome these severe damages.
Methods:
Accurate predictions require a lot of data, which is introducing the curse of dimensionality. In the present research, PIMA Indians diabetes data set is considered and different classification models viz., K-means clustering with logistic regression, SVM (Support Vector Machine), Random Forest, etc. are implemented in predicting the accuracy of diabetes.
Results:
The accuracies for diabetes prediction are ranging from 0.9875 to 1.0. KCPM (K-means cluster prediction model) and has shown an increase in accuracy of 0.67% for the combined K -means clustering and different classification algorithms. In KCPM, firstly, the data is clustered using k-means into patients with and without diabetes, and then the clustered results are compared with the target variable and then filtered, followed by applying the different supervised classification algorithms for predicting the disease.
Conclusion:
The results show that KCPM predicts diabetes with a higher accuracy of 0.67% compared with other existing methods. By KCPM-based automated diabetes analysis system, early prediction of the disease may protect patients from facing severe disorders in life.
1. INTRODUCTION
Diabetes is a disease where the blood glucose becomes high due to the food intake. Insulin, a hormone synthesized by the pancreas, which helps to absorb glucose into the cells for generating energy. Excess glucose in the blood leads to health problems. Moreover, diabetes cannot be cured permanently, but early identification can manage the problem of diabetes [1]. Several types of diabetes like Type 1, Type 2, and gestational diabetes are common. Type 1 diabetes occurs when the body does not secrete insulin, which leads to the destruction of cells in the pancreas and patients should take insulin every day to stay alive. Type 2 diabetes where the body does not properly use insulin, and is the most common type that occurs among other types. Gestational diabetes where a greater chance of occurring in pregnant women and may persist throughout life, or it may go away after delivery. Type 2 diabetes, which is more common can be avoided by a regular healthy diet, being physically active and supporting healthy body weight, and avoiding tobacco usage [9]. About 422 million people worldwide are having diabetes and 1.6 deaths are directly attributed to diabetes each year. The impact of diabetes among other diseases is steadily increasing over time. With the help of machine learning technology, the prediction of the existence of diabetes can be known initially and by appropriate treatment, the risk can be reduced [2, 3]. There are many complications connected with high blood sugar levels which can harm parts of the human body, comprising of the eyes and feet. These are called diabetic complications. With some minor care and proper action, we can prevent or delay these diabetes side effects [4, 5].
There are two types of complications that were associated with diabetes 1) Chronic complications which develop over time and 2) Acute complications which can occur at any point in time.
Chronic Complications: These types of complications are considered long-term problems and they develop gradually. If these complications are not attended, then they can lead to severe damage. Some complication that comes under chronic is diabetic retinopathy, which is a commonly found disorder in diabetic patients. It can harm their vision and can be easily found by routine eye screening tests. In some patients with diabetes, any injury to the foot is considered as serious and sometimes may lead to amputation if untreated. Due to increased blood sugar levels, blood circulation becomes slower and this will increase the healing time during cuts and sores. Most of the problems are like loss of feeling in the feet due to nerve damage. It can be prevented or delayed by continuous monitoring of the patient’s look or feel sensation in the feet. Severe damage to a patient's blood vessels sometimes leads to heart attacks and strokes, which is also a primary concern in patients with high blood sugar levels. A condition called diabetic nephropathy or kidney disease will be developed in patients with high blood pressure and high blood sugar. Diabetic nephropathy can lead to kidney damage over a prolonged period and make it difficult to filter additional fluids and waste from diabetic patients. Some diabetic individuals get neuropathy, which is nerve damage. This issue makes it challenging for nerves to send signals from the brain to other regions of the body, which causes issues with vision, hearing, feeling, and movement [6, 7].
Millions of individuals throughout the world suffer from the chronic condition of diabetes. For consequences like cardiovascular disease, blindness, kidney failure, and amputations to be avoided, diabetes must be found and managed early. By analysing vast amounts of data and finding patterns that are invisible to humans, machine learning techniques can help forecast the likelihood of getting diabetes [5, 8]. This can support both individualized treatment regimens and the early diagnosis and prevention of diabetes. Healthcare providers can accurately forecast a patient's risk of getting diabetes by using machine learning models to examine many aspects like lifestyle choices, family history, medical history, and demographic information. These forecasts can aid medical professionals in creating individualized preventative and treatment plans, which may eventually lead to better patient outcomes and minimize costs for healthcare. Now it is simpler to practice machine learning techniques to predict diabetes due to the growth of electronic health records and the accessibility of vast datasets. Machine learning models can better predict diabetes by uncovering hidden patterns and risk factors through the analysis of vast volumes of data. Overall, the improvement and motivation in early identification and management of the condition will result in improved patient outcomes and lower healthcare costs, calling for the implementation of machine learning approaches for diabetes prediction.
Data can be clustered using the well-accepted unsupervised machine learning algorithm like K-means clustering [9, 10]. Although its primary application is in unsupervised learning, it can also be changed for supervised learning tasks like categorization. The first stage would be to collect a dataset that has information on people who have and have not been diagnosed with diabetes to create a k-means clustering prediction model for diabetes classification [11, 12]. Age, BMI, blood pressure, and blood sugar levels should all be included in the dataset. After that, the features should be scaled to make sure they have a similar range, and the data should be preprocessed to remove any missing values or outliers. Subsequently, the dataset can be run through the k-means clustering method to categorize the individuals according to their features [13, 14]. The elbow method or another proper method for figuring out the ideal number of clusters should be used to guide the choice of cluster size. A supervised learning algorithm, such as logistic regression, decision tree, or random forest, can be trained on the clustered data once the people have been grouped to categorize new individuals as either having diabetes or not. Many metrics, including accuracy, precision, recall, and F1 score, can be used to assess the model's performance. To find which classification model performs best on the provided dataset, the model can also be contrasted with other models [15].
The diabetes data set for Pima Indians [14] is considered in the current study, and various classification models, including K-means clustering with logistic regression [16], SVM (Support Vector Machine), Random Forest techniques are used to predict the accuracy of diabetes [17, 18]. In most machine learning-based algorithms, the accuracy ranges from 0.9875 to 1.0. In this article, we used the combined use of K-means clustering and several classification methods, and the proposed technique is called as KCPM (K-means cluster prediction model). In KCPM, the data is first grouped using k-means into individuals with and without diabetes. The clustered results are then compared with the target variable, filtered, and then various supervised classification methods are applied to forecast the disease. The rest of the paper discusses about the background knowledge in Section 2, data mining methods in Section 3, and literature work in Section 4, and it follows the techniques like requirement analysis and predictive analysis.
2. METHODS
Gowda and Jayaram [4] proposed a cascaded model for Pima Indian Diabetes Dataset, where the missing values are imputed by using the K-nearest neighbour (KNN) classification model and removing one attribute missing values and applying the k means clustering and removed the data points from the dataset which not coming under any cluster and finally applied the classification logistic regression for predicting diabetes. Iyer [5] has proposed a feature selection technique for reducing the dimensions of the PIMA dataset and applied the naïve Bayes classifier for accurate prediction of diabetes.
Tarun [6] produced feature selection based on the concept of correlation and variance and finally applied the PCA (Principal Component Analysis) and REP for selecting the features and compared the accuracy with REP and SVM. Anjali [12] used the feature extraction technique PCA and after reducing the dimensions, neural network classifier is applied to attain accuracy of 92.2%. Han [11] applied k-means to remove the outliers which do not come under any cluster by having a comparison between the clustered results to the target variable and finally checked whether 75% of the dataset is present after removal or also if present and then applied logistic regression on the dataset for attaining 95.42% of accuracy for the prediction of diabetes.
Santhanam and Padmavathi [10] proposed the reduced features and then applied the genetic algorithms for knowing the impact of primary features which will persist for generations and features which follow for a particular number of generations given which features play a vital role and then the SVM model is applied for prediction. and then applies the KNN classifier for attaining accuracy for prediction. Patil [8] has introduced the hybrid prediction model for type 2 diabetes for prediction and showed an accuracy of 92.38% using the K-means and the C4.5 algorithm. Changsheng Zhu [16] has produced an improved logistic regression model for diabetes by integrating the PCA and K-means and introducing the new principal components and then applying a K-means algorithm with an accuracy of 97.40%.
Shah [17] proposed a deep learning model for differentiating people with and without diabetes by segregating diagnostic and prognostic information with the help of cross-sectional analysis of nail fold capillaroscopic images. Lehmann [18] developed a machine learning approach for detecting hypoglycaemia, especially while driving based on driving and gaze behaviour data. Abraham [19] proposed a predictive model for Diabetes Mellitus prediction in the early stage by using machine learning techniques like KNN, Decision trees, and ANN (Artificial Neural Networks). Karimian et al. proposed a decision tree-based prediction model for identifying type 2 diabetes mellitus using anthropometric measurements.
In [20, 21] Hussein, etal. proposed unsupervised model for automatic feature extraction and prediction of diabetics using a deep neural network using autoencoder and regularization technique. Hatim Butt et al. [22] developed a multilayered long short-term memory (LSTM)-based recurrent neural network established to estimate blood glucose levels in patients with type 1 diabetes. In [23], Luo et al. discussed a deep learning model for identifying correlations between diabetics' data sets using the diabetic retinopathy detection technique.
The proposed KCPM model has the highest accuracy when compared with the other’s work. M. S. Barale has introduced the cascaded modelling for PIMA Indian diabetes data implementing the k-means and the logistic regression model with an accuracy of 99.33%, which overcomes other cascaded models introduced by Karegowda and Jayaram. Huaping Zhou [15] introduced a prediction model based on an improved deep neural network with an accuracy of 99.4112%, which was overcome by our proposed model.
Machine learning techniques like Support Vector Machine (SVM) and Random Forest (RF) were employed in [24] to assess the likelihood of developing diabetes-related diseases. In this article, after data preprocessing, step forward and backward feature selection is used to choose the features that have an impact on the prediction. With the use of smartphones, smart wearables, and personal health devices, in [25], authors presented an end-to-end remote monitoring framework for automated diabetes risk prediction and management. A support vector machine-based algorithm was created for predicting the risk of developing diabetes.
In [26], the authors used a prediction model for diabetes risk assessment. In their work, the authors have demonstrated that data mining and machine learning algorithms can decrease risk factors and progress the outcome in terms of effectiveness and correctness by putting several classifiers into practice on the PIMA dataset. To predict the type of diabetes, a DNN (Deep Neural Network) model (DTP model) was proposed in [15]. Two datasets, each with more than a thousand records, were used to pretrain the deep neural network. As there were few epochs in the training phase, the authors claim that this approach will operate quickly even on mobile platforms. In [27], the authors proposed Deep Learning modified Neural Networks (DLMNN) and Naive Bayes (NB) classifier to predict and categorize the risk level in diabetic patients. Using patient information from the Pima Indian Diabetes Database, the performance of the system. In [28], authors investigated the differences between multivariable regression models and machine learning-based prediction models in terms of accuracy, calibration, and interpretability. Their findings demonstrated that updating prediction models in the electronic healthcare record (EHR) system improves the prediction accuracy as well as the firmness of the variable importance ranking, although not consistently among machine learning prediction models. In [29], dimensionality reduction techniques are effectively used in the prediction of cardiovascular diseases. In [30], for diabetes prediction, the authors presented a fused machine learning technique. In this method, Support vector Machine (SVM) and Artificial Neural Network (ANN) models are used. The output of this model is fed to the fuzzy model as an input membership function to predict diabetes. In [31], the authors proposed a diabetes prediction model using ensemble Machine learning classifiers like Decision Trees, Random Forest, AdaBoost, Naïve Bayes, K-nearest Neighbour, and XGboost with a Multilayer Perceptron. From the area under the ROC curve of machine learning models, the weights are estimated.
AdaBoost classifier, extra tree classifier, decision tree classifier, and gradient boosting classifier machine learning models are applied for detecting chronic diabetes disease [32]. In this article, the authors have used a technique called up-sampling to split the data during preprocessing. In [33], the author developed a machine learning based framework to predict type 2 diabetes with the help of lifestyle indicators. In this article, the authors claimed that the gradient boosting classifier gave the highest accuracy of 97.24%. In [34], the author has provided a review of various machine learning algorithms for classification to detect diabetes. Various classification algorithms like Naïve Bayes, SVM, Logistic regression, decision tree, Random Forest, and generic algorithms systematic review are discussed.
In [15], an early-stage diabetics risk prediction model was proposed using a deep neural network with pretraining of two data sets with thousands of records. In [35], an ensemble soft voting classifier with three machine learning algorithms such as random forest, logistic regression, and Naive Bayes was applied to the breast cancer and pima data set. In [36] used machine learning and visualization techniques for identifying the ranking of classifiers and features on the PIDD T2D data set. In [26], we used deep learning techniques in the proposed system with an automatic prognosis tool feature. In [37], an early identification of the diabetic model using an unsupervised approach using deep learning techniques was proposed. In [38] proposed a classification model for the diabetes data set using machine learning algorithms and IoMT environment. In [39] a machine learning-based model for early diagnosis of liver disease prediction was proposed.
3. RESEARCH BACKGROUND
3.1. Machine Learning Techniques
Machine learning is about extracting knowledge from the available data by machines which are used in making better decisions and predictions. The field of machine learning is classified into 3 types:
- Supervised learning: Where the input and output will be provided, and the goal is to learn the mapping of input to output.
- Unsupervised learning: Data will be given without labels and need to find the hidden structures in the input.
- Reinforcement learning: learning in a dynamic environment and learning from feedback.
To make accurate predictions, a lot of data is required leading to an increase in the dimensions of features where the machine is facing problems with prediction. So, we need to reduce the dimension to enable machines to correctly predict. Dimensionality reduction is the process of reducing the available dimension either by obtaining the set of selected features by feature selection or by extracting new features from the existing ones by feature extraction. Clustering performs dimensionality reduction by dividing the data points into clusters where similar objects are grouped to form a cluster. t-Distributed Stochastic Neighbour Embedding(t-SNE) is used in the visualization of high-dimensional space, which works by preserving the pairwise distances or local similarities within the data and shows the clear separation of the data. The results of t-SNE reduce the dimensions of the dataset, which helps to investigate and evaluate the number of segments by showing the clear separation in the data which will be used in finding the value for the number of clusters. While the different VAT tools are used only for visualization, t-SNE will be used for both visualization and feature extraction. Feature selection and dimensionality reduction algorithms are used for pre-clustering and visual assessment of the structure of the data, which can be used in clustering and classification algorithms. The nonlinear dimensionality reduction technique t-SNE shows the cluster separation visually clear when compared with the different VAT tools which are used for accessing the clusters. Jupyter Notebook is an open-source web application launched by Anaconda software, used for data cleaning and transformation, data visualization, statistical modelling, and machine learning.
3.2. K-Means Clustering
One of the unsupervised techniques of machine learning, where the output is predicted without labels, aims to partition the available data into k number of clusters in which each data point is like each other within the cluster and dissimilar with other clusters based on the similarity measure such as Euclidean-based distance or correlation-based distance. K-means is a distance-based algorithm where the data points are assigned to the closest cluster centroid and every time recomputing of centroids with the newly formed clusters until all data points are assigned to some cluster. K-Means is used to investigate the structure of the data by grouping them into distinct subgroups [3].
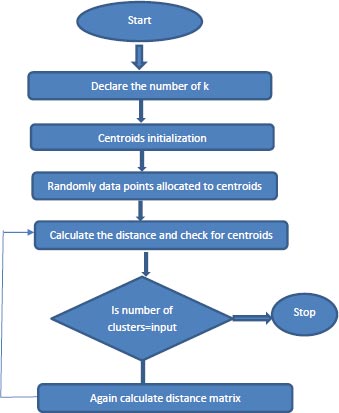
The way the K-Means [13] algorithm works:
1. Specify the number of clusters, K.
2. Centroids are initialized, and data points are randomly selected for the centroids.
3. Keep iterating step 2 until there are no changes to the centroids.
4. Compute the sum of the squared distance between the data points and assign it to the closest cluster.
5. Compute the final centroids by taking the average of all data points that belong to each cluster. Represented using flowchart as mentioned in the Fig. (1).
3.3. Supervised Classifiers
1. K-Nearest Neighbours: Simplest machine learning algorithm which consists of storing a dataset and predicting the closest data point in the training set as its neighbours [4].
2. Linear models for classification: The model works by classifying the samples based on the decision boundary and tuning of parameters and regularization for attaining the best accuracy [16, 18].
3. Naive Bayes classification algorithms: These models learn parameters by treating each feature individually and collecting simple statistics for each feature [34].
4. Ensemble of Decision tree classifiers: the combination of multiple machine learning models to create more powerful models [24, 31, 32].
4. PROPOSED MODEL
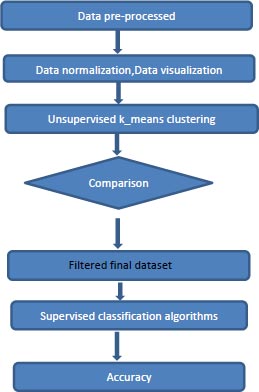
The flow of the proposed model is shown in the Figs. (2 and 3). The components of the proposed system are discussed in this section in detail.
4.1. Data Set Description
In this article, PIMA Indian Diabetes dataset [14] is used and it is fetched from the repository of UCI. This dataset has female patients data of 768 records with one class variable and nine attributes are used as features as shown in Table 1. The purpose of the dataset is to analyze the existence/non-existence of diabetes in female patients. The target variable of the dataset is determined based on the existing independent features of the individual patient to determine whether a patient is suffering from diabetes.
4.2. Pre-processing Steps
Today’s real-world datasets are having a data representation of different formats and missing values and repeated values or values that are not correct. Before applying machine learning algorithms, the dataset must be preprocessed by removing all these unwanted values and making quality data so that the predictions are accurate. In pre-processing of this dataset, the feature of Preg which indicates the number of times pregnant has been modified as if pregnant at least once as 1 and not at all pregnant once as 0 by the analysis studies of Hans [11] and after and all other features also has multiple missing values. Each row is the record of the patient’s information based on which the author decided of having diabetes. Secondly, the scaling of the data is done in order to maintain a scale, otherwise the priority of the features gets disturbed. Table 1 indicates the values of the dataset after the preprocessing and scaling.
4.3. Proposed Model: KCPM
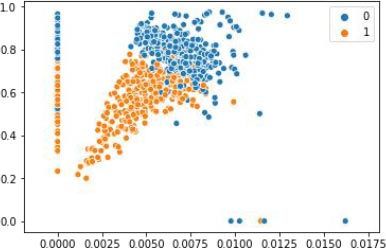
KCPM is made up of 3 stages where the preprocessing of converting the feature Preg into 1’s and 0’s and scaling is done for the dataset at the first stage and in the second stage the dataset is clustered by giving the K value as 2 based on the results of the t-SNE and at the last stage removing of the data points which won’t lie in either of the clusters and comparing the clustered results with the target variable and in the final filtered data different supervised classification algorithms are applied and results are predicted as shown in Fig. (2). X-axis represent the various features mentioned in the Table 1 and y-axis represent the output variable, outcome 1 for having diabetes and 0 for not having diabetes.
Before applying K-means, the t-SNE results shown the number of clusters.
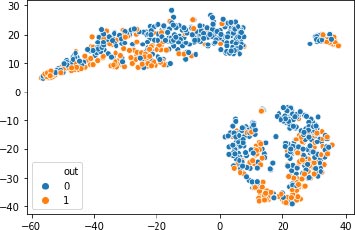
4.3.1. Applying the K-means Clustering
After the dataset feature pregnant is converted to 1’s and 0’s, then the dataset is normalized by scaling method, and then the unsupervised K-means algorithm is applied to the processed data and the results are visualized, as shown in Fig. (4). X-axis represent the various features mentioned in the Table 1 and y-axis represent the output variable, outcome 1 for having diabetes and 0 for not having diabetes. The result of the clustering approach is reported in the Table 2.
| Statistics | Preg | Gluc | Bp | Skin | Insul | BMI | Pedi | Age |
|---|---|---|---|---|---|---|---|---|
| Mean | 0.8554 | 120.8945 | 69.1054 | 20.5364 | 79.7994 | 31.9925 | 0.4718 | 33.2408 |
| STD | 0.3518 | 31.9726 | 19.3555 | 15.9522 | 115.2440 | 7.8841 | 0.3313 | 11.7602 |
| MIN | 0.0000 | 0.0000 | 0.0000 | 0.0000 | 0.0000 | 0.0000 | 0.0780 | 21.0000 |
| 25% | 1.0000 | 99.0000 | 62.0000 | 0.0000 | 0.0000 | 27.3000 | 0.2437 | 24.0000 |
| 50% | 1.0000 | 117.0000 | 72.0000 | 23.0000 | 30.5000 | 32.0000 | 0.3725 | 29.0000 |
| 75% | 1.0000 | 140.2500 | 80.0000 | 32.0000 | 127.2500 | 36.6000 | 0.6262 | 41.0000 |
| MAX | 1.0000 | 199.0000 | 122.0000 | 99.0000 | 846.0000 | 67.1000 | 2.4200 | 81.0000 |
4.3.2. Applying the Supervised Classification Algorithms
PIMA Indians diabetes data set is considered and different classification models and various classification models, including K-means clustering with logistic regression, SVM (Support Vector Machine), and Random Forest techniques are used to predict the accuracy of diabetes. In most machine learning-based algorithms, the accuracy ranges from 0.9875 to 1.0. We used the combined use of k-means clustering and several classification methods, and the proposed technique is called as KCPM . After clustering and comparing with the target variable, now the supervised classifier is applied in the ratio of 80% and 20% for the training and test data and finally, the accuracy is noted for the prediction of diabetes as shown in the Table 3.
4.3.3. Performance Evaluation
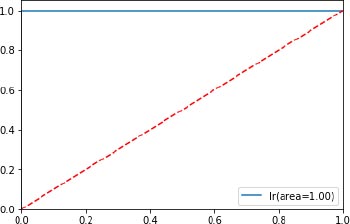
The classifier’s accuracy of the proposed KPCM model is evaluated through a confusion matrix with the help of the four results (True Positive, True Negative, False Positive, True Positive), and the RoC curve as shown in Fig. (5) is depicted which is an evaluation metric for the classifiers used. The higher number of false positives than true negatives is indicated in the x-axis and the higher number of true positives than false negatives is indicated in y-axis.
1. Count of female diabetic patients accurately classified data samples are denoted as True Positive (tp).
2. Count of female non-diabetic patients accurately classified data samples are denoted as True Negative (tn).
3. Count of female diabetic patients inaccurately classified data samples are denoted as False Positive (fp).
4. Count of female non-diabetic patients inaccurately classified data samples are denoted as False Positive (fn).
| - | Groups | Count |
|---|---|---|
| 1 | 0 | 414 |
| 2 | 1 | 354 |
| Algorithms | Confusion Matrix | Accuracy | Recall | Precision | F1-score |
|---|---|---|---|---|---|
| KNN | [52, 1] [0 27] |
0.9875 | 0.99 | 0.99 | 0.99 |
| Logistic Regression | [53 0] [0 27] |
1.0 | 1.0 | 1.0 | 1.0 |
| SVM | [53 0] [0 27] |
1.0 | 1.0 | 1.0 | 1.0 |
| Random Forest | [53 0] [0 27] |
1.0 | 1.0 | 1.0 | 1.0 |
| GaussianNB | [48, 5] [0 27] |
0.9375 | 0.94 | 0.95 | 0.94 |
| Gradient Boosting algorithm |
[53 0] [1, 26] |
0.9875 | 0.99 | 0.99 | 0.99 |
| Decision Tree Classifier | [53 0] [1, 26] |
0.9875 | 0.99 | 0.99 | 0.99 |
| Algorithm | Accuracy | Reference |
|---|---|---|
| KCPM | 1.0 | Our model |
| Diabetes model using deep neural network | 99.4112% | Huaping Zhou |
| Cascaded model | 99.33% | M.S Barale and Shirke |
| Cascaded model K-Means+KNN | 98.00% | Gowda Kare |
| Improved logistic regression | 97.40% | Changsheng Zhu |
| PCA + SVM | 93.66% | Tarun |
| K_means + LR | 95.42% | Wu Hans |
| PCA + NN | 92.2% | Anjali |
| Feature selection + Naïve Bayes | 79.56% | Iyer |
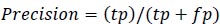
Accuracy is the measure of the classification model which is the total ratio of correctly predicted observations to the total number of observations which is calculated as per Equation 1.
 |
(1) |
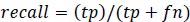
Precision is the measure of the accuracy of positive prediction as calculated in equation 2 and recall measures the completeness of positive prediction which is calculated as per equation 3. F1score is calculated as per equation 4, which is the weighted average of precision and recall.
 |
(2) |
 |
(3) |
 |
(4) |
5. RESULTS AND DISCUSSION
The model posed in this article is an unsupervised method for the early prediction of diabetes by using dimensionality reduction and the K-means clustering algorithm. Feature selection and dimensionality reduction algorithms are used for pre-clustering visual assessment of the structure of the dataset. Then clustered results are then compared with the target variable, filtered, and then various supervised classification methods are applied to forecast the disease. Using the proposed model, high accuracy is achieved when compared to the existing models shown in the Table 4. Limitations of the proposed method being it is not verified with the real-time hospital database.
CONCLUSION
In this research work, a novel KCPM model for the early detection of diabetes is proposed. KCPM is made up of 3 stages. In the first stage, preprocessing and scaling are done for the dataset. In the second stage, the dataset is clustered by giving the K value as 2, and in the last stage removal of the data points which are not present in either of the clusters. Clustered data is compared with the final filtered data with different classification algorithms and results are presented. In this work, we have also highlighted various techniques to identify the presence of diabetes early in life and can take precautionary measures to avoid several complications associated with diabetes. This algorithm can be easily applied to large-scale datasets also. Meanwhile, the limitations of the proposed method can be handled as a future scope of the work. When compared to other current algorithms, the KCPM model used the diabetes dataset of Pima Indians to predict the presence or absence of diabetes in the patients with 100% accuracy. Among all supervised learning algorithms, KCPM made correct predictions for several algorithms like KNN, SVM, etc. By applying these predictions, one can detect diabetes early in life and take Preventative actions to avert several bodily malfunctions.
LIST OF ABBREVIATIONS
| SVM | = Support Vector Machine |
| KCPM | = K-means Cluster Prediction Model |
| KNN | = K-nearest Neighbour |
| PCA | = Principal Component Analysis |
| ANN | = Artificial Neural Networks |
AVAILABILITY OF DATA AND MATERIALS
The data and supportive information are available within the article.
CONFLICT OF INTEREST
Vinayakumar Ravi is the Associate Editorial Board Member of the journal The Open Bioinformatics Journal.
ACKNOWLEDGEMENTS
Declared none.

