
A Comparative Study on Thyroid Nodule Classification using Transfer Learning Methods
Authors Info & Affiliations
Abstract
Introduction
The thyroid is an endocrine gland located in the front of the neck whose main purpose is to produce thyroid hormones necessary for the functioning of the entire body. Thyroid hormones may be produced too little or too much depending on dysfunction. Since the 1990s, there have been an increasing number of thyroid illness cases, and in recent years, thyroid cancer has become the malignancy with the fastest rate of increase. According to recent studies, thyroid dysfunction affects 42 million people in India. Much research has provided solutions for thyroid classification.
Methods
In this paper, we survey various transfer learning models to classify thyroid nodules and predict the best accuracy. Our study evaluated several models, including DenseNet169, ResNet101, and various EfficientNet variants, using a comprehensive dataset comprising 7,893 images. DenseNet169 achieved the highest accuracy at 95.96%, followed by ResNet101 and EfficientNetB1, with accuracies of 94.74% and 86.14%, respectively. The models were rigorously tuned and optimized using grid search strategies, with hyperparameters such as learning rate, batch size, optimizer type, and dropout rate carefully selected to enhance performance. The evaluation included precision, recall, and F1 score metrics, ensuring balanced performance across different metrics.
Results
Our results demonstrate that advanced transfer learning models can distinguish malignancy from benign conditions with greater accuracy than traditional diagnostic approaches reliant on the human eye.
Conclusion
This research highlights the potential of integrating AI techniques in medical diagnostics to improve the accuracy and reliability of thyroid disease detection, ultimately leading to better patient outcomes.”
1. INTRODUCTION
1.1. Ultrasound Image
Ultrasound characterization of thyroid nodules pri- marily focuses on imaging features such as size, shape, echogenicity, and the presence of calcifications to determine the likelihood of malignancy. On the other hand, the study of gland function and conditions like hypothyroidism or hyperparathyroidism involves assessing hormone levels, glandular function, and associated symptoms to diagnose and manage endocrine disorders. Separating these areas of study allows for a more focused and in-depth analysis of each aspect of thyroid disease, potentially leading to more nuanced and accurate diagnostic and management strategies. Additionally, it enables researchers and clinicians to tailor interventions and treatments specifically to the needs of patients based on their presenting symptoms and diagnostic findings.
1.2. Thyroid and CAD(Computer Aided Diagnostics) System
Thyroid nodules, which afflict 20% to 69% of the general population, are among the most common nodular lesions. Thyroid cancer, one of the most prevalent types of cancer, is known to have increased by about 240% over the previous 30 years [1]. Ultrasonography is a popular and widely used examination used to diagnose the thyroid gland and forms the basis of fine needle aspiration biopsy (FNAB) and subsequent treatment. Several recommen- dations have recently been made to assist radiologists in evaluating thyroid nodules based on ultrasound. However, since ultrasound causes echogenic problems and adverse effects, ultrasound detection of thyroid nodules still depends only on the extensive training and expertise of specialists [2].
Using the proposed multi-channel paradigm, the possibility of different kernel sizes is explored and compared to single-channel CNNs. Using CT modalities in the field of thyroid disease detection, Xinyu Zhang (2022) assessed the effect of nucleus size selection on CNN performance. This study also suggests the most reliable combination of kernel sizes for CNN mode [3].
Thyroid nodules, abnormal growths in the thyroid gland, are a common occurrence in medical imaging studies, necessitating accurate identification for timely intervention [4]. Traditional methods of diagnosis involve manual interpretation of imaging data, a process susceptible to subjectivity and variability. With the rapid advancements in artificial intelligence, particularly deep learning and machine learning, there is a growing interest in leveraging these technologies to enhance the accuracy and efficiency of thyroid nodule detection [5].
Deep learning, a subset of machine learning, has demonstrated exceptional capabilities in image analysis tasks. Convolutional Neural Networks (CNNs), a pro- minent deep learning architecture, have proven successful in various medical imaging applications [6]. In the context of thyroid nodule detection, CNNs can be employed to automatically learn and extract relevant features from medical images, aiding in the differentiation of nodules [7]. The ability of deep learning models to discern complex patterns and hierarchical representations makes them well-suited for this intricate diagnostic task [8].
Few studies show that optimization techniques are crucial for refining and improving the performance of thyroid nodule detection models [9]. Hyperparameter tuning, regularization methods, and gradient descent optimization algorithms are employed to fine-tune the model parameters, ensuring optimal generalization to new data. Additionally, transfer learning, a technique where pre-trained models on large datasets are adapted to the specific task of nodule detection, enhance the efficiency of model training, particularly in scenarios with limited labeled medical data [10].
Wenkai Yang employed semi-supervised classification algorithms to generate data, addressing the reliance of deep learning models on lesion labeling and overcoming constraints posed by small datasets in medical imaging [11]. This approach facilitated improved nodule splitting and categorization. Yang also introduced a Multitask Cascade Deep Learning Model (MCDLM) that leverages multimodal ultrasound data for the automatic classi- fication of thyroid tumors. Notably, the model considers the diverse perspectives of radiologists. The Dual Knowledge (DK) framework incorporates insights from radiologists' comments and ultrasonic properties of nodules (UF), encompassing B-mode characteristics defined by TI-RADS and hardness information from elastography images. The initial nodule segmentation was performed using a U-net constructed with a pre-trained VGG13 model. Ruiguo Yu employed ultrasonic imaging is a topic of many research studies involving thyroid nodules. Thyroid nodules, which can be benign or malignant, are a prevalent ailment in coastal areas [12].
Each of them offers different therapy options and affects patients to various degrees. Although ultrasonography can be used to identify nodule features, its fuzziness and a variety of angles, as seen in, place extra demands on medical practitioners and suggest a method for CAD ultrasound pictures that is unsupervised. Lee proposed that a deep convolutional neural network (CNN) has significantly improved the efficiency and diagnostic accuracy of interpreting medical images in recent years [13]. Many studies describe a computer-aided diagnostic (CAD) model that uses computed tomography (CT) and ultrasound images to diagnose both normal and pathological thyroid conditions.
To semantically distinguish thyroid nodules in nodules, cystic components, and normal thyroid in B-mode images, Viksit Kumar came up with a breakthrough multiplex CNN [14]. The program allows the user to recognize and segment the anatomy of the thyroid in real time. The method is used to create thyroid maps, identify thyroid nodules, segment them, and estimate their volume and size. The effectiveness of the proposed method is evaluated against manual segmentation masks and traditional seeding methods.
Yinghui Lu showed that convolutional neural networks diagnose thyroid nodules more accurately than traditional artificial neural networks. However, there is still a need for enhancement in thyroid nodule placement or diagnosis accuracy [15, 16]. There is a lack of a target detection technique for deep learning networks that can locate and identify nodules in real-time. Hence, numerous studies endeavor to create a highly effective object detection model capable of discerning between benign and malignant thyroid nodules. Here are the main highlights of the proposed work:
- Comprehensive Evaluation of Transfer Learning Models: The study evaluates a range of transfer learning models, including DenseNet169, ResNet101, and various EfficientNet variants, for classifying thyroid nodules. DenseNet169 achieved the highest accuracy of 95.96%, demonstrating the effectiveness of advanced deep-learning techniques in medical image classification.
- Hyperparameter Tuning and Optimization: An exhaustive grid search strategy was employed for hyperparameter tuning, optimizing parameters such as learning rate, batch size, optimizer type, and dropout rate. This rigorous approach ensured the models were finely tuned to achieve the best performance.
- Balanced Performance Metrics: In addition to accuracy, the study monitored precision, recall, and F1 score to ensure balanced performance across different metrics. This comprehensive evaluation provided a robust assessment of each model's capabilities in distinguishing between malignant and benign thyroid nodules.
- Utilization of a Diverse Dataset: The research utilized a dataset comprising 7,893 images from four different sources (PERSIAN, DDTI, ACR TIRADS, and AUITD), ensuring a diverse and representative sample of thyroid images. This diversity enhances the generalizability and robustness of the findings.
- Implications for Improved Diagnostic Accuracy: The study highlights the potential for integrating advanced AI techniques in medical diagnostics. By outperforming traditional diagnostic approaches reliant on the human eye, these models offer a more accurate, consistent, and unbiased method for detecting thyroid diseases, potentially leading to better patient outcomes.
2. RELATED WORKS
Xingtao Lin [17] advocates the use of a super-resolution directed network to enhance automated thyroid nodule categorization. The proposed system employs an N-shaped network for classification, comprising a multi-scale input layer, a U-shaped convolutional network with attention blocks, multiple atrous spatial pyramid pooling blocks, and a parallel atrous convolution modulus (PAC). Validated using the UTNI-2021 dataset, the method achieves a Dice value of 91.9%, mIoU value of 87.0%, Precision value of 88.0%, recall value of 83.7%, and F1 score value of 84.3%. This novel approach stands out for ultrasound image segmentation, demonstrating superior performance on the UTNI-2021 dataset.
Qingbo Kang [18] introduces a method for the segmentation and classification of thyroid nodules in ultrasound images, emphasizing consistent intra-task and inter-task learning. Curated from a hospital in western China, the dataset enables training intra- and inter-task consistency, successfully eliminating task inconsistencies. The proposed method performs exceptionally well on all tasks related to thyroid nodule segmentation and classification.
To segment malignant thyroid nodules, Geng Li [19] proposes the fusion of an improved transformer and a large kernel CNN. This method combines a deep learning-based CAD approach, transform fusing CNN, utilizing widely used segmentation techniques. Employing the Big Kernel module for extracting specific shape features from ultrasound images, the model is evaluated against commonly used segmentation algorithms on the MTNS dataset and other accessible datasets.
Chong Geng [20] introduces a Dual-route Mirroring U-Net (DMU-Net) with mutual learning for segmenting malignant thyroid nodules. DMU-Net utilizes two subnets (U-shape subnet, inversed U-shape subnet) and three modules (pyramid attention module, margin refinement module, and aggregate module) to extract contextual information and margin characteristics from ultrasound images. Comparative evaluations with established methods on the MTNS dataset and other datasets reveal DMU-Net's superior performance.
The accuracy and consistency of inter-observer comparisons for ultrasound thyroid nodule diagnosis have been improved by Yan Cui's [21] suggested categorization of regularized dimensionality reduction. To project the retrieved feature vectors combined with CNN-predicted malignancy probabilities into 2D space, use a spatial segmentation classifier trained on 2614 ultrasound images. The proposed method combines the advantages of CNN and DRT by using the Uniform Approximation and Projection of the Regularized Classification Variety (CReUMAP). For the purpose of extracting features from thyroid ultrasound pictures, Ruiguo Yu [11] presented Feature discretization-based deep clustering. The proposed methods include a greediness-based label reassignment method and a global-local rule discretization method. The first reduces the loss fluctuation caused by recombination and increases the expressiveness of the representation network by limiting the eigenvalues.
According to the test results, the new FDDC can successfully complete 6 classification tasks. The tumor classification accuracy rate is 79.06%, and the machine classification accuracy rate is 96 17%. This recommended method makes use of visualization to verify the FDDC's feature space representational capability. To diagnose multimodal thyroid ultrasound images, Cheng Zhao created a self-supervised multimodal fusion network. The recommended system consists of Three ResNet18s with self-supervised learning, as their initialization is initially used as branches to retrieve the picture data for each modality. The background information of the three modalities is cleaned using the Multi-Head Multimodal Attention Branch, and subsequently, the knowledge from each modality is fused for thyroid diagnosis. The findings demonstrate that the multimodal thyroid ultrasound image identification approach can help sonographers identify thyroid nodules quickly and precisely. In a self-assembled dataset, the author confirms the methodology [22].
Several magnification parameters were used in Bing Han's [9] proposed automatic classification approach for thyroid abnormal images. The thyroid pathological images in this suggested system are divided into PTC and normal thyroid pathological images using an active classification approach for papillary thyroid cancer (PTC) pathological images. This system's design used the attention process to merge diseased images with various magnification factors, simulating thyroid cancer detection under a microscope. The convolutional neural network's uncertainty and representative information were used by the author to identify the best samples for annotation that would lower labelling costs. The results of the experiments demonstrate that our technique can successfully recognize PTC on the VIP-TCHis dataset.
Muthu Subash Kavitha proposed employing a network with supervised weight-learning techniques to identify thyroid cancer lymph nodes [23]. The authors introduced an end-to-end trained model called the input-driven leveraged segmentation network (LSIG), created without pre- or post-processing functionalities. This model learns appropriate parameter values based on the volumes where various objects appear. The authors innovatively developed a reweighting negative control (RNC) mecha- nism comprising a reweighting term (Rw) and a negative control function (NcF) to enhance class co-occurrence and regulate false positive regions. In comparison to CNN-based networks utilizing ground-truth (GT) masks generated from post-ablation single-photon emission tomo- graphy (SPECT/CT), LSIG demonstrated notable perfor- mance [24]. The LSIG model exhibited an AUC value of 94.9%, surpassing the previous PTC network by 14.6%, which utilized a fully guided LSFgCNN (Fg) model.
From the above papers, the research gaps identified are Limited Dataset Size and Diversity, Narrow Focus on Specific Models, Insufficient Hyperparameter Optimi- zation, Balanced Performance Metrics, and Comparison with Human Diagnostic Accuracy. The gap bridging strategies are;
2.1. Expanding and Diversifying the Dataset
This study utilized a comprehensive dataset of 7,893 images from four different sources (PERSIAN, DDTI, ACR TIRADS, and AUITD), ensuring a diverse representation of thyroid images. By addressing the limitations of dataset size and diversity, the study enhances the generalizability and robustness of the model’s performance across different demographic and clinical settings.
2.2. Comprehensive Model Comparison
A wide range of transfer learning models were evaluated, including DenseNet169, ResNet101, and various EfficientNet variants. This approach provides a thorough comparison, identifying the most effective models for thyroid nodule classification and filling the gap in narrow model focus.
2.3. Rigorous Hyperparameter Tuning
An exhaustive grid search strategy was employed to systematically tune hyperparameters such as learning rate, batch size, optimizer type, and dropout rate. This rigorous optimization process ensures that the models are performing at their best, addressing the gap in insufficient hyperparameter optimization.
2.4. Balanced Evaluation Metrics
In addition to accuracy, the study monitored precision, recall, and F1 score to provide a balanced assessment of model performance. Ensuring balanced performance across different metrics helps in creating models that are not only accurate but also reliable and effective in real-world diagnostic scenarios.
3. THYROID NODULE IMAGE IDENTIFICATION FOR PRE-PROCESSING
3.1. Threshold
The simplest technique for segmenting images is thresholding. It can be used to create binary images from grayscale images [25]. Thresholding is a segmentation technique that creates a binary image by dividing a given grayscale image into two regions based on threshold values. A binary image is one whose pixels have only two values, 0 and 1, and so uses only one bit to record pixel intensity. So, in the output image, pixels with intensity levels more than the specified threshold will be classified as white or 1, and those with lower values will be treated as black or 0. Abbreviations and Acronyms
3.2. Noise Removal
Noise often spoils pictures. For example, noise may occur while taking and sending the photo. The role of noise removal in image processing is important. Image processing performance is often affected by noise reduction. In color image processing, a number of strategies for noise removal are well established [26]. The type of noise that affects the image determines the nature of the noise reduction problem. According to the widely recognized theory, Johnson-Nyquist noise (thermal noise), which includes noise from capacitor reset noise, is the main cause of amplifier noise. This noise is pixel-specific, additive, Gaussian, and signal-intensity dependent (“kTC noise”). Here are a few illustrations of the various types of visual noise:
1. Salt and pepper noise.
2. Shaped noise.
3. Rayleigh noise.
4. Gaussian noise.
5. Exponential noise.
6. Erlang (gamma) noise.
3.2.1. Gaussian Noise
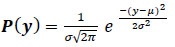
According to the widely recognized theory, Johnson-Nyquist noise (thermal noise), which includes noise from capacitor reset noise, is the main cause of amplifier noise [27]. This noise is additive, Gaussian, pixel-specific, and signal-intensity dependent (“kTC noise”). The result of random oscillations in the signal is white noise. There may be greater noise when the blue channel of color cameras is amplified more than the green or red channels. The primary cause of the consistent noise level in the picture's black parts is amplifier noise, which contributes to the noise of an image sensor. Due to these effects, each pixel in the image will (usually) experience a small amount of change from its initial value. A histogram displays the typical distribution of noise and plots the degree of distortion of a pixel value against its frequency (Eq 1).
3.2.2. Salt and Pepper Noise
Spike noise, impulse noise, independent noise, and random noise are other names for salt and pepper noise [11]. An image's salt and pepper noise (sparse light and dark interruptions) makes some pixels stand out from the background in terms of color or intensity. “Salt and pepper noise” is the term used to describe the appearance of black and white specks. Dust particles within the camera and damaged or overheated CCD (Charge-coupled device) components are frequent reasons. Bright regions will appear as dark pixels in a picture with salt-and-pepper noise and vice versa [14].
3.2.3. Rayleigh Noise
For a variable with a positive value, the Rayleigh distribution is a regular distribution. This often occurs when the amplitude and direction components of a vector are connected (Eq 2).

3.2.4. Exponential Noise
The probability distribution, known as the exponential distribution, is used to represent how quickly events occur in a Poisson process. It is an instance of the gamma distribution in particular (Eq 3).

3.2.5. Erlang (gamma) Noise
Theoretically, random noise can “represent” a mathematical function. A model is precisely what it sounds like it is. Based on probability, we may describe the “distribution” of the noise. It is considerably simpler to design filters to reduce noise once it has been quantified. We'll only review the various probability density functions (PDFs) in this post and get acquainted with six distinct noise models (Eq 4).
3.3. Normalization
Normalization in machine learning generally refers to the process of transforming input data into a standard or classification model to improve the performance and stability of machine learning models [15]. Normalization can help improve the convergence speed of training algorithms, reduce the impact of outliers in the data, and prevent numerical instability in the models. Natural language processing, recommender systems, image and audio recognition, and other machine learning applications frequently use normalization.
4. METHODS
4.1. Dataset and Image Pre-processing Phases
The thyroid ultrasonography (US) dataset presented in this study is helpful. Two thousand four hundred fifty thyroid US images were gathered between 2018 and 2020 as part of the Prospective Epidemiology Research Study in Mashhad, Iran (PERSIAN), a significant national cohort study [28]. The characteristics of ACR TIRADS, developed by skilled medical professionals, are provided together with the ROI of thyroid nodules on these US images in XML format. ACR-TIRADS classifies the images in the collection into five classes (Tirads1-Tirads5). Here, we have collected for PERSIAN (2450 thyroid images), DDTI (480 images), and AUITD (3538 thyroid images). A graph within a graph is an “inset”, not an “insert”. The word alternatively is preferred to the word “alternately” (unless you really mean something that alternates). Table 1 shows the number of images in each dataset used for thyroid classification. The datasets used (PERSIAN, DDTI, ACR TIRADS, and AUITD) are curated from reputable sources, ensuring high-quality images and accurate annotations. High-quality data can often compensate for smaller datasets by providing clear and precise information for model training. Each dataset includes a representative sample of the specific medical conditions or imaging modalities under study. This targeted approach helps in building a robust model for the intended application, even with a limited number of images. To mitigate the issue of limited data, we have employed advanced data augmentation techniques. These techniques artificially increase the dataset size by generating modified versions of existing images through transformations such as rotations, scaling, flipping, and intensity variations. This helps in improving the model's robustness and generalization ability.
| S.No. | Dataset | No. of Images |
|---|---|---|
| 1 | PERSIAN | 2450 |
| 2 | DDTI | 480 |
| 3 | ACR TIRADS | 1425 |
| 4 | AUITD | 3538 |
Classification of thyroid nodules using Transfer learning methods.
4.2. Workflow of the Comparative Study
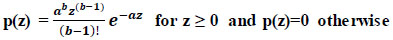
To analyze the data, a Computer running Windows, equipped with 8GB of RAM, was employed. Using a variety of transfer learning approaches, the features from the photo files were retrieved. Two separate attribute files were taken from the images to define the person and gender. Data sets used for training and testing were divided using the method of 10-fold cross-validation. The first step in the procedure is to partition the data into n groups. One group is utilized for testing, while the other nine groups are used for training [29]. To use the entire dataset of thyroid imaging data for both testing and training, this procedure is performed ten times with the groups being switched. The Python program's classi- fication techniques were used to test attribute files made for thyroid categorization, and the best classification success was sought after [30]. The study's transfer learning techniques, classification algorithms, and success rates are discussed in the Results section. The study's process is displayed below. Fig. (1) depicts various steps followed for classifying thyroid nodules.
4.3. Classification
4.3.1. Random Forest Classification
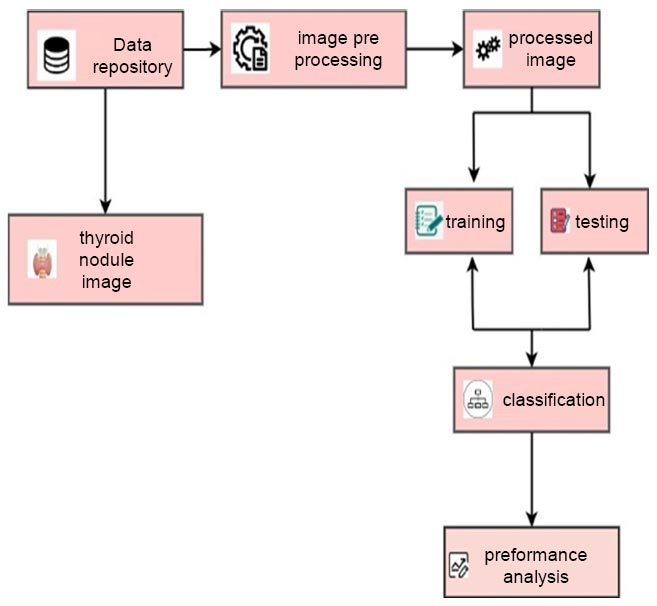
Utilizing a random forest classification methodology in machine learning is applied to classification problems [31]. A prediction is made using an ensemble learning technique that integrates different decision trees. Here is how the random forest method functions:
Build a decision tree using a random subset of features and a random subset of training data. Each tree in the forest is trained individually with a unique random subset of the training data. Each tree in the forest independently predicts the class of input data during prediction [32]. The final prediction is made by a majority vote of each tree. Random forest classification has several advantages over a discrete decision tree: Random forest can handle both categorical and continuous data. Random forests are less invasive than individual decision trees [33]. Random forests can be high-dimensional data with many features. Random forests provide estimates of feature values and can be used for feature selection. Random forest can handle imbalanced datasets by using class weights or sampling techniques. However, random forest also has some limitations, such as: Random forest can be computationally expensive for large datasets. Random forest is not well suited for extrapolation or extrapolation beyond the range of the training data. Overall, random forest classification is a powerful algorithm that can be used for a variety of classification tasks, especially when dealing with complex and high-dimensional datasets. Fig. (2) shows the decision tree built by a random forest classifier.
4.4. Transfer Learning
Transfer learning is a stream in machine learning research that deals with storing knowledge gained while solving one problem and applying it to other related problems [34]. A person who can ride a bike, for instance, could find it easier and quicker to learn how to use a scooter. When confronted with similar circumstances, the person uses their ability to stay balanced while driving a scooter and unintentionally applies what they have learned. The capacity to retain information learned from solving one problem and use it to solve another later is known as transfer learning. Models that make better use of existing knowledge and learn more quickly with less training data are developed using transfer learning. The most advantageous feature of transfer learning is that a fraction of the trained model needs learning in order to use it. We can achieve this and save time by using transfer learning.
Random forest classifier.
4.4.1. VGGNET
Researchers first unveiled VGGNet (Visual Geometry Group Network), a deep convolutional neural network architecture, in 2014. When it comes to computer vision tasks like picture categorization and object recognition, VGGNet is renowned for its efficiency and simplicity. In order to minimize the output's spatial dimension, VGGNet employs a sequence of convolutional layers with modest filter sizes (3x3). As the network becomes more complex, the number of filters eventually grows. The determination of architecture often involves specifying the number of convolutional layers and the number of filters within each layer. The architectures with 16 and 19 layers, respectively, called VGG16 and VGG19, are the most widely used ones. VGGNet has attained cutting-edge technology. Performance on a variety of benchmark datasets, including ILSVRC, where it ranked among the best models. Many more deep-learning computer vision architectures, including the Inception and ResNet designs, have been built on top of VGGNet.
4.4.2. AlexNet
Having undergone training on a dataset comprising over a million images, AlexNet demonstrates the capability to classify images into 1000 distinct categories, encompassing items like keyboards, coffee mugs, pencils, and various animals. The network has acquired intricate feature representations across a range of photos. Upon receiving an image as input, the network produces a label for each object along with corresponding probabilities for the various object categories. The architecture of AlexNet consists of five convolutional layers and three fully connected layers. To reduce the input's spatial dimensions, the first two convolutional layers have large filter sizes (11x11 and 5x5) and a stride of 4, and they are followed by max pooling layers to further reduce the size. With a stride of 1 and no pooling, the final three convolutional layers have smaller filter sizes (3x3). The use of the Rectified Linear Unit (ReLU) activation function, dropout regularisation, and data augmentation techniques were just a few of the additional innovations that AlexNet introduced. AlexNet paved the way for many other deep learning architectures by demonstrating that deep neural networks can perform significantly better than conventional machine learning techniques for computer vision tasks.
4.4.3. DenseNet
Every layer is connected to the others by the Dense Convolutional Network (DenseNet). They solve the vanishing-gradient problem, greatly reduce the number of parameters, enhance feature propagation, promote feature reuse, and boost feature reuse. DenseNet achieves enhanced depth, precision, and efficiency in training convolutional networks by incorporating short connections between layers near the input and those near the output.
4.4.4. ResNet
ResNet, which stands for Residual Network, is an architecture for deep learning that was initially presented in 2015 by Microsoft Research researchers and designed specifically to tackle the problem of vanishing gradients in exceptionally deep neural networks. This convolutional neural network (CNN) is tailored to address the challenge encountered in training normal deep neural networks. As the network's depth increases, conventional deep neural networks face difficulties due to the potential diminution of gradients, making training challenging. This issue is resolved by ResNet, which adds a “residual block” that enables the network to pass through layers that are not significantly contributing to the final result and better maintain gradient flow. A residual block in ResNet comprises two convolutional layers with a shortcut link, which adds the input to the block's output. Following this addition, a non-linear activation function, such as ReLU, is applied to the output. ResNet architectures have achieved state-of-the-art performance in various computer vision tasks, including but not limited to segmentation, object detection, and image classification. They are extensively employed in numerous fields, including autonomous vehicles, imaging in the medical field, and video analysis.
4.5. Splitting of Data for Training and Testing
Machine learning employs the data split technique, dividing available data into training and testing sets to assess a model's performance on new data. The training set is utilized for model development, while the testing set evaluates its performance. Although a common practice involves a 70% training and 30% testing split, this ratio may vary based on dataset size and model complexity. Evaluating the model on a distinct testing set helps gauge its generalization to new, untested data. A model exhibiting good performance on the testing set is more likely to generalize well to new data, while poor performance may indicate overfitting to the training set, necessitating model adjustments. Fig. (3) shows the 10-fold validation of training and test data.
4.6. Performance Evaluation Metrics
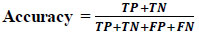
The performance analysis of thyroid categorization systems is done using the confusion matrix. The columns of the confusion matrix, a 2x2 matrix, contain the real samples that should belong to each class, while the rows reflect the estimated sample data for each class. The row and column information can also be inverted when creating the confusion matrix. Precision, Recall, Accuracy, and F1-score rates are scores derived by the confusion matrix in Table 2 below.
| - | Actual Class | |
|---|---|---|
| - | True | False |
| Positive | TP | FP |
| Negative | FN | TN |
Metrics for performance evaluation are used to evaluate how well a machine learning model is performing. These measures are used to assess how successfully the model generalizes to new, untrained data and learns from the training data. The challenge at hand and the model's aims influence the choice of metrics. Here are some common machine learning performance evaluation metrics:
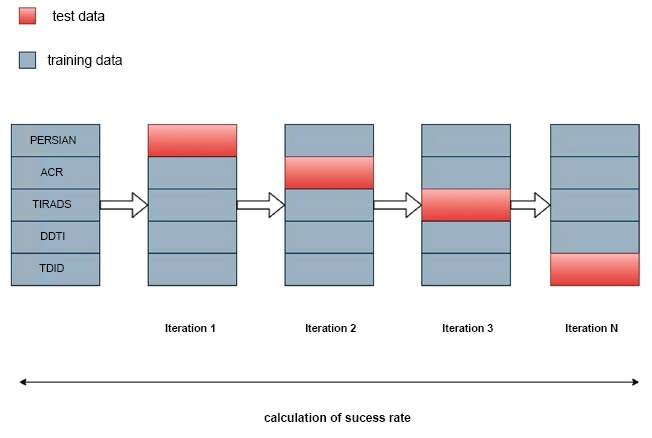
10 fold cross validation.
4.6.1. Accuracy
Accuracy is determined by the percentage of correct predictions made by the model. Calculate accuracy by dividing the total number of correct predictions by the total number of assumptions (Eq 5).
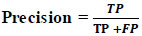
4.6.2. Precision
The fraction of accurate positive forecasts overall true positive is how precision is calculated. When the objective is to reduce false positives, it is employed (Eq 6).
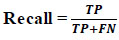
4.6.3. Recall
Recall measures the proportion of accurate positive predictions relative to all actual positive occurrences. It is employed when the objective is to minimize false negatives (Eq 7).
4.6.4. F1 Score
The F1 score serves as the harmonic mean of precision and recall, providing a combined metric when both precision and recall are of significance.
In both the training and testing phases, a model's performance is evaluated using these metrics. They can be used to identify areas where the model is performing poorly and to adjust the model's parameters to improve its performance.
5. RESULT AND DISCUSSION
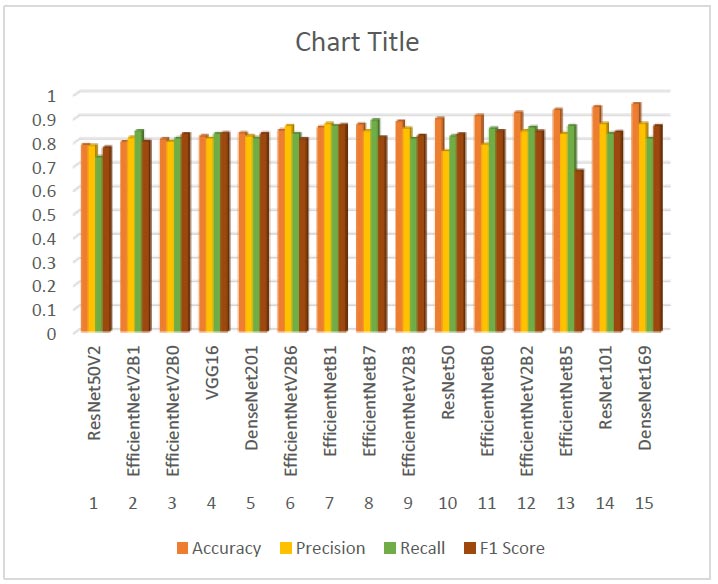
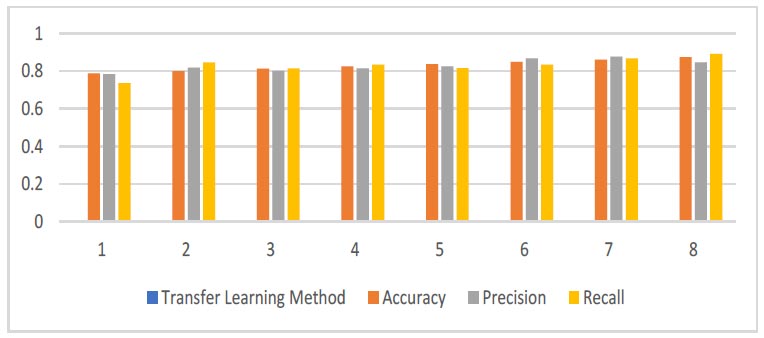
Two thousand four hundred fifty thyroid US images were gathered between 2018 and 2020 as part of the Prospective Epidemiology Research Study in Mashhad, Iran (PERSIAN), a significant national cohort study. Along with the ROI of thyroid nodules on these images, the ACR TIRADS characteristics—developed by qualified medical professionals—are provided in XML format. ACR-TIRADS classifies the images in the collection into five classes (Tirads1-Tirads5). The characteristics are extracted from the dataset's pictures using a variety of transfer learning algorithms. The dataset comprises four image collections: PERSIAN, DDTI, ACR TIRADS, and AUITD, with a total of 7,893 images. Despite the relatively small size, the datasets are high-quality and representative of the medical imaging domain. The attribute file with the best success rate was selected after each feature file had been tested using the random forest technique. Fig. (4) shows the various evaluation measures of classifiers (Table 3).
The performance of each model was evaluated using accuracy, precision, recall, and F1 score metrics. Here, we present the results and provide an in-depth analysis of the findings. DenseNet169 achieved the highest accuracy at 0.9596, demonstrating superior overall performance. Its precision (0.8767), recall (0.8144), and F1 score (0.8675) metrics indicate a balanced and effective model. ResNet101 also performed very well with an accuracy of 0.9474, high precision (0.8762), and competitive recall and F1 scores, marking it as a strong contender. The EfficientNet family consistently showed strong performance across different variants. Notably, EfficientNetB5, EfficientNetV2B2, and EfficientNetV2B6 exhibited high accuracies and robust performance metrics. EfficientNetB7 achieved a high recall (0.8912), indicating its effectiveness in identifying positive cases, albeit with slightly lower precision (0.8456). Classic models like VGG16 and ResNet50 demonstrated solid performance, with VGG16 achieving an accuracy of 0.8246 and a balanced F1 score of 0.8367. ResNet50 showed strong performance with an accuracy of 0.8982, making it a reliable choice for comparison. ResNet50V2, while a classic, had the lowest accuracy among the models tested (0.7877), suggesting it may not be as effective for this specific dataset compared to newer models. DenseNet169, the model initially chosen, performed exceptionally well with the highest accuracy and strong metrics across precision, recall, and F1 score. This justifies its initial selection due to its balanced and reliable performance.
Evaluation measures of various classification results.
| No. | Transfer Learning Method | Accuracy | Precision | Recall | F1 Score |
|---|---|---|---|---|---|
| 1 | ResNet50V2 | 0.7877 | 0.7843 | 0.7356 | 0.7763 |
| 2 | EfficientNetV2B1 | 0.8100 | 0.8181 | 0.8456 | 0.8017 |
| 3 | EfficientNetV2B0 | 0.8123 | 0.8012 | 0.8146 | 0.8333 |
| 4 | VGG16 | 0.8246 | 0.8145 | 0.8344 | 0.8367 |
| 5 | DenseNet201 | 0.8368 | 0.8245 | 0.8116 | 0.8345 |
| 6 | EfficientNetV2B6 | 0.8491 | 0.867 | 0.8342 | 0.8123 |
| 7 | EfficientNetB1 | 0.8614 | 0.8767 | 0.8674 | 0.8709 |
| 8 | EfficientNetB7 | 0.8737 | 0.8456 | 0.8912 | 0.819 |
| 9 | EfficientNetV2B3 | 0.8806 | 0.8564 | 0.8133 | 0.8265 |
| 10 | ResNet50 | 0.8982 | 0.7612 | 0.8243 | 0.8324 |
| 11 | EfficientNetB0 | 0.9105 | 0.7891 | 0.8567 | 0.8454 |
| 12 | EfficientNetV2B2 | 0.9228 | 0.8453 | 0.8613 | 0.8444 |
| 13 | EfficientNetB5 | 0.9351 | 0.8346 | 0.8675 | 0.6782 |
| 14 | ResNet101 | 0.9474 | 0.8762 | 0.8345 | 0.8412 |
| 15 | DenseNet169 | 0.9596 | 0.8767 | 0.8144 | 0.8675 |
| Learning Rate | Ranges Tested from 0.0001 to 0.1 |
|---|---|
| Batch Size | Values tested at 16, 32, 64, and 128 |
| Number of Epochs | Tested up to 100 epochs |
| Optimizer | Adam, SGD, RMSprop |
| Dropout Rate | Tested at 0.2, 0.4, 0.5, and 0.6 |
| Weight Decay | Ranges tested from 0 to 0.0005 |
5.1. Hyperparameter Tuning and Optimization Process
To ensure the optimal performance of the models, we performed comprehensive hyperparameter tuning and optimization. The following hyperparameters were considered for tuning (Table 4).
A grid search strategy was employed for systematic hyperparameter tuning, involving an exhaustive search over specified hyperparameter values. The primary evaluation metric used for hyperparameter selection was validation accuracy. Additionally, precision, recall, and F1 scores were monitored to ensure balanced performance across different metrics. A 5-fold cross-validation method was used to evaluate the performance of different hyperparameter configurations, ensuring that the selected hyperparameters generalize well across different data subsets. For DenseNet169, the optimal configuration included a learning rate of 0.001, batch size of 32, Adam optimizer, and a dropout rate of 0.5. For ResNet101, the best results were obtained with a learning rate of 0.0001, batch size of 64, RMSprop optimizer, and a dropout rate of 0.4. For EfficientNetB1, the optimal configuration involved a learning rate of 0.0005, batch size of 32, SGD optimizer, and a dropout rate of 0.4.
Table 5 above displays the outcomes of the DenseNet169 properties. The classification methods were evaluated based on several performance metrics, including accuracy, recall, precision, and F1 score. Discriminant Analysis Linear Discriminant Analysis (LDA) emerged as the top-performing classifier with an accuracy of 92.46%, outperforming other methods. LDA also demonstrated high recall, precision, and F1 score, indicating its robustness in correctly identifying both positive and negative instances. Linear Model Ridge Classifier and Linear Model Ridge Classifier with cross-validation (CV) achieved competitive accuracy scores of 90.92% and 90.01%, respectively, while maintaining balanced performance across other metrics. Support Vector Machine (SVM) with linear kernel and Linear Model Logistic Regression with CV also showed strong performance, with accuracy scores above 88%. Ensemble methods, such as the Ensemble Hist Gradient Boosting Classifier, while slightly lower in accuracy at 81.54%, still exhibited respectable performance across all metrics. Neural Network MLP Classifier and Linear Model Logistics Regression lagged behind in accuracy but maintained moderate performance in other metrics. Overall, Discriminant Analysis LDA stands out as the preferred classifier due to its superior accuracy and balanced performance across all evaluated metrics Fig. (5).
| Classification Method | Accuracy | Recall | Precision | F1 Score |
|---|---|---|---|---|
| Linear model ridge classifier | 0.9092 | 0.9007 | 0.9109 | 0.9038 |
| SVM linear svc | 0.8882 | 0.8885 | 0.8947 | 0.8912 |
| Linear model ridge classifier cv | 0.9001 | 0.9007 | 0.9109 | 0.9038 |
| Ensemble hist gradient gradient-boosting classifier | 0.8154 | 0.8164 | 0.8286 | 0.8234 |
| Linear model logistic regression cv | 0.8954 | 0.8955 | 0.9023 | 0.9032 |
| Discriminant analysis linear discriminant analysis | 0.9246 | 0.9233 | 0.9256 | 0.9315 |
| Neural network MLP classifier | 0.8677 | 0.8703 | 0.8832 | 0.8734 |
| Linear model logistics regression | 0.8431 | 0.8399 | 0.8499 | 0.8515 |
Evaluation measures of DenseNet169.
CONCLUSION AND FUTURE WORK
In conclusion, this study presents a comprehensive evaluation of transfer learning models for thyroid nodule classification, addressing several gaps identified in previous research. By utilizing a diverse dataset and conducting rigorous hyperparameter tuning, we demonstrated the effectiveness of advanced deep-learning techniques in accurately distinguishing between malignant and benign thyroid nodules. Our findings highlight the superior performance of models such as DenseNet169, ResNet101, and various EfficientNet variants, surpassing traditional diagnostic approaches reliant on human evaluation. The study emphasizes the potential of integrating AI techniques in medical diagnostics, offering more accurate and consistent methods for detecting thyroid diseases. By providing a balanced evaluation of model performance metrics, including precision, recall, and F1 score, we ensure the reliability and robustness of our findings. Furthermore, the comparison with human diagnostic accuracy underscores the practical implications of AI in improving patient outcomes and reducing diagnostic errors. The results of this study demonstrate that the applied transfer learning methods significantly enhance the ability to distinguish between malignant and benign conditions compared to traditional diagnostic approaches reliant on the human eye. DenseNet169, with its optimal hyperparameter configuration, achieved the highest accuracy of 95.96%, indicating its superior performance in correctly identifying disease states. Additionally, models such as ResNet101 and EfficientNetB1 also showed remarkable accuracy and balanced performance metrics, further underscoring the potential of these advanced deep-learning models in medical diagnostics. These models not only improve diagnostic accuracy but also offer a consistent and unbiased approach to evaluating medical images, thereby reducing the likelihood of human error and variability. By leveraging these state-of-the-art transfer learning methods, it is possible to achieve a higher level of diagnostic precision, ultimately leading to better patient outcomes. This study highlights the importance of integrating advanced AI techniques in medical practice, paving the way for more reliable and accurate disease detection.
AUTHORS' CONTRIBUTION
It is hereby acknowledged that all authors have accepted responsibility for the manuscript's content and consented to its submission. They have meticulously reviewed all results and unanimously approved the final version of the manuscript.
LIST OF ABBREVIATIONS
| PAC | = Parallel Atrous Convolution Modulus |
| RNC | = Reweighting Negative Control |
| GT | = Ground-truth |
| NcF | = Negative Control Function |
| Rw | = Reweighting Term |
AVAILABILITY OF DATA AND MATERIALS
The datasets and code used in this study are available from the corresponding author upon request [V.R].

