
A Prognostic Model to Improve Asthma Prediction Outcomes Using Machine Learning
Authors Info & Affiliations
Abstract
Purpose
The utility of predictive models for the prognosis of asthma disease that rely on clinical history and findings has been on the constant rise owing to the attempts to achieve better disease outcomes through improved clinical processes. With the prognostic model, the primary focus is on the search for a combination of features that are as robust as possible in predicting the disease outcome. Clinical decisions concerning obstructive lung diseases such as Chronic obstructive Pulmonary Disease (COPD) have a high chance of leading to results that can be misinterpreted with wrong inferences drawn that may have long-term implications, including the targeted therapy that can be mistakenly beset. Hence, we suggest data-centric approaches that harness learning techniques to facilitate the disease prediction process and augment the inferences through clinical findings.
Methods
A dataset containing information on both symptomatic representations and medical history in the form of categorical data along with lung function parameters, which were estimated using a spirometer (with the data basically being quantitative (numerical) in nature) was used. The Naïve Bayes classifier performed comparatively well with the optimized feature set. The adoption of One-Class Support Vector Machines (OCSVM) as an alternative method to sampling data has resulted in the selection of an ideal representation of the data rather than the regular sampling approach that is used for undersampling.
Results
The model was able to predict the disease outcome with a precision of 86.1% and recall of 84.7%, accounting for an F1 measure of 84.5%.The Area under Curve (AUC) and Classification Accuracy (CA) were evaluated to be 92.2% and 84.7% respectively.
Conclusion
Incorporating domain knowledge into the prediction models involves identifying clinical features that are most relevant to the process of disease classification using prior knowledge about the disease and its contributing factors, which can significantly enhance the productivity of the models. Feature engineering is centric on the use of domain knowledge within clinical prediction models and commonly results in an optimized feature set. It is evident from the experimental results that using a combination of medical history data and significant clinical findings result in a better prognostic model
1. INTRODUCTION
Spirometry is regarded as one of the most performed investigation methods to gauge the pulmonary function in patients with chest diseases, such as asthma. However, the methodological deployment of the equipment and performance strategies require high degrees of attention towards quality control, and these have been well-standardized and subjected to constant revisions from time to time. Despite this, most of the studies related to prediction equations for spirometry have lost their utility as they are several decades old and were carried out with equipments and standardized procedures that have changed a lot since then [1-3]. Added to this, the lung health of the population has seen a dramatic change over the years, leading to a failure in reliability. The health of the lung and its functionality, to a large extent, is affected by age, height, weight, ethnicity, exposure to environ- mental factors, and socio-economic status, along with a few other factors remaining unidentified. Additionally, no “typical “or “normal” values can be applied to a common population [4-6]. Moreover, in order to have a specific common scale across varying populations, the comparison is made through expected values for patients of a specific age, gender, and physical characteristics. These expected values are broadly called predicted values and are generated using prediction equations built using regression analysis on data collected from a healthy population. A model that incorporates different sources of disease indicators is most often suggested as a better approach, yielding predictive models for individual risk assessment that are of greater value to both patients and clinicians. A wide range of such equations for lung functions have been developed, and there is a considerable difference in the predicted values [7-9]. Of the several such predictive equations including American Thoracic Society and the European Respiratory Society (ATS/ERS), The Global Lung Function Initiative (GLI), The Association for Respiratory Technology & Physiology (ARTP) and various others, ARTP reference equations for lung function has been used for generating the predicted values for forced expiratory volume in 1 second (FEV1) and Forced vital capacity (FVC) as it is considered to generalize on several populations and a deeper analysis has shown that it performs well for most spirometry parameters.
Feature Engineering involves tasks such as:
(i) Combination of multiple features
(ii) Creation of new features
(iii) Extraction of features from the original features.
All three tasks were targeted in our approach for integrating domain knowledge into the model developed. While the first two tasks involve manual intervention in the inclusion of features derived from those existing on the recommendations of the clinical work as per the literature available, the last task involves the application of a filter-based feature selection machine learning approach that is data-driven and is tailored to suit the nature of data available.
2. MATERIALS AND METHODS
2.1. Data Description and Acquisition
A dataset containing a mix of clinical findings from the pulmonary function test data, along with the clinical symptoms, was used to validate the proposed prognostic model. The dataset is mixed in that it contains information on both symptomatic representations and medical history in the form of categorical data along with lung function parameters estimated using a spirometer (with the data basically being quantitative (numerical) in nature). Feature engineering involves the adoption of domain knowledge to generate features so that it makes the prediction process more effective for well-tailored machine learning models. In addition to the available lung function parameters, we generate new features from a host of anthropometric indices included in the dataset by employing ARTP respiratory equations [10, 11].
The validation of the feature-driven prediction model is performed by deploying MSFET for the extraction of significant features that signify asthma severity indicators. MSFET involves the selection of severity indicators from the available set of features using feature-scoring techniques. This is followed by a comparative analysis of the various machine learning classifiers. Logistic regression, Support vector machine, and Naive Bayes classifiers were used to validate the performance of the model, and the best-performing classifier was adopted for the approach used. Further deep-learning techniques were also explored for the same [12, 13]. The performance of the model was evaluated on the complete and optimized feature sets obtained via MSFET, and the inferences drawn from an empirical analysis are presented.
We deployed the data documented during a study on the operation of the lungs and its diseases by the University of Innsbruck in the district of Brixlegg in Austria. The dataset included a variety of attributes perceived as covariates with respect to lung disease. The data contained the responses recorded for 1549 children. The missing values for the attributes were recorded as -1. The variables with respect to which the disease was expressed included the degree of pollution in the environment at the place of residence characterized through three categorical levels, extremely polluted, moderately polluted, and highly polluted with ozone, along with the other attributes including parental character-istics, such as details with respect to paternal/ maternal smoking, besides parental level of education and existence of comorbidities including cold, cough and existing allergies. The gender attribute was encoded as 0 for males and 1 for females. A variable on the presence/absence of bronchial tube disease, one of the most important parameters that help in ascertaining asthma as a disease rather than a symptomatic presentation, was also included in the data collected. PEF, the maximum speed of expiration (airflow at exhalation), as measured with a peak flow meter, was also included. Furthermore, clinical findings in the form of spirometer readings obtained by performing spirometry were recorded for the predominant and most common pulmonary function parameters.
2.1.1. Balanced Dataset Creation
The initial data containing 1549 samples consisted of 187 subjects with asthma, and the remaining 1362 samples represented non-asthmatics, illustrating a problem of class imbalance. Of the 187 subjects with asthma, only 163 samples were selected by eliminating the rest, which contained missing values for most of the attributes. On similar lines, samples with missing values were eliminated in the other group representing non-asthmatics, yielding a complete non-asthmatic dataset. About 12% of the inliers, estimating 163 subjects, were drawn from the total non-asthmatics using OCSVM. Overall, 326 instances covering 163 subjects with asthma and 163 non-asthmatics constituted the input dataset.
The input data represents a class-balanced dataset, as the number of asthmatics balances with the other group representing the non-asthmatics. One class SVM is one of the preferred approaches to eliminate outliers and produce highly dense regions of data when all the instances belong to the same class. Further, a multistage feature extraction technique was used to extract the predominantly contributing risk factors [6, 7]. The features extracted are further used in the reduced feature set to achieve the task of predicting the outcome of asthma disease. A comparative analysis of the prediction results is performed by adopting the traditional classifiers stated above.
Fig. (1) illustrates the process involved in the creation of a balanced dataset. The data is preprocessed by eliminating instances containing missing values. A subset of the data constituting the asthmatics is first drawn, followed by the extraction of non-asthmatics. OCSVM algorithm is then applied to the latter group to draw the most concentrated inliers that approximate the sample size as that of the other group (asthmatics). The two subsets are then merged to form the balanced dataset.
2.2. Model Building using Domain Knowledge and Feature Engineering
Pulmonary function tests involving results revealing lung functionality play a major role in the process of making a prognosis of the disease and the assessment of treatment effects. However, it could lead to mis- management of the related disease and the patients affected in the case of encountering differences in the way the lung function is expressed and interpreted [14-16]. Of the several respiratory lung equations that thrive on predicting the expected levels of PFT parameters for a given height, weight, and gender, we try to adopt the ARTP reference equations by introducing a few more lung function parameters for effectively predicting asthma predisposition [17-19].
| Variable | Code | Type |
|---|---|---|
| Environmental pollution zone | Zone | Categorical (Three categories) |
| Allergies | Aller | Categorical (Dichotomous) |
| Smoking status –mother | Msm | Categorical (Dichotomous) |
| Smoking status –father | Fsm | Categorical (Dichotomous) |
| Cold symptoms | Cold | Categorical (Dichotomous) |
| Cough | Cough | Categorical (Dichotomous) |
| Age | Age | Numeric |
| BMI | Bmi | Numeric |
| Lung capacity in liters | Fvc | Numeric |
| Speed of airflow when exhalation done | Pef | Numeric |
| Speed after 75% exhalation is done | Fef75 | Numeric |
| Speed after 50% exhalation is done | Fef50 | Numeric |
| Respiratory disease | Lung_dis | Categorical (Dichotomous) |
| Height | Height | Numeric |
| Weight | Weight | Numeric |
| Level of education | Socio | Categorical |
| Tiffeneau-Pinelli index | Tpi | Numeric |
| Actual to Predicted FVC | Actp | Numeric |
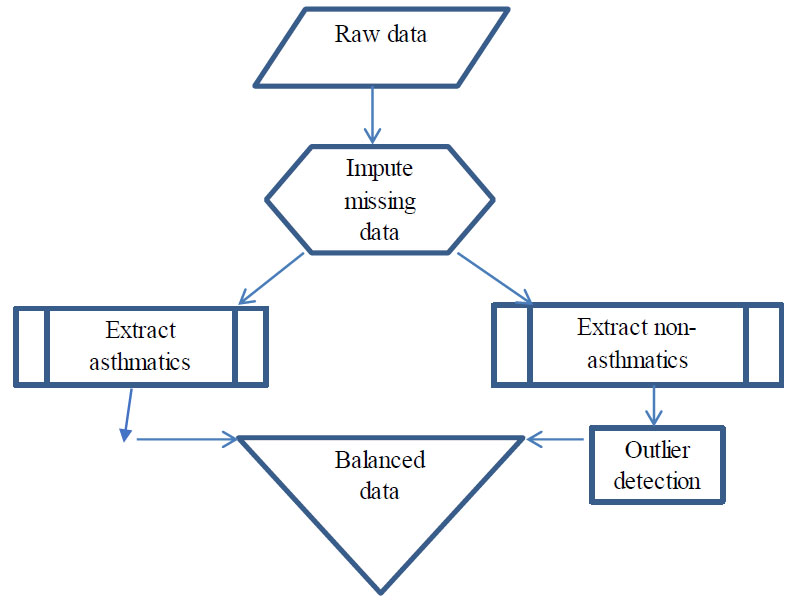
Balanced data creation.
Initially, a few attributes, including identification number, month of birth and examination, day of month, and examination, were eliminated as we found that they do not significantly contribute to the prediction process. However, the “age” attribute was deduced from the year of examination and the year of birth, which were included in the raw data. Subjects containing missing values for any of the attributes were eliminated. Additional features indicative of pulmonary function parameters fevp and fvcp, representing predicted values for FEV1 and FVC, were added to the dataset.
The fevp and fvcp were computed and deduced using the existing attributes, “height” and “age” for the males and females separately using the formulae published by the Association for Respiratory Technology and Physio- logy. The figures in the formulae are based on a regression model from a cohort study where “height” is in meters and “age” is in years and is expressed as follows for male and female genders separately:
(i) Male:


(ii) Female:


Using fevp and fvcp, we further evaluated the ratio between both, characterizing the Tiffeneau-Pinelli index, a common measure used by clinicians for the monitoring of lung functionality, which was added to the existing set of features. The ratio between the actual fvc recorded by the test and the predicted fvc computed as shown above was also included. Thus, the resulting dataset now included a host of features incorporating clinical findings and symptomatic and medical history. The feature “bmi” was added to the set of existing attributes as it was found to be one of the indicators for diseases in the children of the age group under study, as per the literature [20-22].
A summary of the different variables involved in the dataset is presented in Table 1.
2.3. Balanced Data Creation using OCSVM
2.3.1. Deploying One Class SVM
One class SVM offers a different approach to classification when compared to standard algorithms by modeling the distribution of one class only, and is one of the most preferred solutions in the case of data exhibiting class imbalance. The one-class SVM is used for training only on one class, which in our case represents the non-asthmatics outnumbering the asthmatics, thereby adopting a strategy to eliminate samples that would be regarded as outliers. The OCSVM learning algorithm attempts to input the data into a high-dimensional feature space while iteratively searching the margin that maximizes the hyperplane that best separates the training data from the origin. The OCSVM may be viewed as a regular two-class SVM where all the training data lies in the first class, and the origin is taken as the only member of the second class [23, 24].
One-Class Support Vector Machines (OC-SVMs) are a natural extension of SVMs. In order to identify distrustful observations, an OCSVM approximates a distribution that encompasses the best of the observations and then labels them as “suspicious” for those that lie far from them with respect to a suitable metric. An OCSVM solution is constructed by estimating a probability distribution function that treats most of the observed data more prospective than the rest and a decision rule that separates this observation by the largest possible margin. Involving a quadratic programming problem, the computational complexity of the learning phase is exhaustive, but once the decision function is decided, it can be used to effortlessly predict the class label of unseen data. Further, the method is seen to be effective at handling data containing both continuous and categorical values, and, itwas adopted for the data under study.
Solving the OCSVM optimization problem is equivalent to solving the dual quadratic programming problem (Eqs 5-7).
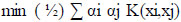
With the constraint
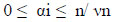
and

where α is a lagrange multiplier (or “weight” on instance “I” such that vectors associated with non-zero weights are called “support vectors” and exclusively determine the optimal hyperplane), ν is a parameter that controls the trade-off between maximizing the distance of the hyperplane from the origin and the number of data points contained by the hyperplane, “n” is the number of points in the training dataset, and K (xi,xj) is the kernel function. Using the kernel function to project input vectors into a feature space, we allow for nonlinear decision boundaries. Given a feature map (Eq 8):

wherein, Φ maps training vectors from input space to a high dimensional feature space, we can define the kernel function as (Eq 9):
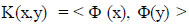
With this, the feature vectors do not need to be computed explicitly, and in fact, this capability greatly improves computational efficiency in directly computing kernel values.
The adoption of OCSVM as an alternative method to sampling data has resulted in the selection of an ideal representation of the data rather than the regular sampling approach that is used for undersampling, as there are all chances of leaving out significant instances that might be contributing to the prediction capability as the choice of samples happens randomly. With sampling, there is no underlying computational restriction when the samples are drawn from the original population, and, it might not be a preferred approach to represent the overall population effectively [25, 26].
3. RESULTS AND DISCUSSION
Furthermore, by calculating scores that determine whether an association between two categorical variables of the sample would reflect their true association in the population, the chi-square statistic estimates the dependence between the class attribute (target feature) and each of the features. In addition, by evaluating an attribute’s ability to discriminate between classes in relation to similar data instances, ReliefF assigns scores to features. The concept of finding variations in the feature values between pairs of closest neighbour instances forms the basis of ReliefF scores. Every time a hit occurs, the feature scores drop, indicating that a neighbouring instance pair with the same class has a different feature value. On the other side, the score rises if a miss occurs that indicates a nearby instance pair with a different class.
The predictors adversely affecting the classification process identified via their negative scores by the Relief algorithm were eliminated, and the reduced feature set was subsequently used for the classification task. Table 2 shows the feature scores for the individual features computed using feature ranking techniques, Information gain, and Gini decrease and are ranked by their scores. The box plots are shown for the first six predictors, which are observed to significantly differentiate the two populations.
Table 2.
| Feature | Information Gain | Gini |
|---|---|---|
| Pef | 0.131 | 0.085 |
| Lung_dis | 0.130 | 0.087 |
| fef50 | 0.125 | 0.083 |
| Fsm | 0.124 | 0.069 |
| Cold | 0.105 | 0.054 |
| Bmi | 0.099 | 0.067 |
| Fvc | 0.088 | 0.059 |
| Tpi | 0.055 | 0.037 |
| Cough | 0.054 | 0.036 |
| Zone | 0.033 | 0.021 |
| Aller | 0.028 | 0.018 |
| Actp | 0.014 | 0.010 |
The box and whisker plots depict the data concentrations and explain the divergence of extreme values from most of the data. Five values, namely the minimum value, the first quartile, the median, the third quartile, and the maximum value, are used to construct the plot, which best supports the comparison of other data values with respect to them [27-29]. The box plot distribution gives a projection of how tightly the data may be grouped or skewed while giving a clear indication of the symmetry of data, which may be inferred as follows.
Positively Skewed: Whenever the distance from the median to the maximum is larger than the distance from the median to the minimum, then the box plot is said to be positively skewed.
Negatively Skewed: Whenever the distance from the median to the minimum is larger than the distance from the median to the maximum, then the box plot is said to be negatively skewed.
Symmetric: The box plot is taken to be whenever the median is equidistant from the maximum and minimum values.
The box plot method adopted can be used as a reliable means to estimate some of the vital lung function parameters irrespective of the differences in the general population [30].
3.1. Characterizing Asthma Populations with Box Plots
Figs. (2a-c) adopt box plots to depict the data concentrations of the discrete features, namely cold, paternal smoking, and lung disease, chosen by the MSFET technique. The labels “0” and “1” along the bars indicate non-asthmatics and asthmatics, respectively. While “blue” represents absence, “red” represents presence. It can be observed that the features “cold” and “Paternal smoking” are dormant in the category representing non-asthmatics. The feature representing “lung disease” is, however, present in both groups, though the proportion of it is higher in asthmatics, as per the data density observed in the two groups.
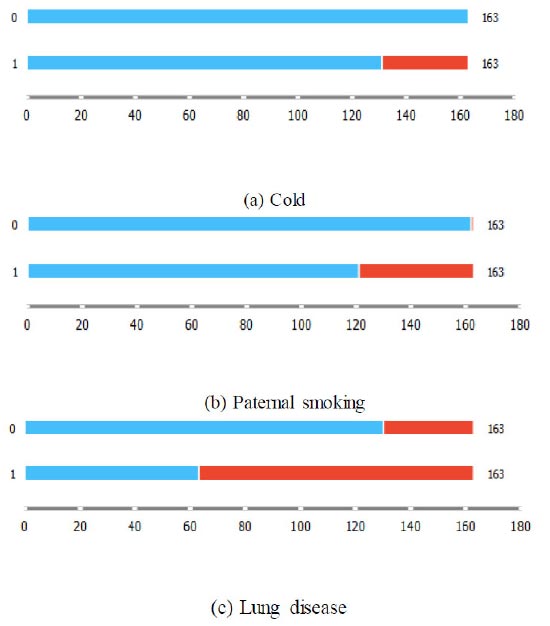
Box plots for categorical features chosen by MSFET.
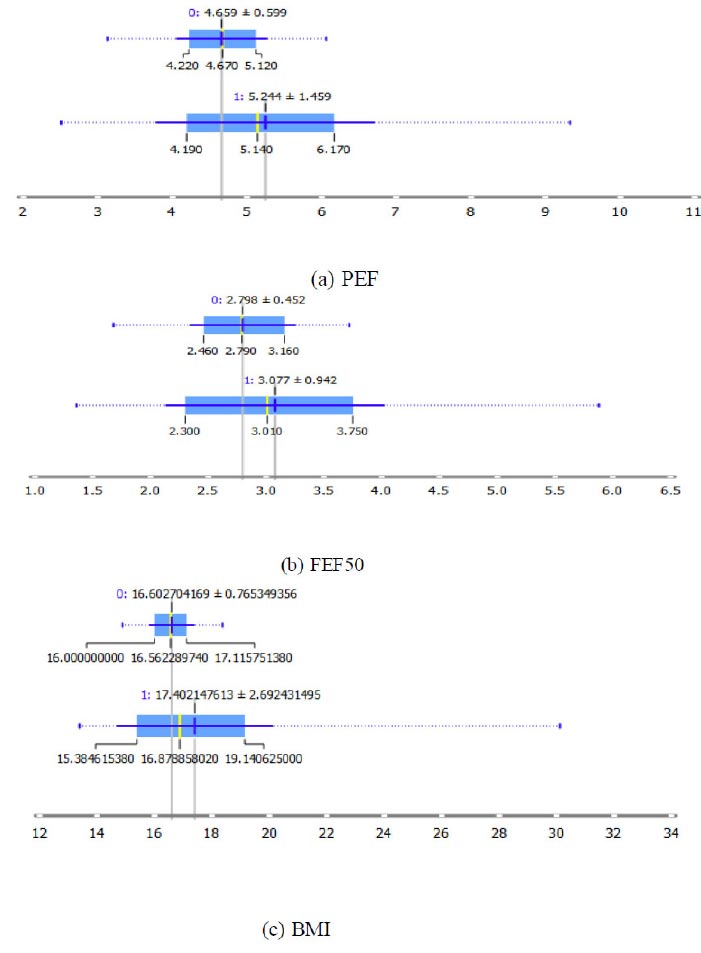
Box plots for continuous features chosen by MSFET.
| Optimized Combined Feature Set | |||||
|---|---|---|---|---|---|
| Method | AUC | CA | F1 | Precision | Recall |
| SVM | 0.940 | 0.834 | 0.833 | 0.843 | 0.834 |
| Naive Bayes | 0.922 | 0.847 | 0.845 | 0.861 | 0.847 |
| Logistic Regression | 0.922 | 0.840 | 0.840 | 0.846 | 0.840 |
| Complete Raw Feature Set | |||||
| SVM | 0.885 | 0.801 | 0.799 | 0.812 | 0.801 |
| Naive Bayes | 0.883 | 0.828 | 0.828 | 0.833 | 0.828 |
| Logistic Regression | 0.857 | 0.764 | 0.763 | 0.768 | 0.764 |
Figs. (3a-c) on similar lines depict the box plots for the numerical attributes PEF, FEF50, and BMI, respectively. It is observed that a PEF and FEF50 of 5.244+1.459 and 3.077+ 0.942, respectively, characterize an asthmatic population with a BMI of 17.402+2.69.
It can be observed from Table 3 that of all the classifiers, the Naïve Bayes classifier performed comparatively well with the optimized feature set. The model was able to predict the disease outcome with a precision of 86.1% and recall of 84.7%, accounting for an F1 measure of 84.5%. The AUC and CA were evaluated to be 92.2% and 84.7%, respectively. Furthermore, when the raw dataset excluded the features generated by feature engineering but included all the spirometer readings along with the symptomatic and history data were included, the model performed low, with the naïve Bayes classifier performing comparatively better with a reduced F1-measure of 82.8% accounting for a precision and recall of 83.3% and 82.8% respectively. The AUC and CA obtained with the complete feature set also showed a decline compared to the results with the optimized feature set. The sensitivity, which is most desirable from any of the clinical decisions, is quite low with the raw feature set (82.8%) as compared to the optimized feature set (84.7%). It is evident from this fact that it is of utmost importance to use the optimized feature set, which can always improve the prediction outcomes and enhance the performance efficiency of the models. With the optimized feature set containing the additional features generated by feature engineering, the classification accuracy was considerably increased. Feature engineering further places a significant impact in scenarios involving large data where there are exceedingly a greater number of features and where some of the useful, previously unknown features can be regenerated by using existing features backed by knowledge of the relevant domain.
CONCLUSION
It is evident from the experimental results that using a combination of medical history data and significant clinical findings results in a better prognostic model. Informative spirometer parameters specific to the disease diagnosis play a vital role in the accurate prediction of the disease, as the same parameters are used to judge a variety of related respiratory diseases, and a very small margin between them could be the basis for differentiation. Neither the clinical findings from spirometry nor the medical history alone can result in an optimal performance of the model. Clinical decisions concerning obstructive lung diseases such as COPD have a high chance of leading to results that can be misinterpreted with wrong inferences drawn that may have long-term implications, including the targeted therapy that can be mistakenly beset. Hence, we provide data-centric approaches that harness machine learning techniques to facilitate the disease prediction process, which can augment the inferences through clinical findings.
AUTHORS’ CONTRIBUTION
It is hereby acknowledged that all authors have accepted responsibility for the manuscript's content and consented to its submission. They have meticulously reviewed all results and unanimously approved the final version of the manuscript.
LIST OF ABBREVIATIONS
| COPD | = Chronic obstructive Pulmonary Disease |
| OCSVM | = One-Class Support Vector Machines |
| AUC | = Area under Curve |
| CA | = Classification Accuracy |
AVAILABILITY OF DATA AND MATERIALS
The data and supportive information are available within the article.

