
Tool FindCrispr: An Accurate Identification of Crisprs
Abstract
Introduction
The accurate identification of repeats and Clustered Regularly Interspaced Short Palindromic Repeats (CRISPRs) has a profound impact on studying and understanding prokaryotic immune systems.
Methods
A model with feature extraction and scoring is trained, solved made as a tool. The Welch’s t-test is conducted.
Results
The length of the repeater, the copy number of the repeater, the starting position sequence of the repeater, and the repeater sequence as the features. The scoring formula The sequence with overlapping starting points and the highest score among the absolutely repeat sequences is selected as CRISPR, which is used as a tool to find CRISPR. Among 302 archaea, 199 obtained the same results as pilerCR using findCrispr; 86 obtained more CRISPRs than pilerCR. The Welch’s t-test shows that the count of Crisprs recognized by the findCrispr tool is significantly different, with t-stat > 0.
Discussion
The feature extraction is effective. The model performs well, and the tool findCrispr is inclined to find more repeaters. The algorithm is a specialized algorithm that is sensitive to finding CRISPR with a small number of duplicates and has low tolerance for long, scattered repeats.
Conclusion
Features are extracted, and a scoring system is established using the tool findCrisprrealized, which performs superiorly to pilerCR in the identification of CRISPRs with multiple calibration repeaters. The tool findCrispr is of great significance for studying the biological function and mechanism of CRISPR.
1. INTRODUCTION
Clustered regularly interspaced short palindromic repeats (Crisprs) are sequences that lend themselves to important biological processes and are characterized by their special and relatively fixed sequence signature [1]. The exploration of the identification of repeats and Crisprs has been an investigation of great significance. Crisprs were first found in 1987 in Escherichia [1]. Crispr-Cas defense systems exist in half of the bacteria and most of the archaea as a unique prokaryotic defense [2-5]. 2137 base pairs constitute repeats that have almost nothing different and are separated by different spacer sequences [6]. Clusters of direct repeats and spacers, unique sequences that separate repeats, compose Crispr loci, viewed as the genetic memory of prokaryotes [7]. Clustered regularly interspaced short palindromic repeats (Crisprs) are DNA repeats that exists in most archaea and a lot of bacteria gene sequences [6]. Crispr/Cas systems furnish prokaryotes with a sequence-specific defense reaction against encroachment by extraneous nucleic acids of a kind that like phages or plasmids [8-10].
Crispr/Cas systems are used in many varied genome engineering [11-14]. Crispr-Cas systems in prokaryotes, including Crispr and Crispr associated genes contain lots of adaptive immune ways. Crispr/Cas systems are promising to become the next-generation diagnostic [6].
Crispr, consists of repeats (approximately 10-100 bp) and spacers (approximately 10-100 bp), is distributed in 40% of sequenced bacteria and 90% of sequenced archaea. Sequences of spacers, foreign DNA fragments captured by bacteria or archaea, are different, while sequences of repeaters (often with the same length as the spacer of Crispr) are almost the same and have the minimum number of repetitions of 3 [10, 15-17].
Actually, there have been many utilities for analyzing Crispr repeats. pilerCR and CrisprFinder are prevalent tools for searching Crispr repeats nowadays. They are all so user-friendly that when the users provide their sequences, several minutes later, the result report will be presented in front of them containing the repeat start points and repeat as well as spacer sequences accordingly. CrisprFinder employs an algorithm to screen sequences based on error rate [18-20]. pilerCR has both high sensitivity and high specificity, which is making piles through local alignments to itself that satisfy the Crispr requirement and can be quickly finished searching tasks. Nonetheless, pilerCR on certain occasions identifies the boundaries incorrectly, especially when they have an end or point cut [21-23].
To develop an accurate method to identify repeats and Crisprs, an algorithm and tool is therefore proposed and made based on the properties of Crisprs. We build a model through analysis of Crisprs’ properties and transfer the identification of Crisprs to finding the best parameters of the scoring formula constructed by features extracted from Crispr’s properties. Experiments using the complete genome of archaea determined the parameters and showed that this algorithm was inclined to find more Crispr repeats than pilerCR. Besides, the Crisprs found by the tool findCrispr of our algorithm can be clearly visualized as figures. Our tool findCrispr would help biologists obtain more information about Crispr repeats and find out whether there exist more possible repeats.
2. MATERIAL AND METHODS
First, the scientific question this study aims to explore is to identify an accurate method and tool for Crispr recognition. Therefore, this research focuses on establishing a Crispr identification model. To achieve this, the paper constructs a theoretical framework using descriptive and analytical approaches based on the conceptual understanding of Crispr. Building upon this theoretical framework, we adopt a mixed-methods model combining qualitative and quantitative elements. While the parameter determination during model training employs qualitative-like methods through parameter pairing, all other processes remain strictly quantitative. Therefore, methods include 2 parts. The theoretical basis and framework for analysis of the model (descriptive and analytical) were established. The algorithm (a mixed-methods model combining qualitative and quantitative elements) was proposed, and the algorithm flow was described. Table 1 shows several range definitions and notations of the method in this article.
2.1. Theoretical basis and framework for further analysis of the model
The sketch map of Crispr sequences is shown in Fig. (1). In Fig. (1), the dark green and light green areas represent two Crispr, the rectangle and diamond represent the repeater and spacer respectively, and STPT1, STPT2,∙∙∙,STPTm, represents the start points of the repeater respectively.
| Aspects | Notation | Default Value |
|---|---|---|
| Minimum of length of spacer | spm | 20 |
| Maximum of length of spacer | spM | 120 |
| Minimum of length of repeater | rem | 30 |
| Maximum of length of repeater | reM | 300 |
| Minimum of crossing criterion | crm | 0 |
| Maximum of crossing criterion | crM | 3.5X (mean length) |
| Maximum of isometric attribute criterion | rangediff | 10 |
| Minimum of copies of repeater | rnm | 3 |
| KNN points | nknn | 5 |
| Sequence decided by a repeater and its separating spacers | Crispr (Crispr seq) | - |
| Repeater of a Crispr sequence | repeater | - |
| Spacers of a Crispr sequence | spacer | - |
| Start point of a repeater of a Crispr sequence | STPT | - |
| Start points of repeaters of a Crispr sequence | stpt={STPT} | - |
| Start points of Crispr sequences of a genomic sequence | {stpt} | - |
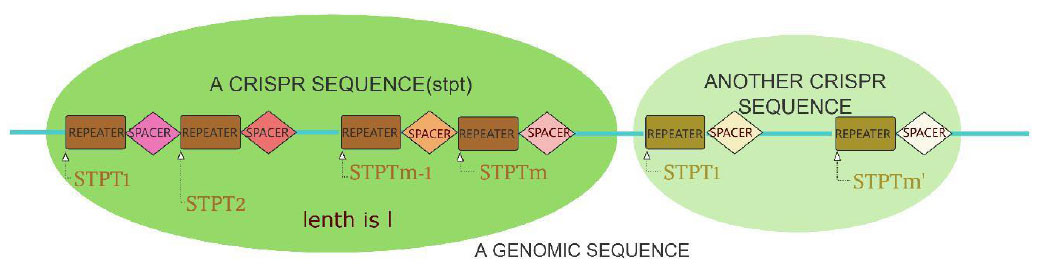
Sketch map of Crispr sequences.
2.1.1. Analysis of the proposed problem
Crisprs properties include basic location requirements viewed as primary properties and resemblance to a Crispr repeat viewed as senior properties. To screen Crispr sequences, it is divided into two categories for Crisprs properties. Crisprs properties include basic location requirements viewed as primary properties and resemblance to a Crispr repeat viewed as senior properties.
2.1.1.1. Primary Properties
Primary properties are independent of each other. The characteristic of the primary property is that once these primary properties condition is not met, the repeater sequence will be removed from the Crispr candidate list. Besides, primary properties are absolute characteristics of the repeater sequence itself and have nothing to do with other repeater sequences.
So, they are independent of each other. Crispr sequence’s locations should satisfy to the Crisprs basic requirements such as the repeater’s length section, the spacers length section, the number of repeaters copies, the similarity of repeaters and the uniqueness of spacers and so on, among which the similarity of repeaters is the foremost primary property of Crispr while the repeaters length section, the spacers length section, the number of repeaters copies, the uniqueness of spacers are subsidiary primary properties. They can be described in detail as follows.
(A) The similarity of repeaters (Foremost Primary property). The similarity of repeaters has been guaranteed by searching for complete repeats. The rule of finding complete repeats (completely identical sequences) is that repeats are sequences where the next bases of the same base are the same.
(B) The length of the spacer (Subsidiary Primary property). The length of the spacer should be between the maximum (spM) and minimum (spm). Here we set the maximum to 120 and the minimum to 20.
(C) The length of the repeater (Subsidiary Primary property). The length of the repeater should be between the maximum (reM) and minimum (rem). Here we set the maximum to 300 and the minimum to 30.
(D) The number of repeater copies (Subsidiary Primary property). The number of repeater copies should be between the maximum (rnM) and minimum (rnm). Here we set the maximum to NAN and the minimum to 3.
(E) The uniqueness of spacers (Subsidiary Primary property). The uniqueness of spacers means that spacers following repeats with different start points should be different from each other.
2.1.1.2. Senior Properties
Senior properties make up the resemblance of the sequence segments to Crispr repeaters together. The characteristic of the senior property is that if these senior properties condition is met to a greater degree, the repeater sequence will be more likely added to the Crispr candidate list. It’s remarkable that the senior property is a relative characteristic, which is reflected by comparing it with other repeater sequences. They therefore make up the resemblance of the sequence segments to Crispr repeaters together. In addition, the sequence segments with greater resemblance to Crispr repeaters are inclined to be Crispr repeaters, where the resemblance of the sequence segments to Crispr repeaters include the length of repeaters, the number of repeaters copies, the arithmetic attribute and the distance to be a Crispr repeater. They can be described in detail as follows.
(A) The length of repeaters (Senior property). The longer the length of the repeaters is, the greater the resemblance of the sequence segments to Crispr repeaters is.
(B) The number of repeaters copies (Senior property). The larger the number of repeaters copies is, the greater the resemblance of the sequence segments to Crispr repeaters is.
(C) The arithmetic attribute (Senior property). All the start points of repeaters should be arithmetic sequences in an ideal condition. The greater the arithmetic attribute is, the greater the resemblance of the sequence segments to Crispr repeaters is.
(D) The distance to be a Crispr repeater (Senior property). The shorter the distance to be a Crispr repeater is, the greater the resemblance of the sequence segments to Crispr repeaters is.
Because they are relative, this involves taking out two sequences for comparison. There is no need to compare two sequences that do not overlap or are not likely to overlap. Criteria for judging whether two sequences overlap should be defined. The crossing criterion should be between maximum (crM) and minimum (crm). Here we set the maximum to 3.5 times of the mean length of the two repeat sequences and the minimum to 0. Judging the value of the isometric attribute that start points of repeater sequences are an arithmetic sequence. At some time, the value of the attribute is too large so that the repeater sequences should not appear in the candidate list. This is like a primary property. Based on this, the isometric attribute standard should be defined. The isometric criterion should be between maximum (rangediff) and minimum (/). Here we set the maximum to 10 and the minimum to 0. However, considering that in Crispr sequences, because of one or two or a small number of base mismatches (shift, loss, increase), sometimes requirements for isometric properties are not absolute, and it is not a strong criterion that must be followed. Based on this, they should be regarded as relatively senior property.
The so-called k-nearest neighbor algorithm is that given a training data set, for a new input instance, find K instances closest to the instance in the training data set [24, 25]. Most of these K instances belong to a certain class, so the input instances are classified into this class. KNN (k-nearest neighbor) algorithm is also used to pick up the sequences that belong to the Crispr repeat group in calculating the distance to be a Crispr repeater. The algorithm requires the number of KNN points to be defined. The number of KNN points nknn should be between the maximum (total number of all known points) and minimum (0). Here we set the default value to 5. Because the four senior properties make up resemblance to Crispr repeaters together, it is reasonable to establish a comprehensive scoring method of four characteristics.
2.2. Dataset
The complete gene sequences of 302 archaea were downloaded from the National Center for Biotechnology Information (NCBI) database in March 2020 (Supplementary File 1). The samples used in this study comprised all archaea available in the database at the time of data acquisition. This sampling strategy was adopted because Crispr systems are most widely distributed among archaea, while also referencing the sample size employed during the development of the pilerCR method. According to the description of the sequence data of archaea in NCBI’s FTP on May 22nd, 2025, there are 5626 pieces of sequence data (ftp://ftp.ncbi.nlm.nih.gov/genomes/ ASSEMBLY_REPORTS/assembly_summary_genbank.txt).
According to the “assembly_level”, it can be divided into four types: Chromosome, Complete Genome, Contig, and Scaffold, in which the Complete Genome is completely closed and spliced without gap; However, the Chromosome genome is assembled to the chromosome level, but it may contain a few unlocated fragments or small gaps (GAPs). The Scaffold group is assembled into a plurality of Scaffolds with unknown gaps; Contig (contig level) genome is assembled into discontinuous short fragments (Contigs), and there are a lot of unknown gaps between fragments. That is to say, there are gaps in the sequences with “assembly_level” of Chromosome, Contig, and Scaffold, but only Complete Genome has no gaps [26-29]. Because the Crispr of the sequence we are looking for is directly related to the base arrangement order in the sequence, in order to ensure the accuracy of the data, we select the sequence data with the “assembly_level” of Complete Genome. By May 22nd, 2025, there will be 400 sequences available for download. Because the sequence data in the database have been added, deleted, and revised with time, 273 of the 302-sequence data used in this study remain unchanged, so it can be approximately considered that the data used is effective, generalizable, and time-free, and will not change due to the newly discovered or revised sequences. Two ways were used to deal with the influence of sample size on our research. The first is to analyze the data source, and apply our model tool to more than 400 archaea genome sequences, 169 randomly selected bacterial genome sequences, and 26 archaea chromosome gene sequences, besides 302 gene data to verify the accuracy of the identified Crispr. Secondly, the number of copies, length, length of spacer, and number of Crispr of repeater calculated by our tools on the above data are compared with the results of pilerCR (control group) using Welch’s t-test [30, 31].
2.3. Feature extraction and Machine learning methods
The purpose of this study is to find Crisprs from a given gene sequence S with length n, noted as Sn. Assume that there is a Crispr repeater has a length of l and a copy count of m. The start points of repeaters in this Crispr, that is, the location of Crispr repeaters on the complete genomic sequence is STPT1, STPT2,∙∙∙, STPTm, STPT1, STPT2,∙∙∙ ,STPTm constitute a set, noted as stpt in Fig. (1).
|
stpt={STPT1, STPT2,∙∙∙,STPTm}; l=length of repeater decided by stpt; m= the copies of STPT in stpt |
(1) |
Because repeat are sequences that the next base of the same base is the same, the index of the same base and the same base sequences can be given by recursion. In this way, we obtain all absolute repeats based on alignment. stpt is calculated by finding absolute repeat sequences. Our next goal is stated as judgment on Problem A for ease of expression.
Problem A: Whether an absolute repeat would appear in the Crispr result list of our method or not.
For an absolute repeat, we can certainly judge the problem stated below.
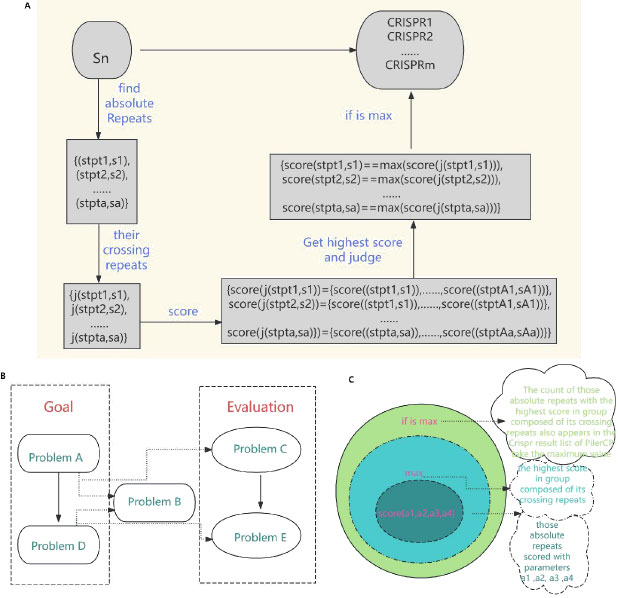
Diagram of our method about problems transformation. A. The processing path of transforming Problem A into Problem D. B. The transformation of our objectives and evaluation, from Problem A to Problem E. C. The computational layers of the goal of our model maxQ(α1, α2,α3, α4).
Problem B: Whether an absolute repeat appears in the Crispr result list of pilerCR.
Similarly, our assessment of the correctness of our method is stated as a judgment on Problem C, or judgment on the consistency of Problems A and B.
Problem C: Whether an absolute repeat appears or does not appear in the Crispr result list of both our method and pilerCR together.
Through the processing path shown in Fig. (2A), we turned the goal problem into the judgment on Problem D.
Problem D: Whether an absolute repeat scored with parameters get the highest score in a group composed of its crossing repeats. Therefore, the evaluation of the correctness of our method is transformed into the judgement on the consistency of Problem Band D, or stated as below, Problem E.
Problem E: Whether an absolute repeat scored with parameters get the highest score in a group composed of its crossing repeats coincides with this absolute repeat appearing in the Crispr result list of pilerCR. The transformation of our objectives and evaluation is shown in the Fig. (2B). As can be seen from Fig. (2A), our goal has changed from Problem A to Problem D; As can be seen from Fig. (2B), our goals are Problem A and Problem D. By virtue of Problem B, the bridge between goals and evaluation is built, and thus Problem C and Problem E appear. From Fig. (2C), we can see that the computational layers of the mathematical expression max Q(α1, α2, α3, α4) of the Problem E. Scoring those absolute repeats with parameters a1, a2, a3, a4 is the innermost layer. Calculating the highest score in a group composed of its crossing repeats is the middle layer. And the outermost layer is judging whether the count of those absolute repeats with the highest score in a group composed of its crossing repeats, also in the Crispr result list of pilerCR takes the maximum value.
With the above analysis of the model and Crispr properties, we use the following scoring method.
We creatively introduce a concept of KNN distance to be a Crispr repeater, noted as dis, is the total distance from a sequence to the reference sequences among the K neighbors mentioned above.
| dis = KNN distance to be a Crispr repeater; |
The reference sequences include the ’repeater’ sequences and ’non repeater’ sequences. The ’repeater’ sequences were known repeats [32], and the ’non repeater’ data were simply constituted using AAAAA or GGGGG, and so on (Supplementary File 2). Represent the sequences, such as S, with arrays such as AR of dimensionality of 60 as follows. Here, R takes values of A, G, C, T, AA, AG, AC, AT, GA, GG, GC, GT, CA, CG, CC, CT, TA, TG, TC, TT. Then, AR=[


 in which
  is defined in the study by Li et al. [33].
Under this representation of reference sequences (Supplementary File 3), the ’repeater’ sequences and ’non repeater’ sequences can be well separated on the whole and in 20 three-dimensional vector spaces (Supplementary File 4 A-T). In Supplementary File 4 A-T, the blue and yellow dots represent known ’repeater’ sequences and ’non repeater’ sequences respectively, with 3 dimensions separately representing number, average number, variance of A, G, C, T, AA, AG, AC, AT, GA, GG, GC, GT, CA, CG, CC, CT, TA, TG, TC, TT. The smaller the value of KNN distance to be a Crispr repeater dis, the more it resembles the Crispr repeats. Similarly, we introduce a concept of location attribute, noted as Attri (stpt), to characterize whether these starting points meet the most basic (the most basic but also the most stringent) location requirements (i.e., the length of repeat segments should be equal, and the length of blank segments should be equal). Its formulation is as below. For a start points set stpt with m start points,
{STPT1, STPT2,∙∙∙,STPTm} should be an arithmetic sequence. One extreme scenario is, Attri (stpt) = 0. This shows that {STPT1, STPT2,∙∙∙,STPTm} is an arithmetic sequence. That is, repeaters and spacers of the sequence segment with a start point set stpt are the same respectively. The sequence segment is therefore satisfying to the locationrequirement to the greatest extent. On the contrary, if Attri (stpt) is a very large number, it is likely that the conditions will not be met for the sequence segment. The smaller the value of the isometric attribute Attri (stpt), the more it resembles the Crispr repeats. Finally, for a sequence segment with a start point set of stpt, we use score (stpt) to characterize the degree of satisfaction of a sequence segment to be a Crispr repeat. From the analysis above, it’s can be easily seen that
|
score(stpt) ∝- Attri(stpt), score(stpt) ∝-dis score(stpt) ∝m, score(stpt)∝ l |
Then we have reasons to believe and assume that
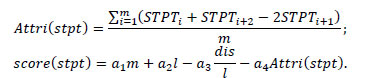 |
The formula α1m + α2l - α3
 - α4 Attri with parameters (α1, α2, α3, α4) (stpt) can be used for comparison of the resemblance to Crispr repeaters after screening based on primary properties(basic location requirements)in the process of identification of Crisprs. Among which (α1, α2, α3, α4) is a positive rational number pair. We view m l, -
, - Attri(stpt) as four features of an absolute repeat.
- α4 Attri with parameters (α1, α2, α3, α4) (stpt) can be used for comparison of the resemblance to Crispr repeaters after screening based on primary properties(basic location requirements)in the process of identification of Crisprs. Among which (α1, α2, α3, α4) is a positive rational number pair. We view m l, -
, - Attri(stpt) as four features of an absolute repeat.
2.4. Run Models
With the above analysis of the model and scoring method, the goal of our model is stated as below. The count of those absolute repeats scored with parameters α1, α2, α3, α4 get the highest score in a group composed of its crossing repeats, also appears in the Crispr result list of pilerCR take the maximum value. And this count takes α1, α2, α3, α4 as parameters. It is thus noted as Q(α1, α2, α3, α4). Therefore, the goal is equivalent to
| maxQ(α1, α2, α3, α4) |
It can be seen from Fig. (2C) that Q (a1, a2, a3, a4) is not a simple linear combination of four features of an absolute repeat.
The direct data used for model training is the absolute repeat obtained after the processing of the 302 archaea genomic sequences. The features used for model training are the four features of absolute repeats m l, -
, - Attri(stpt). Adjustment of parameters of model training is adjusting one parameter to five different values 0.1,0.9,1,1.1,3 respectively, and fixing the other three parameters with α1 = 1 remain unchanged. The training strategy is maxQ(α1, α2, α3, α4).
After many times of different times (α1, α2, α3, α4) values assignment, we finally got the best a1, a2, a3, a4 assembly is (1,1,1,1). Therefore, its formulation is as below. score (stpt) = a1m + a2l - a3
- a4Attri ( stpt). From this formula, we can see that the score is positively related to the length of repeaters and the number of repeaters copies, but negatively related to the isometric attribute and the distance to be a Crispr repeater. α1, α2, α3, α4 = 1 show that the length of repeaters and the number of repeaters copies, as well as the isometric attribute and the distance to be a Crispr repeater, have the same weight or contribution rate on the final score.
The screening process after finding the absolute repeats is designed as the following steps. To start the next filtering, we begin with step1.
step1: Build a new start points set {newstpt}. To start the next screening, we first build a new start points set {newstpt} tostore start points sets that meet all conditions to be an acceptable Crispr repeat in {stpt} = {stpt1, stpt2, ∙∙∙, stptc}.
step2: Judge whether stpt is not the last string in set {stpt}, if not, terminate the program, else, go to the next step. To find all start points sets that meet all conditions to be an acceptable Crispr repeat in {stpt} and store them into {newstpt}, we have to start a cycle to pick up start points set from set {stpt} one by one. This step is to determine the condition of the loop. If it is already the last set of start points, the loop will be terminated. If it is not the last set of start points, start filtering.
step 3: Pick up one {stpt}, go to next step. To start the next filtering, we firstly pick up one stpt in set {stpt}.
step 4: Judge whether or not all STPT in stpt satisfy reM ≤ | STPT 1-STPT2|≤ reM. If yes, go to the next step, else, go to step2.
This step is to check whether stpt meets the requirements of Subsidiary Primary property: the length of the repeater.
step 5: Judge whether or not the length of all space of s, are all satisfying spm ≤ len(space)≤ spM. If yes, go to next step, else, go to step2. This step is to check whether it stpt meets the requirements of Subsidiary Primary property: the length of spacer.
step 6: Judge whether for any spacers of s, they are different from each other. If yes, go to next step, else, go to step2. This step is to check whether it stpt meets the requirements of Subsidiary Primary property: the uniqueness of spacers.
step 7: Judge whether there is stpt1 in {stpt} besides stpt, and related s1, STPTs are in stpt, STPTs1 in stpt 1, satisfying crm ≤| STPTs1-STPTs |≤ crM. If yes, go to next step, else, go to step11. This step is to judge whether other s1 overlappingwith s besides s. This step is to traverse all the elements in the set {stpt} to judge one by one. If there is no sequence crossing with s, s will be in the Crispr candidate list.
step 8: Put stpt1 into a subset {stpt}, go to next step.
This step is to pick out all other sequences overlapping with stpt besides stpt and put them into a new set {stpt 11}.
step 9: Calculate the score of stpt and related s, calculate scores of stpt and stpt1 and s1 in subset {stpt11}, go to next step.
This step is to calculate the score of the other sequence s1 in {stpt 11} (sequences overlapping with s).
step 10: Judge whether there is stpt1 in {stpt11}, satisfying score(stpt) < score(stpt1). If not, go to next step, else, go to step2. This step is to judge whether there is other sequence s1 in {stpt11} (sequences overlapping with s) with a higher score than s. If there is other sequence s1 in {stpt11} (sequences overlapping with s) with a higher score than s, it shows that s is not in the Crispr candidate list.
step 11: Put stpt into {newstpt}, go to step2.
This shows that s is in the Crispr candidate list, so the start points of s are put into {newstpt}. These steps were drawn in flow chart in Fig. (3).
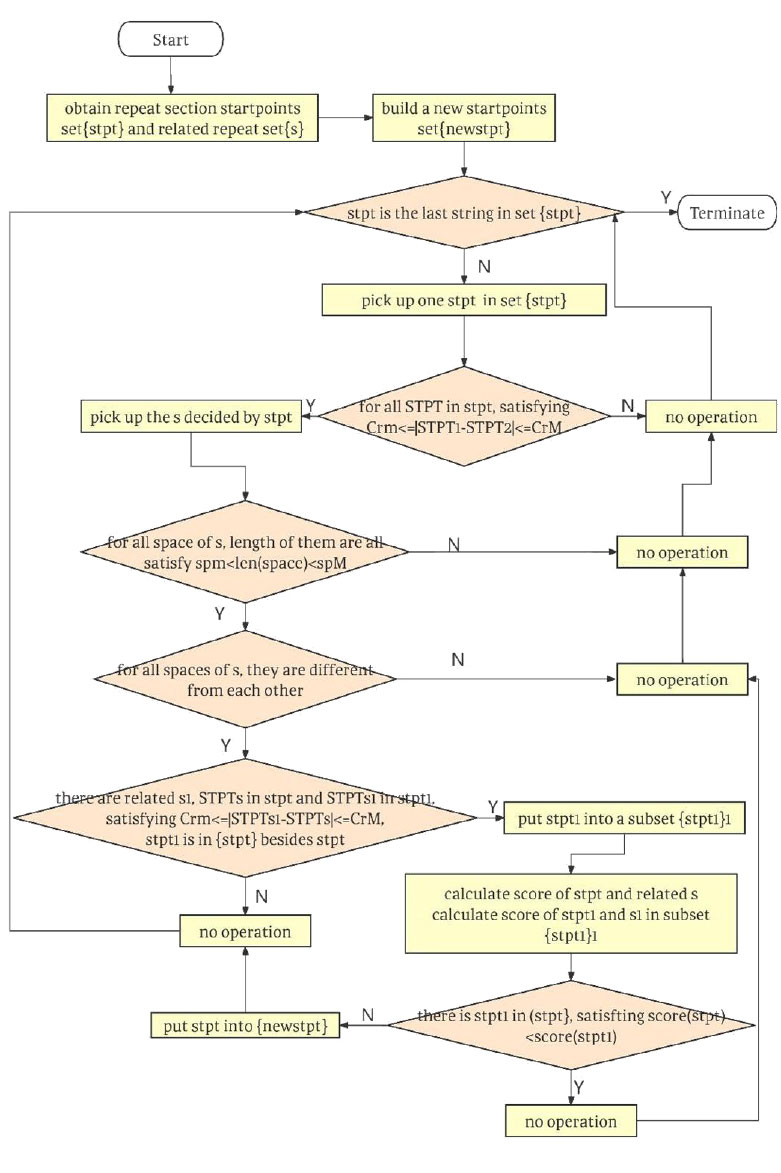
Flow chart of the algorithm.
The formula score (stpt) = α1m + α2 l, - α3
, - α4Attri(stpt). with parameters (1,1,1,1), that is, score (stpt) = m + l-
-Attri (stpt). is a good choice for comparison of the resemblance to Crispr repeaters after screening based on primary properties (basic location requirements)in the process of identification of Crisprs. Our algorithm is written in Python and named findCrispr.
The tool findCrispr and a sequence file for testing can be found on the website https://github.com/ganymedesm/findCrispr. git. The usage of the program is as follows. Put the sequence data to be analyzed into a separate directory, which only supports “fna” suffix sequence file; Type the address of the directory, and the program will automatically start analyzing. Three files are obtained after the analysis. File with “result!_” at the beginning of filename: indicates the Crisprs containing score information found by findCrispr. Each line represents a Crispr, includes the starting position of the repeater followed by “, “, “#####”, score,”:”, repeater sequence, “@”, the copy count of repeater sequence, “$”, the length of repeater sequence, “__”, the spacer sequences separated by “". File with “-show.txt”at the end of filename: indicates that the Crisprs found by findCrispr are displayed in a more readable format. All Crisprs are marked with Crispr1, Crispr2, ... And Crispr1, for example, is marked with the starting position, sequences, and lengths of the repeaters and spacers. The “png” image file: indicates that the Crisprs found by findCrispr are displayed in pictures. A rectangle and a diamond represent a Crispr. The number +”X” marked on the top of the rectangle represents the number of copies of the repeater. The number on the left of the rectangle represents the length of the repeater sequence. The number below the rectangle represents the starting position of the Crispr. The number on the right of the diamond represents the ending position of the Crispr The rectangle and diamond of each Crispr are represented by different colors and connected by a straight line according to their orders in the gene sequences.
3. RESULT AND DISCUSSION
3.1. Performance Advantages Compared with Existing Tools
The evaluation of the model of our algorithm is mainly based on the comparison with pilerCR. The results of Crisprs obtained from find Crispr and pilerCR can be found in Supplementary Files 5 and 6. The data used in the evaluation is 302 archaea genomic sequences. All results are reviewed by manual curation. The total results from our method findCrispr and pilerCR on 302 archaea sequences, and the total results from our method compared with pilerCR (Supplementary File 7).
suggest that the overwhelming large majority of results of 302 archaea is that the algorithm finds more Crispr repeats than pilerCR, while the minority is that the algorithm finds fewer Crispr repeats. Among 302 archaea, 199 obtained the same results as pilerCR using our algorithm; 86 obtained more Crisprs than pilerCR; and 17 obtained fewer Crisprs than pilerCR. The numbers of repeaters of all archaea are obtained after running program of the algorithm (findCrispr) and pilerCR.
3.1.1. The Algorithm is Inclined to Find more Repeaters
Crispr analysis of the complete genome of 302 archaea with our algorithm and detailed Crispr analysis of the complete genome of 302 archaea with our algorithm comparing with pilerCR shows that the algorithm is inclined to find more repeaters. For example, for Methanothermobacter thermautotrophicus str. Delta H, both methods obtained three Crisprs (Fig. 4A, A'); although one of the small duplicate copies is not the same, the length and number of copies of the other two are the same with pilerCR. For Archaeoglobus fulgidus DSM 4304, both obtained three Crisprs (Fig. 4B, B'); except that one of the repeats is slightly shorter in length, the rest are the same. For Aeropyrum pernix K1 DNA, both obtained three Crisprs (Fig. 4C, C'); except that one of the repeats is shorter in length, the rest are the same with pilerCR. For Methanosphaera sp. BMS, if the other ones are not considered Crispr due to the too long spacer (within a reasonable range), at least 2, 11, 6, 10, 17, 19, 23, 24, 26 can be regarded as Crisprs with small duplicate numbers (Fig. 4D), while no Crispr was identified by pilerCR. For Candidatus Nitrosocosmicus exaquarestrain G61 chromosome, if the other ones are not considered Crispr due to the too long spacer (within a reasonable range), at least, 2, 4, 7, 10, 12, 8, 16, 17 can be regarded as Crisprs with small duplicate number (Fig. 4E, E'). For Methanoplanus limicolaDSM 2279 chromosome, if the other ones are not considered Crispr due to the too long spacer (within a reasonable range), at least 1, 2, 3, 6, 11, 12, 13, 19 can be regarded as Crisprs with small duplicate number (Fig. 4F), while no Crispr was identified by pilerCR. The algorithm is an accurate identification of repeats and Crispr repeaters. As a result, the algorithm can be used as an effective tool to find Crispr repeats, supplemental to pilerCR and Crisprfinder. It can be visualized and has stronger expansibility. The tool output shows Crispr report file and a visual picture file, which is clear and easy to read. Written in Python language, Crispr and statistical Crispr can be displayed in different ways.
3.1.2. The Algorithm is a Very Special Algorithm in Finding Crispr.
Taking the existing software pilerCR as an example, its algorithm and program are not independent. Our algorithm is a very special algorithm as its original intention was based on the most fundamental characteristics of Crispr. Our analysis of Crispr’s properties is complete as it’s not only an analysis of sequence characteristics, but also a general analysis of classification and object relevance in a philosophical sense. Our comparison of scoring fits the Crispr property very well.
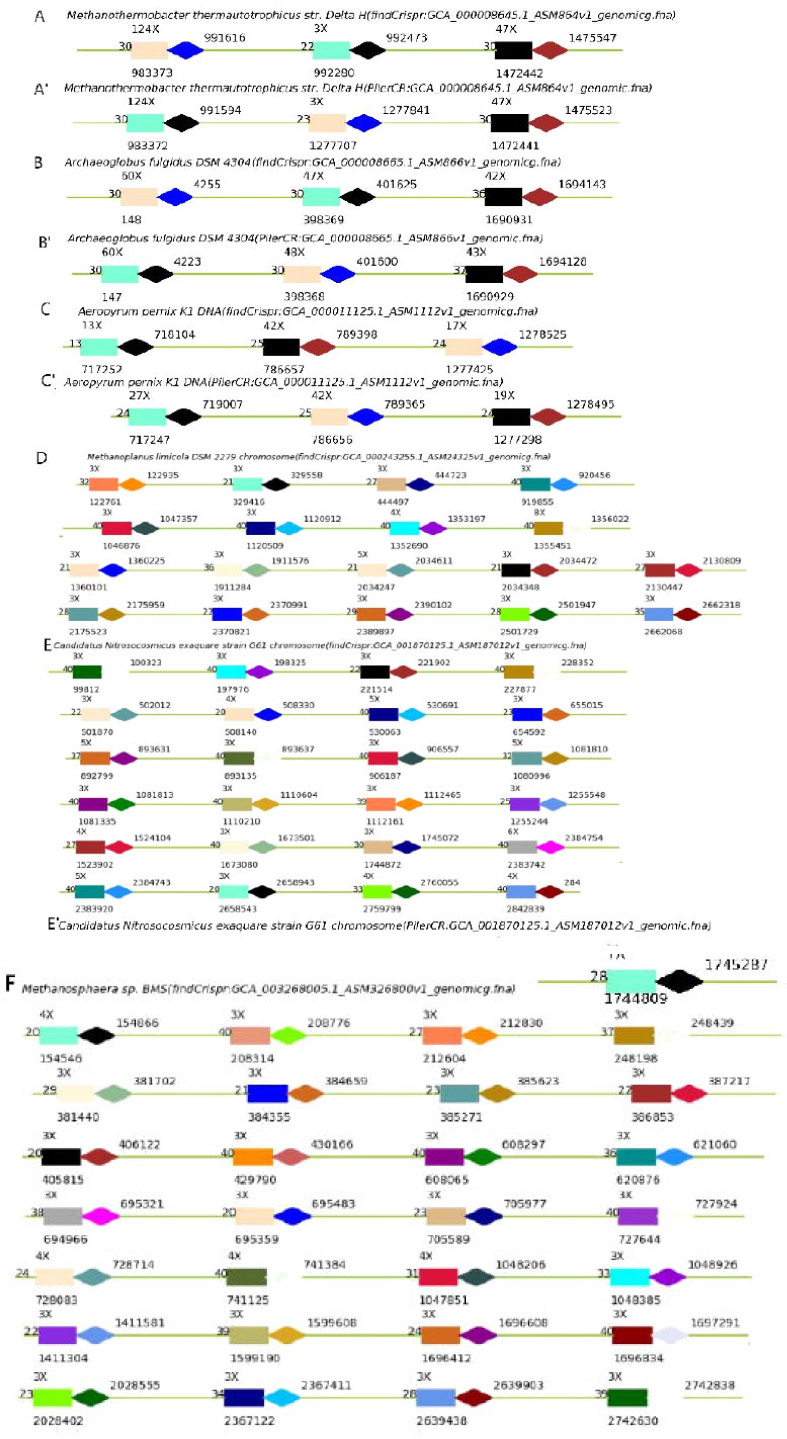
Diagram of some example results of findCrispr obtaining more Crisprs than pilerCR. A. Crisprs got by find Crispr in Methanothermobacter thermautotrophicus str. Delta H; A' Crisprs got by pilerCR in Methanothermobacter thermautotrophicus str. Delta H; B. Crisprs got by findCrispr in Archaeoglobus fulgidus DSM 4304; B'. Crisprs got by pilerCR in Archaeoglobus fulgidus DSM 4304; C. Crisprs got by findCrispr in Aeropyrum pernix K1 DNA; C'. Crisprs got by pilerCR in Aeropyrum pernix K1 DNA; D. Crisprs got by findCrispr in Methanoplanus limicola DSM 2279 chromosome; E. Crisprs got by findCrispr in Candidatus Nitrosocosmicus exaquare strain G61 chromosom; E'. Crisprs got by pilerCR in Candidatus Nitrosocosmicus exaquare strain G61 chromosom; F. Crisprs got by findCrispr in Methanosphaera sp. BMS.
3.1.3. The Algorithm is Low in Tolerance for Long Scattered Repeats
The fact that long scattered repeats will be deleted in the initial screening stands a good chance. But this kind of sequence can be adjusted and improved in the later version to eliminate this problem.
3.1.4. The Algorithm is Sensitive in Finding Crispr with Small Duplicate Number
In this way, many new Crispr sequences may be found. The new Crispr sequence means many new immune mechanisms, Crispr associated proteins, gene editing methods, and gene editing tools. Moreover, the research on the function of Crispr with a small duplicate number and the study of evolutionary origin have far-reaching and important significance. Nowadays, the main Crispr recognition tools are pilerCR and Crisprfinder. For biologists, many discoveries from data mining rely heavily on these tools. And inventing a good algorithm essentially makes new discovery possible.
3.2. Outlier Detection
After reviewing and comparing all the results with the results of pilerCR one by one, we found that for some sequences, the number of Crisprs found by findCrispr was inconsistent with pilerCR. For Pyrobaculum islandicum DSM 4184, findCrispr got two (Fig. 5A) but pilerCR got six (Fig. 5A'); among the six Crispr obtained by pilerCR, Crispr2, 3, 4 have the same repeater, Crispr 1, 5, 6 have the same repeater; this is because our algorithm thinks that those with the same repeater will be regarded as scattered repeats and will be eliminated if they do not meet the position requirements; in addition, other Crispr are basically consistent. For Methanocaldococcus infernus ME, findCrispr got 5 (Fig. 5B) and pilerCR got 15 (Fig. 5B'); among the 15 Crispr obtained by pilerCR, Crispr7, 9, 10, 14 have the same repeater, Crispr11, 12, 13 have the same repeater, Crispr1 and 15 have the same repeater; this is because those with the same repeater will be regarded as scattered repeats and will be eliminated if they do not meet the position requirements in our algorithm. Data on which the algorithm obtains more or the same Crispr than pilerCR with the maximal pvalue are as follows. For Thermofilum adornatus 1505 chromosome, findCrispr got 2 (Fig. 5C) but pilerCR got 9 (Fig. 5C'); among the 9 Crisprs obtained by pilerCR, Crispr4, 5, 7 have the same repeater, Crispr2, 3, 6, 8 are rejected because they are considered to belong to longer scattered repeats but do not meet the location requirements;in addition, other Crisprs are basically consistent. For sequences of Thermococcus thioreducens strain OGL-20P (Fig. 5D, D'), Thermococcus sp. SY113 chromosome (Fig. 5E, E') Sulfolobus solfataricus strain P1 genome assembly (Fig. 5F, F'), Methanothermobacter wolfeii isolate SIV6 genome assembly (Fig. 5G, G'), the results of Crisprs got by findCrispr are basically consistent with pilerCR, except that some of them are considered as scattered repetitive sequences in our algorithm.
3.3. Feature Extraction System Based on Crispr Concept Theory
According to the concept of Crispr, Crispr is a special gene sequence formed by separating almost identical repeaters by different spacers, in which spacers and repeaters meet certain length requirements respectively, with the typical length of spacers being 30-40 bp and the typical length of repeaters being 21-37 bp [34]; Because of the above-mentioned base arrangement characteristics, the length of repeater, the length of Spacer, the number of copies of repeater, the difference of Spacer and the similarity of repeater in Crispr meet certain requirements. In this study, the characteristics of Crispr are divided into primary attributes and secondary attributes. The primary attribute is an independent attribute of a sequence, which has nothing to do with other sequences, including the length interval of repeater, the length interval of Spacer, the copy number interval of repeater, the difference of Spacer, and the similarity of repeater. The secondary attribute is the similarity between a sequence and Crispr repeated sequence, which is related to other sequences, not independent attributes; The similarity between a sequence and Crispr repeat sequence is determined by the length of the repeater regarded as a secondary attribute, the number of copies of the repeater, the arithmetic property of the starting position of the repeater (the starting point of the repeater should be equally spaced) and the distance between the repeater and Crispr repeat sequence; There are different ways for a sequence to become a Crispr sequence, and it is necessary to compare the similarity between this sequence and the repeated Crispr sequence in different ways to determine various indexes of Crispr. The above comparison takes place under the condition that the repeater cross each other (the starting points are close). At the same time, the starting point position of repeater is initially determined based on the fact that repeater has exactly the same base sequence (repeater is absolute repetition). To sum up, the length l of the repeater, the copy number m of the repeater, the starting position sequence stpt of the repeater and the repeater sequence are used as the features of the algorithm. That is to say, based on the concept theory of Crispr, this study constructs and designs a feature extraction method. A gene sequence contains millions of bases, and the uniqueness of a gene sequence is determined by four bases in these millions of positions, so the order of magnitude of the features contained in a gene sequence is very large. Our goal is to identify Crispr from a gene sequence. Based on the concept theory of Crispr, the feature extraction method determines this effective feature from such limited features as the length l of repeater, the copy number m of repeater, the starting position sequence stpt of repeater, repeater sequence and so on, which greatly reduces the number of extracted features. The feature extraction method based on the concept theory of Crispr is determined after the deep excavation of Crispr features. Although the number of features is greatly reduced, it covers most of the information about Crispr. And the final result of the article also shows that these features are enough to accurately identify Crispr.
3.4. The Machine Learning Algorithm and Model of Crispr Recognition Based on Score
The primary attribute of Crispr is a definite index, that is, once a sequence fragment does not meet this index, it will not become Crispr. As a relative attribute, the secondary attribute of Crispr is suitable for comparing how a sequence fragment becomes Crispr under different division methods. Therefore, a machine learning algorithm of Crispr recognition based on score is proposed. The above-mentioned scoring process takes place under the condition that the starting position sequence st pt of the repeater with exactly the same base sequence is found to be similar to an arithmetic progression, and the repeaters cross each other (the starting positions are similar). The length l of different repeaters, the copy number m of repeaters, the starting position sequence stpt of repeaters, and the KNN distance between different repeater sequences and known Crispr repeat sequences are the scoring indicators. The KNN distance used refers to the average of the distances between the repeater and the five nearest known Crispr repeats and non-Crispr repeats after a sequence is represented by a 60-dimensional vector. After establishing the above scoring system, the next step of the study is the establishment and solution of the model. In this study, a model with parameters is established through problem transformation, and the objective function max Q (a1, a2, a3, a4) of the model is determined. The training set of the model uses all 302 archaea data. Model training is completed in Python language. Model training, that is, the determination of parameters, is realized by fixing three parameters and changing one parameter to five different values. Finally, the values of the four parameters are determined to be 1, 1, 1, 1. After the parameters are determined, the model is solved and the scoring formula score (stpt) m + l, -
, - Attri(stpt) is determined in response. The model performs well on 302 archaea data. 302 pieces of data are also regarded as test sets. The model algorithm in this study is more accurate. From the statistical data, 199 sequences
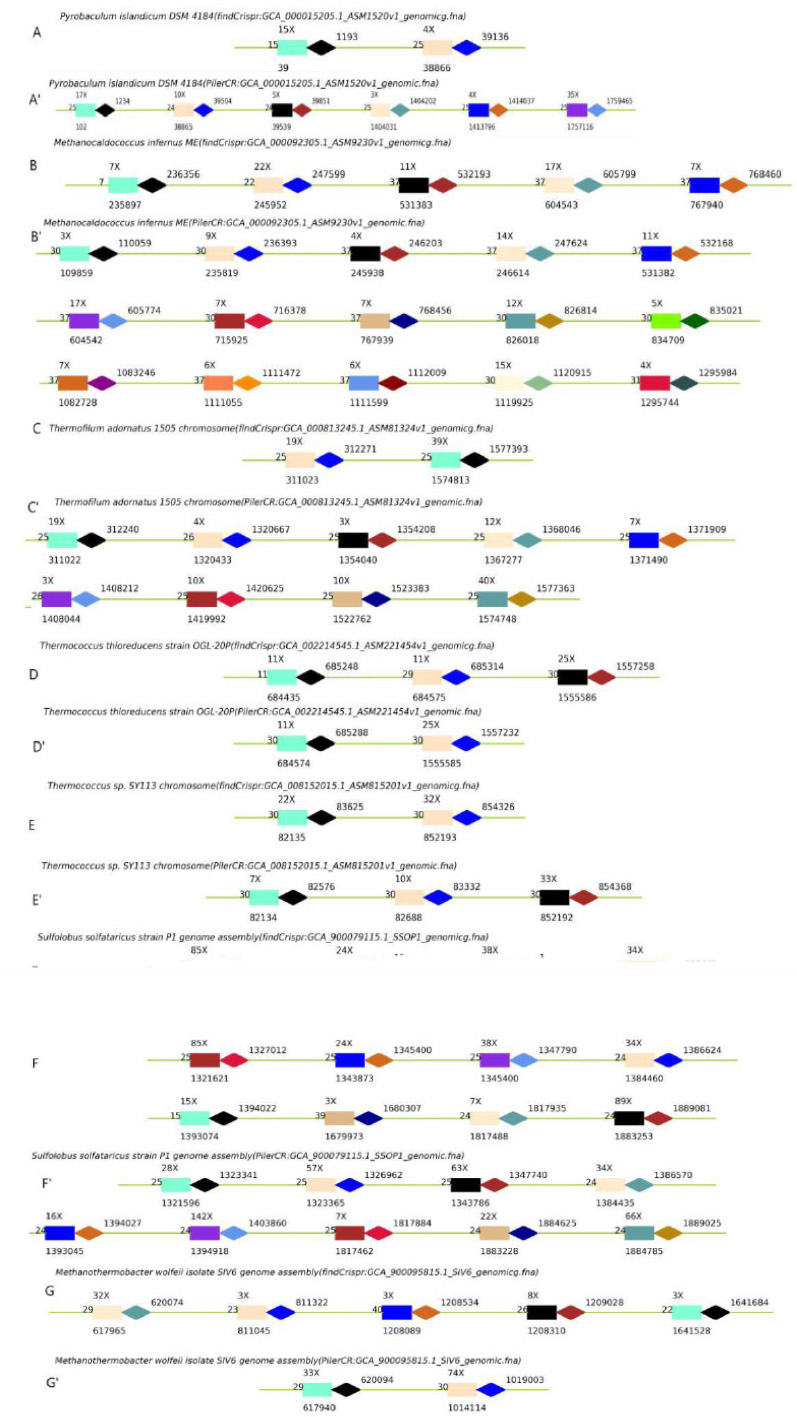
Diagram of some outlier results of findCrispr obtaining less Crisprs than pilerCR. A. Crisprs got by findCrispr in Pyrobaculum islandicum DSM 4184; A'. Crisprs got by pilerCR in Pyrobaculum islandicum DSM 4184; B. Crisprs got by findCrispr in Methanocaldococcus infernus ME; B'. Crisprs got by pilerCR in Methanocaldococcus infernus ME; C. Crisprs got by findCrispr in Thermofilum adornatus 1505 chromosome; C'. Crisprs got by pilerCR in Thermofilum adornatus 1505 chromosome; D. Crisprs got by findCrispr in Thermococcus thioreducens strain OGL-20P; D'. Crisprs got by pilerCR in Thermococcus thioreducens strain OGL-20P . E. Crisprs got by findCrispr in Thermococcus sp. SY113 chromosome; E'. Crisprs got by pilerCR in Thermococcus sp. SY113 chromosome; F. Crisprs got by findCrispr in Sulfolobus solfataricus strain P1 genome assembly; F'. Crisprs got by pilerCR in Sulfolobus solfataricus strain P1 genome assembly; G. Crisprs got by findCrispr in Methanothermobacter wolfeii isolate SIV6 genome assembly; G'. Crisprs got by pilerCR in Methanothermobacter wolfeii isolate SIV6 genome assembly.

The result of Crispr identification using tool findCrispr on Halorhabdus utahensis DSM 12940 (CP 001687. 1) gene
obtained the same results as pilerCR, 86 sequences were more than pilerCR, and 17 sequences were less than pilerCR. Taking a gene sequence such as Halorhabdus utahensis DSM 12940 (CP 001687. 1) as an example, the model algorithm in this study identified that it has 9 Crispr. The starting sites are 2859385, 1326243, 652995, 2339381, 396150, 1840677, 1840774, 2793066 and 1415805 respectively, and the length of the repeat is 21, 21, 22, 22, 24, and 24 respectively. The results of other sequences are similar. Therefore, the model algorithm in this study can accurately identify Crispr.
3.5. The Realization of the Identification Tool FindCrispr
The tool findCrispr is a tool based on the scoring-based machine learning model algorithm established and solved in this study, and implemented in Python programming language. The implementation flow of the tool is shown in Fig. 3. The basic idea of the process is that, among the absolutely repeat sequences, the sequence with overlapping starting points with the highest score is selected as Crispr. Excellent performance on 302 archaea data. From the statistical data, 199 sequences obtained the same results as pilerCR, 86 sequences were more than pilerCR, and 17 sequences were less than pilerCR. Take a gene sequence such as Halorhabdus utahensis DSM 12940 (CP 001687. 1) as an example, the tool findCrispr recognizes that it has 9 Crispr. The starting site is, the length of repeat is, the number of copies is, and the length of spacer is. The results of other sequences are similar. The tool findCrispr can successfully identify Crispr.
3.6. Outputting the Report File Showing Crisprs
The tool findCrispr is easy to use. Just enter the directory where the gene sequence data stored in “fna”
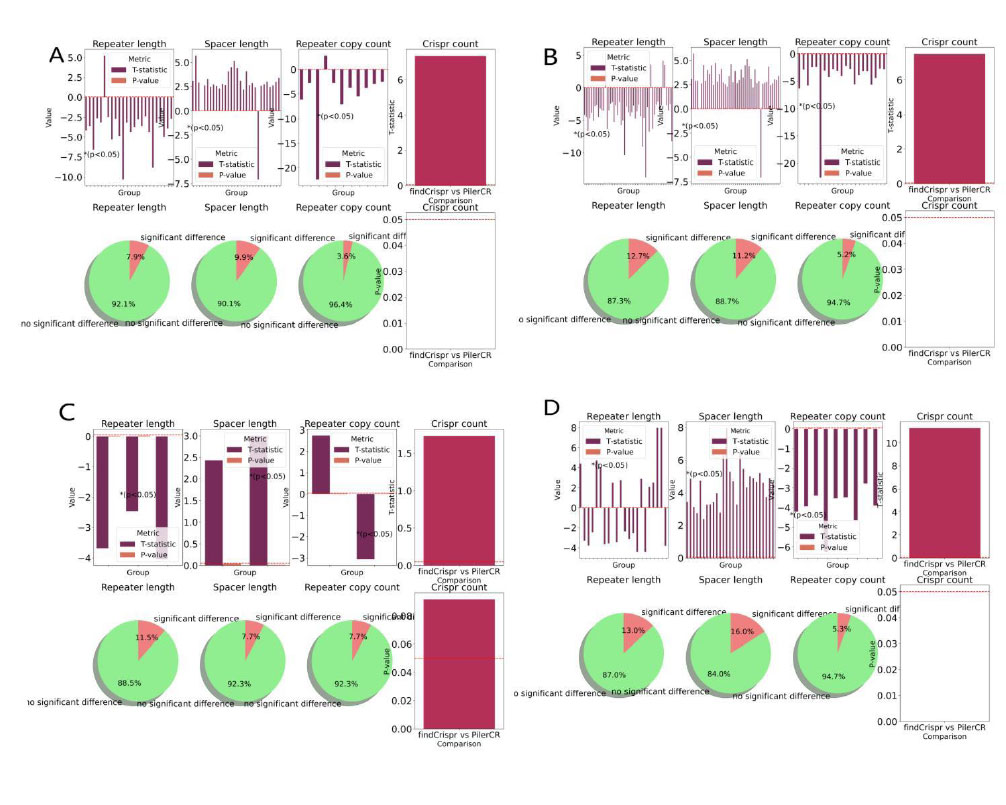
The Welch’s t-test results on genome sequences. A. The Welch’s t-test results on 302 gene sequences for training the model. B. The Welch’s t-test results on 400 archaea complete genome sequences. C. The Welch’s t-test results on 26 archaea chromosome gene sequences. D. The Welch’s t-test results on 169 bacterial genome sequences. The Welch’s t-test results above contain the value of tstat and pvalue of the sequence with repeater length pvalue<0.05, the value of tstat and pvalue of the sequence with spacer length pvalue<0.05, the value of tstat and pvalue of the sequence with repeater copy count pvalue<0.05, the value of tstat and pvalue of Crispr count, the percentages of sequences with pvalue<0.05 of repeater length, spacer length, repeater copy count, respectively.
format is located after running the tool, and the tool will automatically output the report file showing Crisprs. The tool findCrispr is easy to use, and the report file is clear and easy to read. Take a gene sequence as an example. For example, the first line of the report file shows information similar to the header, before the next blank line, it shows the information of Crispr1, the sec-ond line is marked with “Crispr1”, and every line from the third line to the first blank line starts with a number, followedby the sequence of repeater, followed by the sequence of spacer, and the length of repeater and spacer are marked at the end of the line. Taking a gene sequence such as Halorhabdus utahensis DSM 12940 (CP 001687. 1) as an example, the report file showing Crisprs (the file name ends with “-show. txt”) has labels such as Crispr1 and Crispr9. The four lines of text above Crispr2 under Crispr1 begin with numbers, which indicate that the starting site of the first repeater in Crispr1 is 2859385, and the sequence of the first repeater is “TAGCGGGAGGTGGAT TTGAAC”. The sequence of the spacer behind the first repeater is “CGCGGTCGTTCCTTCCTCCCCTTCCTTCAAAT CCGCGACAGGGAGGATGGCGGATACCCT-GCGCCGTAATT CGGGGAAA”, the length of the first repeater is 21, and the length of the spacer behind it is 105. It can be seen that the report file showing Crispr accurately shows Crispr information.
3.7. Outputting a Visual Picture File Showing Crisprs
After running the tool, enter the directory where the gene sequence data stored in “fna” format is located, and the tool will automatically output a visual picture file showing Crisprs. Picture file the tool findCrispr is simple to use, and the picture file is highly explanatory. In the visual picture file showing Crisprs, the rectangle represents repeater, the diamond represents spacer, the number on the left of the rectangle represents the length of repeater, the “number X” on the top of the rectangle represents the number of copies of repeater, the number on the bottom of the rectangle represents the starting position of repeater, and the number on the right of the diamond represents the ending position of the Crispr (Supplementary File 8). Taking a gene sequence such as Halorhabdus utahensis DSM 12940 (CP 001687. 1) as an example, in the visual picture file (Fig. 6) showing Crisprs, nine rectangular diamonds represent nine Crispr. The length of the repeater in the first Crispr1 is 24, “3X” means that the number of copies of the repeater in Crispr1 is 3, the starting position of the repeater in Crispr1 is 396150, and the ending position of Crispr1 is 396482. It can be seen that the visual image file showing Crisprs accurately shows Crispr information.
3.8. Generalizability and Statistical Results of Welch’s t-test
The results of applying the model tool to 400 archaea complete genome sequences, 169 randomly selected bacterial genome sequences and 26 archaea chromosome gene sequences besides 302 gene data are identified Crisprs to verify the accuracy. The results of Welch’s t-test on the repeater copy counts, the length of repeater, the length of spacer and the count of Crisprs calculated by findCrispr on the above data are compared with the results of pilerCR (control group) and are shown in Fig. 7 and Table 2. The Welch’s t-test results on 302 gene data, 400 archaea complete genome sequences, 26 archaea chromosome gene sequences, 169 randomly selected bacterial genome sequences are separately shown in Fig. (7A-D). In Figure A, in the data set, the four bar charts in the upper part respectively represent the tstat value and pvalue value of the sequence with pvalue<0.05 of repeater length; Tstat value and pvalue value of sequences with spacer length pvalue<0.05; The tstat value and pvalue<0.05 value of the sequence with the number of copies of repeater < 0.05; Tstat value of Crisor number; The three pie charts in the lower part respectively show the proportions of sequences with repeater length of pvalue<0.05 (significant difference, red) and pvalue>=0.05 (insignificant difference, green), and the last column chart represents the pvalue of Crispr number.
In Fig. (7A), in the data set of 302 gene data for training the model, the four bar charts in the upper part respectively represent the value of tstat and P-value of the sequence with repeater length P-value<0.05; The value of tstat and pvalue of sequences with spacer length P-value<0.05; The value of tstat and pvalue of the sequence with the number of copies of repeater P-value<0.05; Tstat value of Crisor number; The three pie charts in the lower part respectively show the proportions of sequences with repeater length of P-value<0.05 (significant difference, red) and P-value>=0.05 (no significant difference, green), and the last column chart represents the pvalue of Crispr number. Fig. (7B-D) are the results above on the data set of 400 archaea complete genome sequences, 26 archaea chromosome gene sequences, 169 bacterial genome sequences respectively.
| Comparison (findCrispr vs PilerCR) | T-statistic | P-value | Significance |
|---|---|---|---|
| 302 gene data for training the model | 7.354546 | 1.226292e-12 | True |
| 400 archaea complete genome sequences | 7.500877 | 3.020874e-13 | True |
| 26 archaea chromosome gene sequences | 1.734823 | 0.091742 | False |
| 169 bacterial genome sequences | 11.280271 | 1.355567e-22 | True |
From the results on 302 gene data for training the model, 400 archaea complete genome sequences, 169 bacterial genome sequences, although the count of Crisprs recognized by the tools findCrispr is significantly different with tstat>0, it shows that the tools findCrispr can identify more Crisprs. There is no significant difference in the number of Crispr recognized on 26 archaea chromosome gene sequences. For the count of repeater copies, the length of repeater and the length of spacer, the proportion of no significant difference in each type of data accounts for more than 85 percent, which shows that the tool findCrispr maintains robust correctness in each type of data.
4. STUDY LIMITATIONS
The proposed model and algorithm in this study have several limitations:
4.1. Parameter Optimization
During training, fixed parameters were assigned specific values, and alternative parameters were explored using a qualitative-like optimization approach, which may not guarantee global optimality.
4.2. Model Linearity Assumption
The model employs a linear framework for the four selected features, without investigating whether nonlinear relationships could improve prediction accuracy.
Evaluation was restricted to comparison with pilerCR, the current most widely used tool. While our model outperformed pilerCR in recognition performance, the study did not explore whether further optimization could yield even better solutions. The model algorithm in this study is more accurate, but the identification process takes more time. Optimization of program code is a direction. Therefore, it is necessary to use more efficient computers and time to process data.
CONCLUSION
In this study, we established a score-based machine learning method to identify Crispr4 from prokaryotic gene sequences. Specifically, the characteristics of Crispr are divided into primary attributes and secondary attributes, and a feature extraction system based on Crispr concept theory is established. Taking the length l of different repeaters, the copy number m of repeaters, and the starting position sequence stpt of repeaters, and the KNN distance between different repeater sequences and known Crispr repetitive sequences as scoring indexes, a machine learning algorithm for Crispr recognition based on scoring is established. Through training, the model with four parameters whose objective function is MaxQ is solved, and Python programming is completed, and the realization of the Crispr identification tool findCrispr is completed. The tool findCrispr can output report files and visual picture files showing Crispr. The data used in this study is archaea sequence data. The length l of repeater, the copy number m of the repeater, and the starting position sequence stpt of repeater, repeater sequence, and so on are extracted as features. A scoring system based on score (stpt) α1m + α2l - α3
, α4-Attri(stpt) formula is established, and a recognition tool findCrispr is realized. The tool findCrispr is superior to the commonly used Crispr analysis software pilerCR in the identification of archaea Crispr, which is more sensitive to the repeater with multiple calibration, and so on. Therefore, the algorithm and tool findCrispr in this study can accurately identify Crisprs.
The tool findCrispr, the model and tool of this study, is of great significance for studying the biological function and mechanism of Crispr. (1) As an adaptive immune system of bacteria and archaea, Crispr can capture and store foreign nucleic acids and use related proteins to achieve immunity to foreign nucleic acids. The biological function of Crispr system can be divided into three stages: Adaptation (Spacer Acquisition), Expression (crRNA Biogenesis), and Interference (Target Cleavage). Pre-crRNA (precursor crRNA, including multiple repeaters and spacers) of Crispr array needs to be processed into crRNA (including stem-loop formed by a single spacer and some repeaters) by Cas protein (such as Cas6 of I/III system) or RNase III (type II system), so as to guide Cas protein to target the cleavage of foreign nucleic acids. TracrRNA (trans-activated Crispr RNA, containing a stem loop and repetitive sequence binding region) and the repetitive sequence of pre-crRNA complement each other to mediate its processing and stabilize Cas9-crRNA complex. Accurate identification of Crispr and its repeat and spacer sequences is of great significance for exploring the biological mechanism of Crispr adaptive immune system. For example, knowing the spacer sequence of crRNA can help us to know the foreign nucleic acid sequence that can be targeted for cleavage, knowing the repeater of pre-crRNA can help us to know the binding region between tracrRNA and repeater, and knowing the repeater of crRNA can help us to know the stem-loop of crRNA. In addition, accurate identification of Crispr and its repeat and spacer sequences are also beneficial to understand the biological evolution significance of repeat and spacer [35-37]. (2) Because of the biological mechanism, Crispr has many functions, such as gene therapy to repair mutant genes, RNA editing, regulation of Cas protein activity to achieve gene expression regulation, targeted clearance to achieve immune defense, and so on. Accurate identification of Crispr and its sequence and location provides data support for accurate prediction of gene therapy, gene editing, gene expression regulation and targeted clearance [38-40]. (3) The Crispr/Cas system is divided into two types: class1 and class2 and seven types: TYPE I, II, III, IV, V, VI, and VII. Class1 (TYPE I, III, IV, VII) has a protein complex and class2 (TYPE II, V, VI) has a single-effect protein, both of which can target DNA or RNA. Among them, cas9 and cas12 target DNA and cas13 targets RNA. Accurately identifying Crispr and its initial position plays an important role in discovering more abundant Cas proteins, and can complement and improve Crispr-Cas system. The tool findCrispr, the model and tool of this study, can process prokaryotic gene sequence data in batches and accurately identify Crispr, which can be used as a powerful tool for prokaryotic macro-Crispr genomics and provide convenience for relevant researchers. The tool findCrispr uses Python as the programming language, which is very easy to use and extensible. It can identify single or multiple Crispr, and can also be expanded into a statistical analysis tool for macro data of Crispr [41-43].
AUTHORS' CONTRIBUTIONS
The author confirms sole responsibility for the following: study conception and design, data collection, analysis and interpretation of results, and manuscript preparation.
LIST OF ABBREVIATIONS
| Crisprs | Clustered Regularly Interspaced Short Palindromic Repeats |
| Cas | Crispr-Associated |
| NCBI | National Center Biotechnology Information |
| KNN | Knearest-Neighbor |
AVAILABILITY OF DATA AND MATERIALS
The program findCrispr and its testing files as well as the instruction manual are available in address https://github. com/ganymedesm/findCrispr.git.
ACKNOWLEDGEMENTS
Declared none.
SUPPLEMENTARY MATERIAL
The accession list of 302 archaea sequences is shown in supplementary File 1. The KNN distance to be a Crispr repeater, noted as dis are shown in supplementary file 2. The represented matrix data of the reference sequences is in supplementary File 3. The ’repeater’ sequences and ’non repeater’ sequences in the 3-dimensional scattered plot are shown in supplementary File 4. The total results from our method findCrispr on 302 archaea sequences are shown in supplementary File 5. The total results from pilerCR on 302 archaea sequences are shown in supplementary File 6. The total results from our method compared with pilerCR are shown in supplementary File 7. The Crisprs diagrams of the total results from our method findCrispr and pilerCR are shown in supplementary File 8.
Supplementary File 1: The accession names of 302 archaea sequences in NCBI database.
Supplementary File 2: Reference sequences of Crispr repeaters and nonrepeaters.
Supplementary File 3: The represented matrix data of the reference sequences.
Supplementary File 4: The ’repeater’ sequences and ’non repeater’ sequences represented by 60-dimension vector in the 3-dimensions scattered plot (3 dimensions *20 subplot, 3 dimensions are separately representing number, average number, variance). A, B, C, D: 3 Dimensions about A, G, C, T. E, F, G, H: 3 Dimensions about AA, AG, AC, AT. I, J, K, L: 3 Dimensions about GA, GG, GC, GT. M, N, O, P: 3 Dimensions about CA, CG, CC, CT. Q, R, S, T: 3 Dimensions about TA, TG, TC, TT. The blue and yellow dots represent known ’repeater’ sequences and ’non repeater’ sequences respectively.
Supplementary File 5: The total results of our method findCrispr on 302 archaea sequences.
Supplementary File 6: The total results of pilerCR on 302 archaea sequences.
Supplementary File 7: The total results of our method findCrispr comparing with pilerCR.
Supplementary File 8: Crispr maps of the total results obtained from our method findCrispr and pilerCR.
Supplementary material is available on the publisher's website along with the published article.

