
Iris Recognition based on Statistically Bound Spatial Domain Zero Crossing and Neural Networks
Authors Info & Affiliations
Abstract
Purpose
The iris pattern is an important biological feature of the human body. The recognition of an individual based on an iris pattern is gaining more popularity due to the uniqueness of the pattern among the people. Iris recognition systems have received attention very much due to their rich iris texture which gives robust standards for identifying individuals. Notwithstanding this, there are several challenges in unrestricted recognition environments.
Methods
This article discusses a highly error-resistant technique to implement a biometric recognition system based on the iris portion of the human eye. All iris recognition algorithms of the current day face a major problem of localization errors and the enormous time involved in this localization process. Spatial domain zero crossing may be the simplest and least complex method for localization. Yet, it has not been used due to its high sensitivity to erroneous edges, as a consequence of which more complex and time-consuming algorithms have taken its place. Appropriate statistical bounds imposed on this process help this method to be the least erroneous and time-consuming. Errors were reduced to 0.022% using this approach on the CASIA v1 & v2 datasets. Time consumption in this stage was the least compared to other algorithms. At the comparison stage, most algorithms use multiple comparisons to account for translation and rotation errors. This is time-consuming and very resource-hungry.
Results
The current approach discusses a robust method based on a single comparison, which works with a correct recognition of over 99.78% which is clearly demonstrated by tests.
Conclusions
The technique is to use a neural network trained to recognize special statistical and regional parameters unique to every person’s iris. The algorithm also gives sufficient attention to consider illumination errors, elliptical pupils, excess eyelash errors and bad contrast.
1. INTRODUCTION
In the present era of information technology, intelligent identification and secure access are everybody’s concerns. Iris recognition has played its part in this regard, by proving to be one of the best authentication methods available. Because of its incredibly information-rich physical structure and distinctive texture pattern, the iris is a physiological trait that has genetic independence from DNA and is therefore complex enough to be employed as a biometric signature. The iris develops randomly both during pregnancy and after birth due to its epigenetic creation, which results in a randomly dispersed characteristic. The iris patterns never change throughout a person’s lifetime and is thus the best biometric method which is completely foolproof wherein chances of false authentication are almost ruled out. Every iris recognition system has 2 crucial stages that decide its fate - the localization stage and the recognition stage. Localization involves extracting the iris portion of the image from a general picture of the eye and the recognition stage is the part where parameters are extracted and compared to find a match [1].
When imaging can be done at distances of one meter or less, and particularly when it is necessary to search very large databases without running into any false matches despite a vast number of possibilities, iris patterns offer a potent alternative strategy for reliable visual recognition of individuals. This approach is predicated on the core idea that interclass variation ought to be greater than intraclass variation. The iris has the substantial mathematical benefit that various people's iris patterns differ significantly from one another while having a tiny 11 mm diameter and occasionally being challenging to visualize. The iris is also highly insulated from the outside elements and stable throughout time because it is an interior organ of the eye [2].
Iris is regarded as one of the most reliable biometric traits for human identification for a variety of reasons, including the fact that it is a highly protected internal organ that is visible from the outside, iris patterns are highly distinctive with a high degree of freedomand are largely stable over time, etc. Iris recognition findings from contemporary algorithms have been encouraging. Most iris recognition algorithms (also known as iris codes) use binary characteristics. Because the binary character of iris codes offers substantial benefits in memory and processing costs, iris recognition systems may be widely used. The India's current nationwide iris recognition system deployments have millions of people registered [3].
Most present-day matching systems experience serious errors in the enrollment process due to improper localization. The current algorithm brings the efficiency of this stage to 100% (on CASIAv1) by the use of the zero-crossing technique. The current procedure reduces tedious computation by avoiding frequency domain analysis which by itself is the major cause for most of the enormous computations involved. Zero crossing combined with the imposed statistical bounds, boosts the efficiency of the process.
In the recognition stage, most algorithms use a “scroll and compare” approach to account for the tilt. The weakness of this approach is that many time-consuming comparisons are involved - the current method implements this in a single comparison. The technique is to divide the iris into large sections and perform individual matching on these sections [4].
1.1. Problem Statement and Motivation
Given that iris coding is a type of feature selection and recoding, the employment of meta-heuristic searching optimization for this application has tremendous potential to improve performance in terms of recognition, noise filtering, memory reduction, and computing efficiency. A flaw in prior meta-heuristic algorithms is the assumption of a fixed length or number of features. This is because not all datasets have access to information about the actual number of relevant characteristics.
There are multiple contributions in this article, which are as follows:
• As far as we are aware, this is the first article to address the difficulties of iris recognition from the perspective of feature selection. In contrast to conventional approaches that use Zero crossing and Neural Networks for feature extraction, it primarily proposes a Neural Network for maximizing the iris identification performance.
• For the goal of feature selection in the context of iris recognition, it takes advantage of the already-existing Zero crossing optimization. Due to its superior performance compared to rival algorithms.
• It illustrates the advantages of the suggested work over state-of-the-art techniques by contrasting the performance of Zero crossing optimization for feature selection in iris identification utilizing statistical parameters.
The rest of the article is divided into the following sections. Section 2 then presents the literature review. In Section 3, we discuss the background of iris coding. The technique is then presented in Section 4. The experimental results and evaluation are then presented in Section 5. Finally, the summary and conclusion are provided in Section 6.
2. MATERIALS AND METHODS
Gangwar [5] suggested the DeeplrisNet architecture for early iris recognition. This system, which may achieve exceptional iris recognition performance based on the deep architecture, is built on the deep architecture and several tips for effective CNN applications. A capsule network architecture for iris recognition was put forth by Wang [6]. The experimental results demonstrated the approach's stability and viability by docking various outputs of multiple classical neural network architectures with the capsule architecture. Furthermore, Minaee [7] extracted iris-deep features using VGGNet in order to obtain high-precision recognition results. Nguyen [8] examined a number of pre-trained CNN models, such as DenseNet, AlexNet, VGGNet, InceptionNet, and ResNet, in order to extract readily available CNN characteristics for precise iris identification and retina recognition. He Wong et al. [9] suggested using ResNet, or the deep residual network, to recognize images. Training the smaller iris datasets can benefit greatly from this architecture's ability to reduce overfitting and improve accuracy. For texture recognition, Mao et al. [10] proposed a residual pooling layer that can retain texture spatial information for improved recognition performance. The biometric methods used in behavioral models include voice, gait, and signature recognition [11]. The iris recognition system (IRS) is the most effective and trustworthy biometric authentication method available today for determining authenticity [12, 13]. Iris localization techniques based on computer vision and pattern recognition have continuously emerged with the rapid advancement of computer science and image processing technology, yielding impressive results [14]. A fuzzy logic system approach to iris recognition was presented by Rabih Nachar et al. [15]. This approach has a high recognition accuracy but is sensitive to local extremes and has low noise immunity. In the visible spectrum, Young Won Lee et al. [16] presented an effective technique for locating the iris's center in low-resolution photographs. A CGA-based circle recognition technique was presented by Aniu et al. [17] to identify pupil boundaries and iris edges for precise and quick iris localization. In order to reduce uncertainty, Zhang S et al. [18] presented a novel soft computational approach for iris segmentation based on approximate directionality and localization utilizing circular sector analysis. The Hough transform has trouble localizing the inner and outer circles of the iris due to a significant number of ineffective samples and accumulations [19]. The simulated annealing algorithm (SA) has gradual convergence, and the heuristic algorithm's solution, the starting state solution default value parameter setting, and the initial trial state are independent [20]. Every iris recognition system typically includes the following sub-processes: iris picture acquisition, pre-processing, iris segmentation, iris feature extraction, and iris matching verification or identification [21]. Finding the pixels in an image that represent the iris region and can be utilized for feature extraction and matching is known as iris segmentation and localization [22]. A deep-learning-based iris segmentation method was put forth by Li et al. [23]. To mark and identify the location of the eyes, the authors built a modified Region-based Convolutional Neural Network (R-CNN) with six layers. Then, the pupil was located using the Gaussian Mixture Model (GMM). The circular iris inner boundary was also established using five important boundary points. We can extract useful information from the iris images and improve the effectiveness of the iris recognition system by identifying the proper iris region. The majority of iris images that are collected include noise in them, including occlusions from eyelids or eyelashes, specular reflections, angular deviations, and blur. The most important problem in iris segmentation and localisation is a noisy iris image [24]. Furthermore, the majority of earlier investigations were placed in carefully regulated settings. They are not particularly reliable, and they ignore parameterizing the iris boundaries in order to segment the noise-free mask. This work resolves this issue by creating a fresh framework based on deep learning [25]. Han et al.'s [26] study on iris localization proposed an effective method for dealing with noisy iris images. Pupil border and iris boundary localization are the two steps in their suggested iris localization approach. The localization of a pupil region is accomplished using an effective block-based minimum energy detection technique with the elimination of specular reflection as a pre-processing step. Gad et al. [27] developed an iris-based recognition method as an unimodal biometric using multi-biometric settings. To find the iris during the segmentation phase, a new method built on the masking approach was developed.
Another study suggests employing an adjustable filter bank to extract region-based information from uncooperative iris pictures. The proposed method is based on a half-band polynomial of the 14th order. Datasets from CASIAv3, UBIRISv1, and IITD were used to train the model. Additionally, rather than the z-domain, filter coefficients were gathered from the polynomial. The tunable filter bank was used to extract texture features from the annular iris templates that were appropriately localized using an integral differential operator [28]. Singh et al. [29] present a feature-based method for iris recognition based on the Integer Wavelet Transform (IWT). Along with other models, the relative total variation model is applied. The segmented iris area is normalized and disassembled using a four-level IWT. Simple filtering, Hough transformations, and edge detection are utilized to approximatively determine the location to speed up iris segmentation. A few studies [30, 31] crop the generated map and feed it into the recognition network using our end-to-end architecture. The output of the segmentation network and the associated original picture are logically ANDed to produce the resulting map. The second branch employs the squeeze-and-excitation (SE) method described in a study [32] to get the feature map with attention values while taking into account the correlations among the feature map channels. The final output feature map Z is then created by concatenating the outcomes of the two-channel dimension branches, X and Y. As a result, features are reused correctly, and the connections between the channels are taken into account to extract useful characteristics. For the precise SE operation calculation process. Additionally, another study [33] employed this structure and conducted numerous ablation experiments. The latter is used to lower the feature map's resolution. Utilizing the spatial attention (SA) operation recommended in another study [34] for the output of each En_trans layer also preserves the spatial attention value of the output of each En_trans layer in the encoding stage. Tara Othman Qadir Saraf et al. [34]
describe a unique iris recognition method that includes the feature selection step in addition to iris feature extraction and coding. Moreover, modifying our recent approach to variable length black hole optimization (VLBHO) allows choosing a variable length of features for iris recognition. This is the initial selection of variable-length features for iris recognition. With the help of our suggested approach, characteristics can be segmented based on their importance, improving the optimization's memory and computational efficiency and increasing its likelihood of convergence. The well-known support vector machine (SVM) and the logistic model are used for classification in this article.
3. OVERVIEW OF THE STEPS INVOLVED
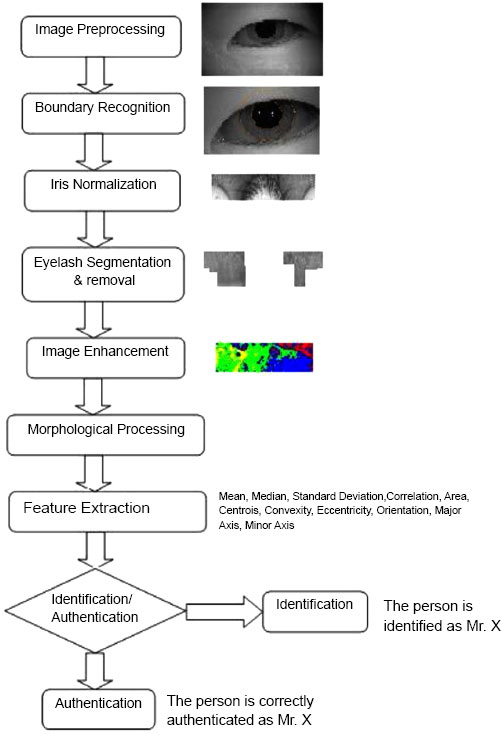
The main steps of the procedure are shown in Fig. (1). Everything begins with the preprocessing step, where flash and other bright spots in the image are identified and eliminated. The boundary identification module comes next, and its job is to determine the limbic and pupillary boundaries so that the iris region can be isolated. The iris region obtained in the previous phase is then transformed into a rectangular shape and rolled out in the form of a strip as part of the normalization process. After that, the work of segmenting the eyelid and eyelashes must be completed in order to enter the recognition step. If this is not done, mistakes in authentication may result.
These regions are then further subject to a stage of enhancement and the enhanced image is then morphologically processed to join broken edges. Features are extracted and then compared using a neural network to obtain matches.
4. STATISTICALLY BOUND SPATIAL DOMAIN ZERO CROSSING
Boundary recognition implies, the detection of the inner pupilar boundary and the outer limbic boundary. After the above boundaries are recognized, the iris region is simply the region in between these 2 circles. Most algorithms like the hough circle method [1, 2, 5, 6] assume that the pupilar boundary is a perfect circle and hence cause errors when trying to fit a circle to an elliptic-shaped pupil. But the current method uses an ellipse to fit the pupilar boundary thus overcoming this problem. Also, the presence of excess eyelashes is not a major threat to the algorithm because of the large number of corrective precautions taken.
The technique employs a number of corrective techniques to eliminate parasitic edges before employing elliptical fitting to produce the ideal boundary points. This is crucial because, in contrast to the hough approach, basic elliptical fitting is incredibly sensitive to false edges brought on by eyelashes. In order to get rid of the false edges and get a good boundary, a number of corrective methods or statistical boundaries must be used. The existence of a non-black point followed by a sizable black zone indicates the presence of a boundary.
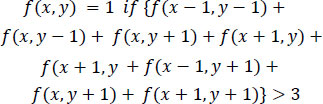
1. Initially, we retain only those points in the original image that are connected to the centre, which itself is computed by averaging the obtained boundary points as in Eq. (1). This process helps in removing isolated noisy edges and aids the process.
 |
(1) |
2. Isolated boundary points having less than three neighbors in the immediate 8 neighborhood are then searched for, using Eq. (2) and subsequently removed.
 |
(2) |
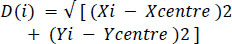
3. After the computation of the centre, we compute the average Eulerian distance to all the obtained boundary points using Eq. (3).
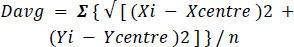 |
(3) |
Now the strategy is to assign 2 separate thresholds and retain the boundary points only if they lie within these thresholds as shown in Eq. (4).
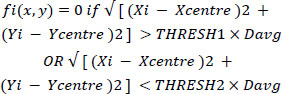 |
(4) |
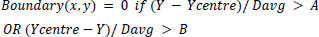
4. The Davg computed in the above stage is actually an approximate value of the radius. So, as the top and bottom portions of the iris are more disturbed by eyelashes and eyelids, consider only A times the radius for the upper range and B times the radius for the lower range. B>A as lower eyelashes are less prominent. Parameters A and B are determined on the basis of the images in the dataset.
 |
(5) |
5. Currently, the boundary edge points undergo a trimming procedure in which the edge points with the lowest and greatest distances from the center are eliminated, leaving just the intermediate ones. Thus, the residual noise is eliminated.
 |
(6) |
The remaining points are now fit into the best possible ellipse in Eq. (8) using the least squares criterion.
 |
(7) |
As shown in Section V, the aforementioned method required the least amount of computing time when compared to other algorithms and produced results that were nearly 99.98% better than the industry standard for CASIAv1.
5. RECOGNITION USING NEURAL NETWORKS
5.1. Image Enhancement
Image enhancement is applied in the initial stage in most approaches. But this takes more computation period and does not enhance the required regions properly. Due to this problem, enhancement is applied at this stage to properly enhance only the region of interest. The enhancement done on an image is dependent on the image used for comparison and thus, the same image may be subject to different levels of enhancement in different cases. The main problem prevalent in the images is their improper value of gamma which gives them a bad contrast. So the technique here is to obtain a good contrast image by proper application of gamma correction. In order to recognize whether the gamma chosen is a proper value or not, the resultant image is sliced into 4 levels and then the standard deviation of the number of pixels having each of the 4 levels is noted. When the standard deviation assumes a minimum value, it indicates a good contrast image. The second image is adjusted based on the distribution of the 4 levels in the first image. A gamma value is chosen such that the distribution of the 4 levels is almost similar to the previous case.
5.2. Feature Extraction
This is the most crucial step in the whole process, where important parameters are extracted from both the images to be compared and these parameters are later subject to comparison. Two types of parameters are mainly extracted from the image.
5.2.1. Statistical Parameters
The image is divided into equal sections say 8 equal sections as in Fig. (2). This division is done for both – the source image as well as the image to be compared.
Comparison is now done between the two images section-wise. In each case, the mismatch of the statistical parameters like mean, median, standard deviation, mode and variance as shown in Eq. (8) is noted and in the end, the total mismatch is calculated as the sum of the mismatches in each section as in Eq. (9). It seems obvious, that similar images yield a low value of mismatch and dissimilar images yield high values of mismatch. So this section yields a number of parameters like mismatch in the mean, mismatch in the median, mismatch in mode, mismatch in correlation [11] and mismatch in standard deviation.
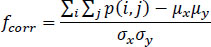 |
(8) |
 |
(9) |
This process is also repeated to the full 8-bit images (of corrected gamma) in order to yield more such parameters.
5.2.2. Region Properties
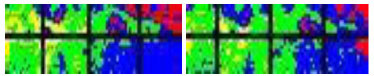
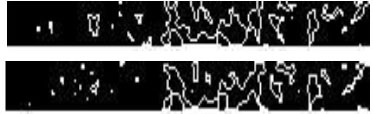
The regions of lightest and darkest intensities indicate some information about the patterns present in the iris. So the idea here is to recognize whether the shapes in the compared images match each other.
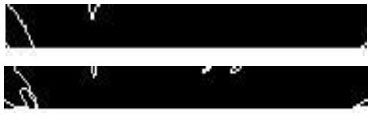
As is clear from Figs. (3 and 4), although slight variations in shapes and position are present between boundaries in images of the same category, they are almost similar. However, the major problem comes in locating the position of similar boundaries in both images.
Boundaries are analyzed one by one in the first image and a comparable one in the second image is searched. These conditions are given in Eqs. (10 and 11). The best matching boundary i in the second image is then decided to be the desired boundary. These 2 boundaries in both images are then compared in all geometric respects like orientation of the Axis, length of major and minor axes, convexity, perimeter, area and eccentricity of an enclosing ellipse, eccentricity defined as in Eq. (12).
 |
(10) |
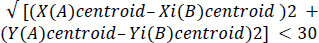 |
(11) |
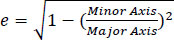 |
(12) |
5.2.3. Authentication Using the Neural Network
The above stage produces about 37 different mismatch parameters for any single comparison between 2 images. Assigning different weights to these parameters is done using a trained neural network. The network is trained on the basis of these parameters using a scaled conjugate gradient approach.
A major fact to be considered here is that different images in the dataset may have different crucial designs of the iris masked off by eyelids. So, the current method needs about 3 different comparisons with images in the dataset to achieve an accuracy of 99.78%.
Detection time in the current approach is negligible compared to other traditional methods in spite of the 3 comparisons involved. Two images are said to be matching when the total match detected by the Neural Network exceeds a certain threshold, this threshold being determined by the satisfactory values for FAR and FRR.
6. EXPERIMENTAL RESULTS AND DISCUSSION
The experiments conducted involved utilizing two distinct datasets: CASIAv1 and CASIAv2, both sourced from the prestigious Chinese Academy of Sciences. The CASIAv1 dataset comprised 108 subjects, each associated with 7 images, while the CASIAv2 dataset included 60 subjects, each with 20 images. Notably, the images within each dataset were collected during two separate sessions, with a one-month interval between sessions. This collection methodology ensures diversity and represents a realistic scenario where iris images might exhibit temporal variations. The experimental setup utilized hardware consisting of an i3 processor paired with 8GB of RAM. MATLAB 2021b served as the primary platform for conducting the experiments. MATLAB's extensive toolset for image processing and analysis made it well-suited for this task, providing a robust environment for algorithm development and evaluation.
In the training stage, the neural network was trained with the scaled conjugate gradient approach. Training samples included 3 of the 7 images from 70 subjects among the 108 in CASIA-1 dataset and 5 out of the 20 images of 35 subjects among the available 60 in the CASIA v2 dataset. The network was a bilayer network with 50 neurons in the first stage. The network was trained with over 14,000 test comparisons, 7000 of which were matching data and the rest non-matching.
The experimental outcomes in Table 1 compare various methods within the context of both identification and verification scenarios. In the identification scenario, two common situations are considered: one registered picture and six registered pictures. For the verification assessment, key performance indicators include the False Rejection Rate (FRR) at False Acceptance Rates (FAR) of 0.1% and 0.01%, as well as the Equal Error Rate (EER).
In the identification scenario, where one registered picture and six registered pictures are considered, different methods are evaluated based on their ability to accurately identify individuals from varying numbers of registered images. This provides insights into the scalability and robustness of the methods under different conditions.
For the verification assessment, the focus is on evaluating the performance of the methods in distinguishing between genuine and impostor attempts. The FRR at different FAR thresholds (0.1% and 0.01%) and the EER are used as metrics to gauge the effectiveness of the methods in verification tasks. It is noted that the model undergoes a retraining process on the same 33-class training set following a pruning procedure. Initially, the suggested network is trained from scratch on 33 classes in the CASIA-V3 database. The retrained model achieves an EER of 0.76, which is considered excellent, indicating high accuracy in verification tasks. Overall, these experimental outcomes provide valuable insights into the performance of various methods in both identification and verification scenarios, helping researchers and practitioners make informed decisions about the selection and optimization of iris recognition algorithms.
| - | Correct Recognition Rate | Failure to Enroll Rate | Localization Time (secs) | Feature Extraction Time (msecs) | Comparison Time (msecs) | Total Time (secs) |
|---|---|---|---|---|---|---|
| [5] | 97.38% | 1.5% | 8.7 | 682.5 | 54 | 9.436 |
| [7] | 98% | 1.75% | 8.3 | 210 | 401 | 8.911 |
| [11] | N/A | 0.92% | 3.8 | N/A | N/A | N/A |
| [12] | 92.64% | - | - | 170.3 | 11 | - |
| [13] | 99.56% | - | 203 | 80.3 | 167.2 | 203.24 |
| [15] | 99.6% | 0.083% | - | 260.2 | 8.7 | - |
| [17] | 97.08% | - | - | - | - | - |
| [19] | 99.14% | - | - | - | - | - |
| [21] | 95.62% | 17.45% | - | - | - | - |
| [23] | 89% | 8% | 0.25 | NA | 0.5 | 0.26 |
| [25] | 83.7% | - | - | 14.5 | 15.4 | - |
| Proposed Method | 99.78% | 0% | 1.42 | 3.762 | 42 | 5.224 |
6.1. Errors in the Localization Stage
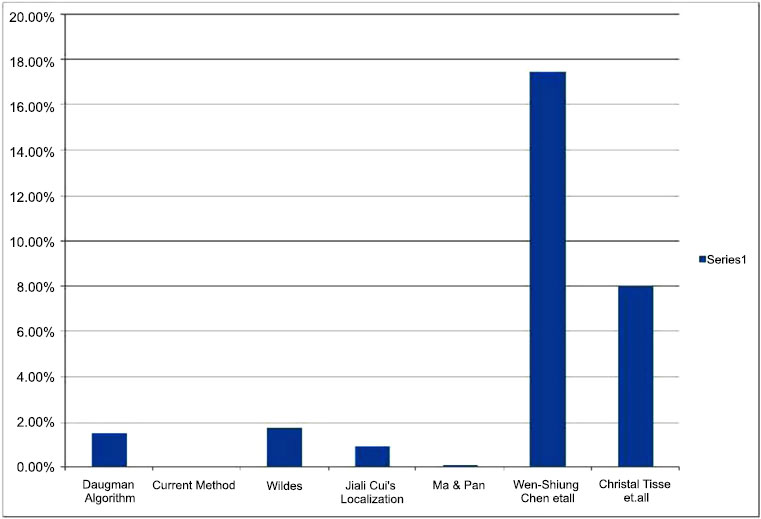
In the localization stage, the error rate achieved with the standard CASIA dataset is 0% and is 0.16% with the CASIA v2 dataset. The enrolment error is reduced due to the various procedures implemented at the localization stage. The enrolment error is plotted as shown in Fig. (5), the second bar (0%) representing the current method.
6.2. Correct Recognition Rates
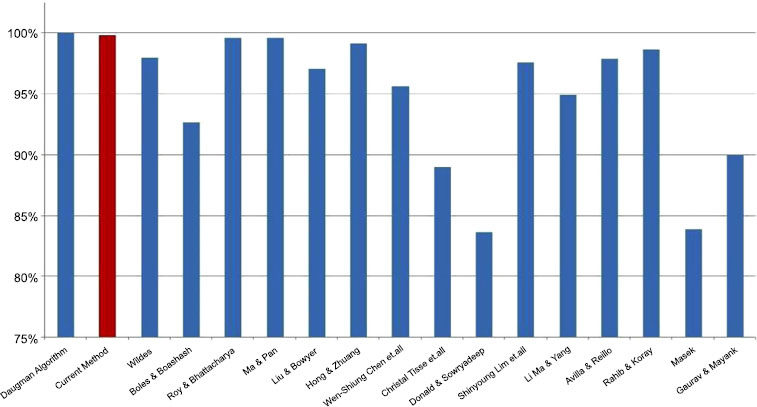
The algorithm was found to have an efficiency of greater than 99% on both datasets - 99.78% on the CASIAv1 and 99.62% on the CASIAv2 dataset. This efficiency measure was obtained on the basis of the test conducted using 20,000 test samples for which 44 images showed an error. The efficiency of the algorithm was compared with many of the famous iris recognition algorithms and the results are as depicted in Fig. (6) the red bar representing the current method.
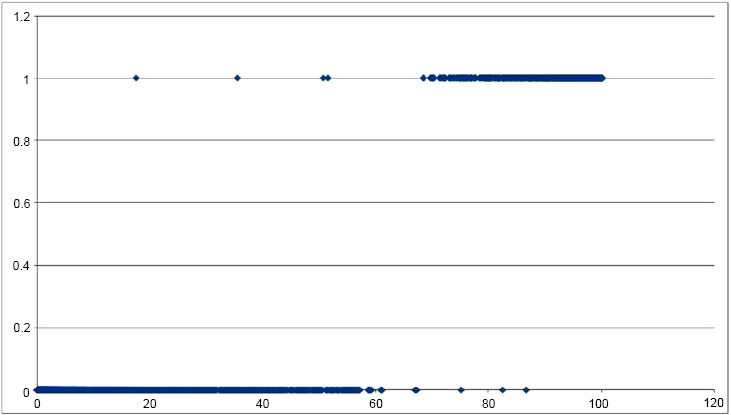
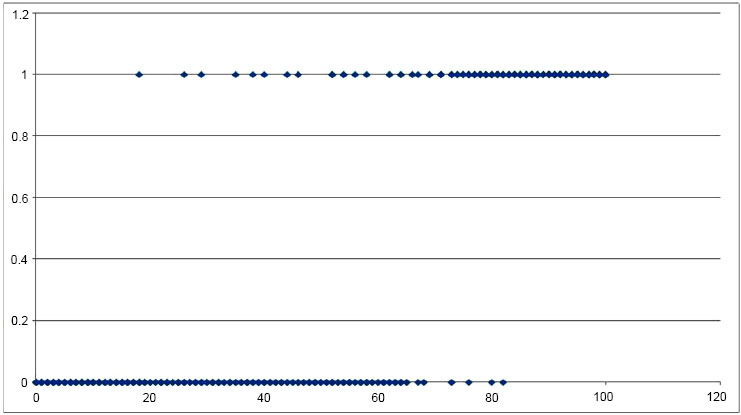
Among these 20,000 different comparisons, 10,000 were between a randomly chosen sample and another randomly chosen image of the same person (with the exclusion of the test sample) and the rest, were between the sample and another randomly chosen person. Features resulting from the comparison were extracted and applied to the neural network, the output of which was obtained in Figs. (7 and Fig. 8), which is the plot of input versus the output. Correct recognition is represented on top with results predominantly ranging from 75% onwards and false recognitions at the bottom having a range from 0 to 60%. Figs. (7 and 8) provide the input-output (I/O) relation of outputs obtained from a neural network trained on the CASIAv1 dataset and CASIAv2 dataset, we first need to understand the nature of the dataset and the specific architecture and purpose of the neural network in question. Without this information, it is challenging to give a precise I/O relation.
6.2.1. Input
For the CASIAv1 dataset, the inputs are likely images or some form of data representing images (such as numerical arrays).
6.2.2. Output
The outputs would depend on the task the neural network was trained for. For example, if the neural network was trained for image classification, the output might be a vector of probabilities corresponding to different classes.
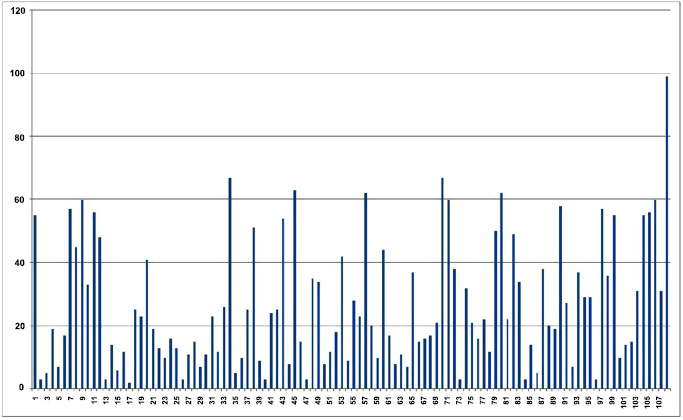
Experiments were also conducted in the identification mode, where a single image was continuously compared with all images in the dataset till a match was obtained. The results of searching for a match with a sample of the 108th person are as shown in Fig. (9). As is visible, the maximum response is obtained at the 108th sample i.e. correct match.
6.3. FAR and FRR
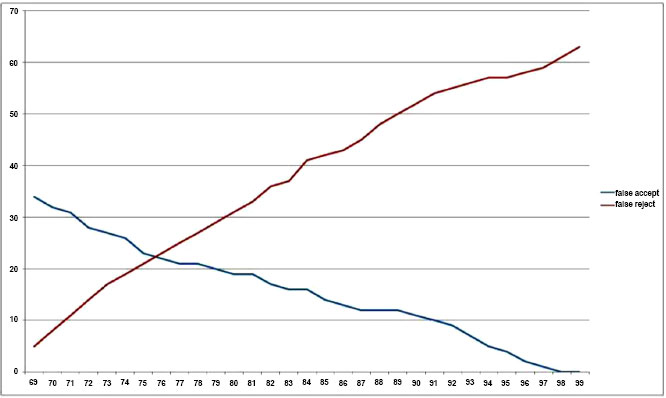
It can be clearly seen that a threshold of about 77% may be chosen as the borderline in order to achieve a reasonable compromise between FAR and FRR. False acceptance was found in 22 cases, and false rejection was observed in 23 cases (with a threshold of 77%) among the 20,000 different comparisons observed. The choice of threshold for successful acceptance decides the FRR and FAR the plot of which is shown in Fig. (10), the blue line representing FAR and red representing FRR.
Additionally, Fig. (10) shows the complete receiver operating characteristic (ROC) curve. The transferred model produces a result for the CASIA-V1 database that is fairly acceptable due to its high image quality. To further customize its domain, the model can only be adjusted with 20 classes, although this won't significantly boost performance.
6.4. Execution Time
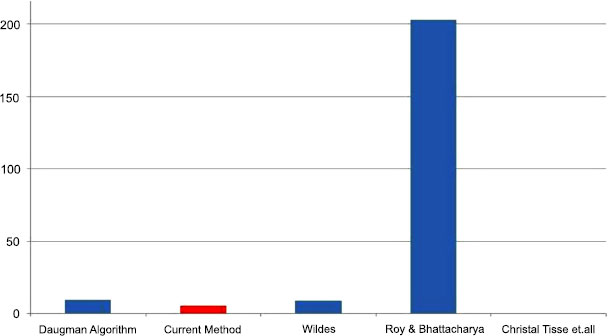
In terms of execution time, the current algorithm takes about 1.42 seconds for preprocessing and localization, whereas about 3 seconds is taken in the feature extraction stage and matching. In this regard, the proposed method outperforms some commercially used algorithms like Daugman’s algorithm despite the 3 comparisons carried out which makes the comparison time higher. The execution times of various algorithms are plotted in Fig. (11), with the red bar representing the current algorithm.
Fig. (11) shows an intriguing phenomenon: the computational time consumption of the encoding matching process develops nonlinearly on the CPU and linearly on the GPU with an increase in the number of registered photos in each class. This could be brought on by various CPU caching systems. The identification process's elapsed time is shown in Fig. (11).
A variety of metrics are used to assess the proposed strategy in various testing sets and experimental environments. To compare the suggested total performance, various computed metric scores and related rankings are merged. In order to assess the viability of the suggested strategy, we first give the predictions for iris segmentation and localization. Table 1 presents the overall evaluation outcomes attained by the suggested method for all testing sets. Our technique could have a performance issue if the iris's center is not chosen properly, which is one potential flaw. The differences in iris shape and pupil dilation that frequently create this problem with iris localization are prevalent. We employed a thresholding method to choose the iris region and data augmentation to train the model on different iris shapes in order to get over this issue.
Our method may not work effectively if the iris's center is not chosen accurately, which is one potential limitation. Variations in iris shape and pupil dilation are frequently the source of this prevalent problem with iris localization. In order to get over this restriction, we trained the model on a variety of iris forms using data augmentation and a thresholding technique to identify the iris region.
Our research demonstrates that spatial domain zero crossing and neural network design are effective for iris segmentation and localization, and we believe that this method has application potential in real-world settings such as biometric identity and access control systems. Iris recognition systems can still be made more accurate and resilient, and future research can look at other designs and approaches. As a result of our study's innovative approach and dataset for iris segmentation and localization, the area of iris identification has benefited greatly. Our findings demonstrate that the Zero Crossing and Neural Networks model can perform this task with excellent accuracy, and we anticipate that our work will stimulate additional study and advancement in the field. Our findings show how well CNN architecture works for iris segmentation and localization, and we think this technique has potential for use in practical applications like access control and biometric identification. Still, there is potential for development, and future studies can look into different designs and methods to boost the precision and resilience of iris recognition systems even more.
CONCLUSION
By appropriate statistical bounds imposed on the zero-crossing method, the current algorithm suppresses the enrollment errors to 0.022%. Time and resource consumption is also significantly lower in the present method. The authentication stage is also tweaked to occupy minimum time, as a single comparison is involved. The final efficiency of the algorithm thus gets boosted to 99.78%. Based on all these considerations, the method holds a very promising future. In the meanwhile, we combine our collected dataset with three well-known NIR iris datasets that are also publically accessible. On the two iris datasets, which demonstrate our proposed method's superior performance, we compare it with state-of-the-art approaches. We will enhance the segmentation and localization effectiveness of the iris to enhance the cutting-edge NIR iris image datasets.
LIST OF ABBREVIATIONS
| IRS | = Iris Recognition System |
| SA | = Simulated Annealing Algorithm |
| GMM | = Gaussian Mixture Model |
| IWT | = Wavelet Transform |
| SE | = Squeeze-and-excitation |
| VLBHO | = Variable Length Black Hole Optimization |
ETHICS APPROVAL AND CONSENT TO PARTICIPATE
Not applicable.
HUMAN AND ANIMAL RIGHTS
No animals/humans were used in this research.
CONSENT FOR PUBLICATION
Not applicable.
AVAILABILITY OF DATA AND MATERIALS
Data availability is not applicable to this article as no new data were created or analyzed in this study.
FUNDING
None.
CONFLICT OF INTEREST
The authors declare no conflict of interest financial or otherwise.
ACKNOWLEDGEMENTS
Declared none.

