
Data Mining Approach to Estimate the Duration of Drug Therapy from Longitudinal Electronic Medical Records
Authors Info & Affiliations
Abstract
Background:
Electronic Medical Records (EMRs) from primary/ ambulatory care systems present a new and promising source of information for conducting clinical and translational research.
Objectives:
To address the methodological and computational challenges in order to extract reliable medication information from raw data which is often complex, incomplete and erroneous. To assess whether the use of specific chaining fields of medication information may additionally improve the data quality.
Methods:
Guided by a range of challenges associated with missing and internally inconsistent data, we introduce two methods for the robust extraction of patient-level medication data. First method relies on chaining fields to estimate duration of treatment (“chaining”), while second disregards chaining fields and relies on the chronology of records (“continuous”). Centricity EMR database was used to estimate treatment duration with both methods for two widely prescribed drugs among type 2 diabetes patients: insulin and glucagon-like peptide-1 receptor agonists.
Results:
At individual patient level the “chaining” approach could identify the treatment alterations longitudinally and produced more robust estimates of treatment duration for individual drugs, while the “continuous” method was unable to capture that dynamics. At population level, both methods produced similar estimates of average treatment duration, however, notable differences were observed at individual-patient level.
Conclusion:
The proposed algorithms explicitly identify and handle longitudinal erroneous or missing entries and estimate treatment duration with specific drug(s) of interest, which makes them a valuable tool for future EMR based clinical and pharmaco-epidemiological studies. To improve accuracy of real-world based studies, implementing chaining fields of medication information is recommended.
1. INTRODUCTION
The electronic medical records (EMRs) and the administrative data from the primary/ambulatory care systems are increasingly being used in epidemiological [1-3], pharmaco-epidemiological [4-6], pharmaco-vigilance [7-9], clinical outcome [5, 10-12], health economic [13, 14] and public health related studies [15-18]. Analyses of large primary care based EMRs from various countries, most notably from UK, USA and Sweden, have provided significant insight into the effectiveness of changes in health care practices/polices on overall disease and health management costs [3, 15, 19, 20], in addition to population level evidences on the safety and effectiveness of various therapies and the association of disease-related risk factors on long-term outcomes [5, 6, 18, 21-23]. Increasing use of such large real-world patient-level data is illustrated well by the sixfold increase in EMR based published studies since 2000 [10, 24].
In structured EMRs, especially from the primary/ambulatory care systems, comprehensive patient level data are captured on different domains simultaneously and stored in the form of relational database [25, 26]. Representative examples include the UK Clinical Practice Research Database and CentricityTM EMR (CEMR) database of USA [27, 28]. The extraction, quality control and management of such voluminous longitudinal data under individual study protocols is highly methodologically and computationally involved, and challenging from data mining and analytical viewpoints [22, 29]. Data science generally considers that data preparation tasks consume about 80% of total project timeline leaving only 20% for ultimate analysis itself [30, 31]. Data completeness, systematic biases, reproducibility and quality are some of the notable limitations in such databases [18, 29, 32].
Most EMR databases capture large amounts of detailed information on medications provided to individuals over time, while specific form in which this information is stored varies from database to database [26]. It is usually possible to obtain the drug class, specific brand name within the corresponding class, prescription dates, dosage, and number of refills [32]. However, a significant number of entries for an individual prescription may be missing or contain errors. The problem with information completeness can also arise when the medication nomenclature is not correctly matched [29].
Clinical and pharmaco-epidemiological studies, which rely on the data from EMRs, are often interested in the effectiveness of specific therapies, therapeutical dynamics, treatments with concomitant medications, and durations thereof in specific disease areas. Such real-world analysis provides an extremely valuable means for the understanding of drug utilization patterns, treatment initiation periods following the diagnosis of a disease, the effectiveness of specific therapies on disease-related risk factors, and possible associations of therapies with long-term outcomes [1, 6]. These studies warrant appropriate extraction of longitudinal information on prescriptions or medications at individual patient level, inappropriate extraction of the data may result in misleading inferences reported [33-35]. Generally, pharmaco-epidemiological studies do not estimate treatment duration, but only account for the fact of one or more prescriptions for a particular drug(s) [36, 37]. Some studies calculated medication duration by extracting first prescription date from the last prescription date [38, 39], and only few studies additionally considered a drug being discontinued if the subsequent prescription was not refilled within the expected time of drug coverage [40, 41]. While some studies have discussed the challenges in the analysis of medication data from EMRs [18, 42], to the best of our knowledge no existing study has analysed the quality, consistency, and completeness of EMR prescription information, nor proposed a practical algorithm able to extract salient medication information from large and complex longitudinal data sets [43].
The aims of this explanatory and methodological study are (1) to discuss and analyse the most pressing challenges encountered by computer based methods in the process of extracting and aggregating longitudinal medication data from EMRs, (2) to describe two algorithms to extract prescription information of individual therapies and to estimate the corresponding duration of treatment, and (3) to discuss how estimates of individual medication duration are affected by the choice of the study design. The effectiveness of algorithms is compared is on a cohort of patients with a clinical diagnosis of type 2 diabetes (T2DM) using a real-world EMR database collected across the USA.
2. MATERIALS AND METHODS
2.1. Centricity Electronic Medical Records
The CEMR database contains more than 40 million patients’ clinical/treatment records from 1995. CEMR represents 49 US states and a variety of ambulatory medical practices, including solo practitioners, community clinics, academic medical centres, and large integrated delivery networks. The database has been extensively used for academic research worldwide [3, 37, 44-47]. The CEMR database consists of over 30,000 health care providers, of whom approximately 70% are primary care providers. For both insured and uninsured patients, this database contains comprehensive patient-level information on many aspects including demographic information, laboratory results, history of diseases, clinical diagnosis of symptoms/ diseases, vital signs, history of medications and detailed information on the ongoing medications. For this study we used longitudinal information from January 1995 to October 2014.
2.2. Medication Data in Centricity EMR database
The medications taken by an individual (medication domain) and the prescriptions for drugs provided to the individuals by the service provider registered within the EMR system (prescription domain) are extensively documented in the database by means of three tables: medication dimension (MD), medication fact (MF) and prescription fact (PF). The MF and PF belong to the medication and prescription domains respectively. The MF may include a broader list of all medications that a patient is taking including over the counter medications, herbal remedies and medications prescribed by a provider that may be out of the EMR network. MD is linked to both MF and PF. Each record in the MD contains information on individual drug, which includes the National Drug Code (NDC) and Generic Product Identifier (GPI), as well as the four ordered attributes derived from the GPI such as generic drug names. The MD also includes the medication doses corresponding to different brands’ products, identified by a unique medication key value assigned to each record.
The entries in MF capture individual patient’s medication prescription history and active prescriptions from all practitioners including the service provider registered within EMR system. It contains several special fields to track longitudinal patterns, such as active medication flag, which indicates if a patient was taking the drug at the database extraction moment. Active medication list is identified by records with value “Y” of active flag. The chain identification (ID) values facilitate tracking of treatment alterations (including the addition of new medications) over time, with the related chain sequence values which track medication adjustments within the same chain ID. The initiation (‘start’) and cessation (’stop’) dates associated with different treatments are also stored in the MF. However we found that the corresponding values are missing with alarming frequencies: 67% of the cases for the former and 11% for the latter. Also, some of the start and stop date entries could be erroneous, such as stop date preceding start date. An excerpt from the MF for an individual patient is shown in Table 1.
| GPI category 4 | Medication key (M) | Patient key (P) | Create date (C) | Start date (B) | Stop date (S) | Active flag (F) | Chain ID (H) | Chain seq (G) |
|---|---|---|---|---|---|---|---|---|
| METFORMIN HCL | 41467 | 288859 | 6-May-09 | 6-May-09 | N | 307667619 | 0 | |
| METFORMIN HCL | 41467 | 288859 | 11-Jun-10 | 11-Jun-10 | N | 307667619 | 1 | |
| METFORMIN HCL | 41467 | 288859 | 25-Apr-11 | 11-Jun-10 | 25-Apr-11 | N | 307667619 | 2 |
| LIRAGLUTIDE | 3347202 | 288859 | 25-Apr-11 | 25-Apr-11 | N | 812855070 | 0 | |
| LIRAGLUTIDE | 3347202 | 288859 | 10-May-11 | 10-May-11 | N | 812855070 | 1 | |
| LIRAGLUTIDE | 3347202 | 288859 | 10-May-11 | 10-May-11 | N | 820957274 | 0 | |
| LIRAGLUTIDE | 3347202 | 288859 | 14-Dec-11 | 10-May-11 | 14-Dec-11 | N | 820957274 | 1 |
| LIRAGLUTIDE | 3347202 | 288859 | 14-Dec-11 | 10-May-11 | 14-Dec-11 | N | 812855070 | 2 |
| INSULIN GLARGINE | 682327 | 288859 | 27-Feb-12 | N | 1092145628 | 0 | ||
| INSULIN ISOPHANE HUMAN | 682834 | 288859 | 27-Feb-12 | N | 1092145627 | 0 | ||
| INSULIN GLARGINE | 682327 | 288859 | 26-Sep-12 | 26-Sep-12 | N | 1092145628 | 1 | |
| INSULIN ISOPHANE HUMAN | 682834 | 288859 | 14-Nov-12 | N | 1092145627 | 1 | ||
| INSULIN GLARGINE | 682327 | 288859 | 14-Nov-12 | Y | 1092145628 | 2 | ||
| INSULIN LISPRO (HUMAN) | 682825 | 288859 | 26-Feb-14 | 26-Feb-14 | Y | 1092145627 | 2 |
The entries in the PF capture the prescription date and the associated number of refills only for medications that have been prescribed by the responsible provider within the EMR network. The MF dataset contains a broader set of entry sources, moreover the form of recording potentially comprises more details than corresponding data in the PF. Nevertheless it was determined that PF may contain unique entries that are not stored in MF. Therefore, the MF was considered as the primary source of medication information and the PF as a complimentary one.
3. METHODS
In this section, we introduce a novel algorithm for mining large-scale longitudinal EMRs with the ultimate goal of estimating the duration of treatment of a particular individual with a drug(s) of interest. The first method we introduce (“chaining”) relies on chain ID and chain sequence values recorded in the MF. This feature of the approach allows to account for treatments which include alternative drug use. To assess the importance and power of longitudinal chain information, we also describe a modification of the “chaining” method (“continuous”) which disregards chain ID and chain sequence values, and instead relies only on the chronology of patient’s records of particular drug(s). In the current literature, the latter approach is used more frequently.
3.1. Data Pre-processing: Auxiliary Fields
Although erroneous entries generally cannot be identified, various types of global consistency rules may be applied to reduce the error. Chronology of the events may be corrected by incorporating two additional fields: patient’s last available follow-up date and patient’s date of birth (DOB).
CEMR database stores last available follow-up date for each patient. As initial data pre-processing step, erroneous follow-up date entries were identified and corrected by the latest record creation dates of all activities within the database for corresponding patients.
Similar to many anonymized EMRs, the exact DOB was not available within CEMR. Simple procedure was applied to approximate DOB:
- Obtain multiple DOB estimates per patient by subtracting reported ‘valid’ age from the record creation date for all activities within the database. CEMR groups patients older than 80 years under a single age key. The non-missing age data and the non 80+ age keys were considered as ‘valid’ age entries.
- Approximate DOB as minimum of all estimates from Step 1.
- For patients without reported activities estimate DOB from the dataset containing demographic information by subtracting reported ‘valid’ age from the database extraction date.
The parameters for the mathematical formulations are identified in the Table 2 below.
| Scalars | |
| n | number of records in MF table |
| k | number of records in PF table |
| sd | standard prescription duration for individual drug |
| mx | maximal number of prescription refills for individual drug |
| u | number of unique patient keys in the cohort of interest |
| Sets | |
| PS = {ps1,ps2,…… psu} | set of unique patient keys in the cohort of interest |
| V | set of missing values |
| MS | set of medication keys of selected drug(s) |
FY = {fi|fi = "Y", i =  } } |
set of active drugs |
| MF={M,P,C,B,S,F,H,G} dataset | |
| M = (m1, m2,... ,mn)T | medication keys for drugs |
| P = (p1, p2,... ,pn)T | patient keys |
| C = (c1, c2,... ,cn)T | record creation dates |
| B = (b1, b2,... ,bn)T | start dates of individual records |
| S = (s1, s2,... ,sn)T | stop dates of individual records |
| F = (f1, f2,... ,fn)T | active medication flag values |
| H = (h1, h2,... ,hn)T | chain identification values |
| G = (g1, g2,... ,gn)T | chain sequence values |
| PF={M,P,C,B,R} dataset | |
| M = (m1, m2,... ,mk)T | medication keys for individual prescriptions |
| P = (p1, p2,... ,pk)T | patient keys |
| C = (c1, c2,... ,ck)T | record creation date |
| B = (b1, b2,... ,bk)T | prescription dates |
| R = (r1, r2,... ,rk)T | number of refills for individual prescription |
The scalars sd and mx may be defined on the basis of the standard prescription protocol for individual drugs. The default values of sd =1 and mx =24 were considered in our analyses.
MS may be identified by text-mining the MD dataset. For example, glucagon-like peptide-1 receptor agonist (GLP-1RA) may be identified by searching for “GLP-1 RECEPTOR AGONIST” in the second order GPI attributed field.
3.2. “Chaining” Method
The algorithm for the first approach to extract and aggregate data for the estimation of duration of treatment is elaborated below.
1. Merge the following to the MF dataset by patient key:
1.1) date of birth DOB = (db1, db2,...,dbn)T.
1.2) last available follow-up date L = (l1, l2,...,ln)T. The extended MF dataset would be of the form.
 |
2. Replace erroneous values of start dates (bi V
V  (bi<dbi
 bi>sibi>li), i = ) with missing values
3. Sort by patient key ascending, chain ID ascending within the same patient, chain sequence descending within the same chain ID.
 |
4. Set initial values p0 = 0, and approximate individual medication end dates E = (e1, e1,...,en)T on the basis of the following rules:
4.1) if stop date is not missing, then end date equals to stop date.
4.2) else, if active flag is “Y”, then end date equals to last follow-up date.
4.3) else, if first unique value of patient key or first unique value of chain ID, and start date is not missing, then end date equals to start date plus standard prescription duration.
4.4) else, if first unique value of patient key or first unique value of chain ID, and start date is missing, then end date equals to record creation date plus standard prescription duration.
4.5) else, end date equals to the create date of a previous record.
 |
 |
5. Replace values of end dates that falls out of the follow-up interval with last follow-up date.
 |
6. Delete records if start date is missing and create date is greater than stop date. Reduce the dataset to the set of patients from the cohort of interest and to set of keys of selected drug(s).
 |
7. Merge the following to the PF set by patient key:
7.1) date of birth DOB = (db1, db2,...,dk)T
7.2) last available follow-up date within the database L = (l1, l2,...lk)T. The extended PF dataset would take the following form:
 |
8. Replace erroneous prescription dates (bi V (bi<dbi bi>li), i= ) with missing values.
9. If number of refills is greater than pre-defined maximal number of possible refills or negative or missing, replace it with zero.
 |
10. Calculate end dates E = (e1, e2,...,ek)T by the following rules.
10.1) if prescription date is not missing, then end date is equals to standard duration multiplied by the number of refills plus one and added to prescription date.
10.2) if prescription date is missing, then end date is equals to standard duration multiplied by the number of refills plus one and added to record creation date.
 |
11. Update end dates as described in Step 5  .
.
12. Reduce PF1 to the set of patients from the cohort of interest, to the set of patients not in MF2, and to the set of keys of selected drug(s).
 |
13. Append both datasets by the following values: patient key, record creation date, start / prescription date and end date, assume that the new dataset MP contain n' records.
 |
14. Calculate the number (cn) of distinct record creation dates for each patient, treat missing start dates by the following rules:
14.1) if cn is equal to one, then delete the record.
14.2) if cn is greater than one, replace it with record creation date.
15. Sort by patient key ascending, start date ascending within same patient key.
 |
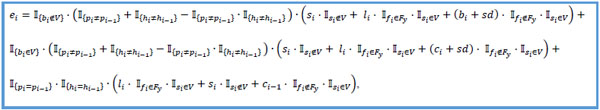
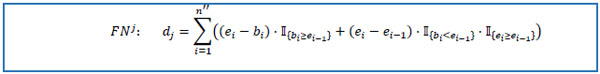
16. For each unique patient key psj PS,j =
  reduce MP to the set FNj containing only pi = psj, i =
  . Assume that obtained dataset FNj has n'' rows. Set e0 = 0 and calculate selected medication duration for the patient avoiding double calculations of overlapping intervals.
 |
17. Use medication duration D = (d1, d2,...,du)T to conduct further research.
3.3. “Continuous” Method
1. Repeat steps 1 and 2 from “chaining” method, then perform step 6, and treat missing values in MF2 as described in step 14. Assume that obtained dataset MF2 has  instances.
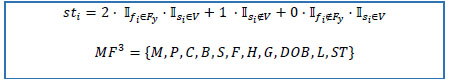
2. Create stop date status variable SI = (st1, st2,...,st)T on the basis of the following rules:
2.1) if active flag is “Y” and stop date is missing, then stop date status equals to 2.
2.2) if stop date is not missing, then stop date status equals to 1.
2.3) else 0.
 |
3. Sort MF3 by patient key ascending, start date descending within same patient key, stop date status ascending within the same start dates of the same patient:
 |
4. Set initial value p0 = 0 and approximate individual medication end dates E = (e1, e2,...,e)T.
4.1) if stop date is not missing, then end date equals to stop date.
4.2) else, if active flag is “Y”, then end date equals to last follow-up date.
4.3) else, if first unique patient key, then end date equals to start date plus standard duration.
4.4) else end date equals to start date of previous record.
 |
5. Perform step 5 from “chaining” method, and steps 7-11.
6. Reduce PF1 to the set of patients from the cohort of interest, to the set of patients not in MF3, and to the set of keys selected drug(s).
 |
7. Treat missing values in PF2 as described in step 14 of "chaining" method.
8. Append both datasets by the following values: patient key, record creation date, start/prescription date and end date, assume that the new dataset MP contain records.
 |
9. Perform steps 15-17 from “chaining” method.
4. REMARKS
Identified erroneous entries are declared as missing in Steps 2, 8, and 9 of “chaining” method. In the Step 14, the algorithm counts the number of unique creation dates for selected drug(s) at patient level. If obtained number is greater than one, then missing start dates are replaced with record creation dates. In such a way, a patient is considered to take a particular drug if the medication records were entered in a systematic manner, otherwise the records with missing start dates are disregarded.
As an example, the prescription scenario for anti-diabetes drugs for a patient with type 2 diabetes is presented in Table 1. The treatment was initiated with metformin (METFORMIN HCL) on the 6th of May 2009 and continued until the 25th of April 2011, when a switch to GLP-1RA (LIRAGLUTIDE) was made. With a stop date for GLP-1RA recorded on 14th of December 2011, data show a gap in the treatment till 26th of September 2012, when insulin therapy begun. However, a patient with diabetes using GLP-1RA is unlikely to have had a nine month long gap in the treatment. Indeed, careful data examination leads to the conclusion that insulin treatment started on 27th of February 2012, as would be estimated by the algorithm.
As it was mentioned earlier, MF was considered as primary data source, thus if at least one record for selected drug(s) at patient level is present in the MF, then both methods disregard entities in the PF. However, if there is no available data in MF table, the methods append data from PF.
Assessment of the first marketing date for a particular drug is an example of additional global consistency audit that is omitted in the methods’ description. For instance, any start date of GLP-1RA drugs must not be prior to April 2005, the date when first representative (Exenatide) was approved.
5. RESULTS
To evaluate the performance of described methods, we chose to focus on the estimation of the duration of treatment with two widely used anti-diabetic drugs, namely GLP-1RA and insulin. In the CEMR database 1,861,560 patients were identified as having been diagnosed with type 2 diabetes mellitus, as inferred from the assigned ICD-9 codes.
5.1. Case Study 1
As the first case study, we consider a randomly selected patient from the CEMR database, whose relevant treatment details are shown in Table 3. The treatments with EXENATIDE and INSULIN GLARGINE started on the 18th of June 2007. The treatment with EXENATIDE was terminated on the 7th of January 2008, while INSULIN therapy continued until the last recorded follow-up date on the 24th of January 2008 (notice that the treatment is flagged as active, “Y”). In this case, the “chaining” and “continuous” methods produce the same estimates for the durations of the two treatments. Specifically, the estimates corresponding to insulin and GLP-1RA are 7.2 and 6.7 months, respectively.
| GPI category 4 | Medication key (M) | Patient key (P) | Create date (C) | Start date (B) | Stop date (S) | Active flag (F) | Chain ID (H) | Chain seq (G) | Enddate (“chaining”) | Enddate (“continuous”) |
|---|---|---|---|---|---|---|---|---|---|---|
| INSULIN GLARGINE | 682327 | 15219411 | 18-Jun-07 | 18-Jun-07 | N | 136664321 | 0 | 20-Jun-07 | 20-Jun-07 | |
| EXENATIDE | 12670645 | 15219411 | 18-Jun-07 | 18-Jun-07 | N | 136664552 | 0 | 17-Oct-07 | 15-Oct-07 | |
| INSULIN GLARGINE | 1096062 | 15219411 | 20-Jun-07 | 20-Jun-07 | N | 136664321 | 1 | 7-Jan-08 | 7-Jan-08 | |
| EXENATIDE | 12670548 | 15219411 | 17-Oct-07 | 15-Oct-07 | N | 136664552 | 1 | 7-Jan-08 | 7-Jan-08 | |
| INSULIN GLARGINE | 1096062 | 15219411 | 7-Jan-08 | 7-Jan-08 | Y | 136664321 | 2 | 24-Jan-08 | 24-Jan-08 | |
| EXENATIDE | 12670548 | 15219411 | 7-Jan-08 | 7-Jan-08 | 7-Jan-08 | N | 136664552 | 2 | 7-Jan-08 | 7-Jan-08 |
5.2. Case Study 2
As an insightful case study, we consider a patient whose relevant treatment details are shown in Table 4. Since all of the records shown have the same chain ID it can be concluded that in the period from the 23rd of April of 2010 until the 13th of March 2013 the patient was alternating between two therapies, namely with GLP-1RA (EXENATIDE) and insulin (INSULIN GLARGINE). This example illustrates the importance of chain ID information, as readily corroborated by comparing the predicted therapy end dates using the “chaining” and “continuous” methods (per record estimates are shown in the two rightmost columns of Table 4). The latter disregards chain ID information, it implicitly assumes that EXENATIDE was taken continuously from the 23rd of April 2010 until the 27th of April 2011, with the last prescription date being the 28th of March 2011. However, treatment with EXENATIDE was terminated on the 29th of December 2010 when a switch to insulin was made. Treatment with insulin continued until the 28th of March 2011 when a switch back to EXENATIDE appeared. This complex and frequent pattern of therapy alteration leads to vastly different treatment duration estimates when chain ID information is used (“chaining”) and when it is not (“continuous”). For example, in this particular case, “continuous” approach estimates the total duration of insulin/ EXENATIDE treatment to be 5.7/ 28.9 months, compared to 26.5/ 12.1 months estimated by “chaining” method.
| GPI category 4 | Medication key (M) | Patient key (P) | Create date (C) | Start date (B) | Stop date (S) | Active flag (F) | Chain ID (H) | Chain seq (G) | Enddate (“chaining”) | Enddate (“continuous”) |
|---|---|---|---|---|---|---|---|---|---|---|
| EXENATIDE | 1523512 | 64832053 | 23-Apr-10 | 23-Apr-10 | N | 1002923273 | 0 | 29-Dec-10 | 28-Mar-11 | |
| INSULIN GLARGINE | 682327 | 64832053 | 29-Dec-10 | 29-Dec-10 | N | 1002923273 | 1 | 06-Jan-11 | 06-Jan-11 | |
| INSULIN GLARGINE | 682327 | 64832053 | 06-Jan-11 | 06-Jan-11 | N | 1002923273 | 2 | 28-Mar-11 | 18-Dec-12 | |
| EXENATIDE | 1523512 | 64832053 | 28-Mar-11 | 28-Mar-11 | N | 1002923273 | 3 | 18-Dec-12 | 27-Apr-11 | |
| INSULIN GLARGINE | 682327 | 64832053 | 18-Dec-12 | 18-Dec-12 | N | 1002923273 | 4 | 13-Mar-13 | 13-Mar-13 | |
| INSULIN GLARGINE | 682327 | 64832053 | 13-Mar-13 | 13-Mar-13 | Y | 1002923273 | 5 | 13-Mar-13 | 13-Mar-13 |
5.3. General Analysis
Given our focus on GLP-1RA and insulin, to facilitate further analysis, from the cohort of all T2DM patients we selected those who at any point in their medical history received treatment with either of the two drugs of interest. Text mining of drug names in MD table revealed various insulin regimens as well as related devices (e.g. insulin syringe). To quantify the result, we found that approximately 30% of the patients in the T2DM cohort received at least one prescription for insulin drug. Interestingly, a large number of patients (~25,000) were found to have received prescriptions for insulin devices but not for insulin therapy itself. Further exploration on these patients revealed that the average duration of use of these devices in this patient group was 21 months (Table 5), strongly suggesting that there was an accompanying insulin therapy which was not recorded in the stored EMRs. This conclusion is further corroborated by the finding that the mean glycated haemoglobin (HbA1c) level for these patients was measured to be 7.8% on the date of the first record associated with the device.
The number of patients receiving insulin and GLP-1RA, and the corresponding treatment duration estimates (in months) produced by our algorithms (“chaining” and “continuous”), are summarized in Table 5. Different insulin regimens were treated jointly, as we found that any finer level of detail is poorly recorded in the database. As regards to GLP-1RA treatment, only three different GLP-1RA drugs (namely, Exenatide, Liraglutide, and Albiglutide) have been used. Being new to the market (introduced in 2014), only limited data was available for Albiglutide treatment.
The estimate of the proportion of patients identified as having received specific individual drugs was found to be very similar using both the “chaining” approach, as well as the non-chain ID based alternative “continuous” approach, as shown in Table 5. The corresponding values of the key statistics – namely the mean, standard deviation (SD), median, and the interquartile range (IQR)- of the respective estimates of the duration of treatment with individual drugs were also similar. The average differences in the estimated duration of treatment with insulin only and GLP-1RA drugs were 0.3 month and 1 month respectively. There were no differences at the median levels. Separate analyses for patients with minimum 2 months of treatment duration with individual therapies also revealed the same results. However, it is important to note that although the cumulative statistics of the estimated treatment durations with different therapies were not significantly different, we did find notable differences in the minimum and maximum duration estimates for specific patient subgroups, as evident from (Table 5).
6. DISCUSSION
In this work we addressed a number of challenging data mining related issues while extracting patient-level longitudinal information on prescription patterns and medication usages from large relational databases (our data set comprises more than a billion records). There are several key contributions of note. Firstly we identified the specific challenges which automatic methods must deal with in the processing of this complex voluminous data. We corroborated our arguments using analysis of real-world EMRs and discussed the importance and the implications of being able to handle erroneous and incomplete longitudinal information. Secondly, we introduced two methods for the estimation of the duration of treatment with specific drug(s) in the presence of the aforementioned challenges. Developed sequentially ordered case by case rules were presented mathematically. To the best of our knowledge, no robust algorithmic approach has yet been reported to evaluate treatment duration with individual medications in multiple treatment scenario [22, 27].
We have described two algorithmic approaches to estimate treatment duration on the individual record level. First method (“chaining”) relies on specific chaining fields of medication information, while second approach (“continuous”) does not use chain related information and employs only chronological record information instead. Our results on the large Centricity EMR database show that the two approaches do not produce significantly different results on average at population level. However, when examined in detail, the “chaining” method could identify the treatment alterations longitudinally and was shown to be more robust at individual patient level. Furthermore, treatment duration estimates from the “continuous” approach are more sensible to the set of selected medications. The difference between methods is particularly prominent in studies involving multiple drugs as opposed to single drug therapies or focusing on the order of treatment initiation [48, 49].
Our study highlighted the potential risk of underestimating the duration of treatment when EMR data is used directly, due to erroneous or incomplete data emerging from omissions in the data entry process, appointments missed by patients, typographical errors, or numerous others. Both proposed algorithms robustly handle these challenges whenever is possible, estimating values of the missing or erroneous entries. Importantly, being rule based, the decisions of our algorithms are readily interpretable by humans and lend themselves to effortless use by medical professionals not necessarily proficient in data mining and related disciplines. Both approaches implement two fact datasets available in the Centricity EMRs, however algorithms are easily adjusted in case of only one available dataset.
CONCLUSION
This study discusses the challenges in exploring the prescription / medication patterns for individual patients in large primary / ambulatory care electronic databases, and introduces two algorithmic approaches for robust estimation of treatment duration with individual drug(s). We have demonstrated that implementing chaining fields of medication information additionally improve the quality of estimates. Given the importance of extracting medication information appropriately in pharmaco-epidemiological studies based on real world data, the proposed algorithms has the potential to significantly contribute to the analytical quality aspects in the future EMR based clinical and epidemiological studies.
LIST OF ABBREVIATIONS
| EMR | = Electronic Medical Rerecords |
| CEMR | = Centricity Electronic Medical Rerecords |
| T2DM | = Type 2 Diabetes |
| MD | = Medication Dimension |
| MF | = Medication Fact |
| PF | = Prescription Fact |
| GPI | = Generic Product Identifier |
| ID | = Identification |
| DOB | = Date of Birth |
| SD | = Standard Deviation |
| IQR | = Interquartile Range |
| GLP-1RA | = Glucagon-Like Peptide-1 Receptor Agonist |
ETHICS APPROVAL AND CONSENT TO PARTICIPATE
Not applicable.
HUMAN AND ANIMAL RIGHTS
No Animals/Humans were used for studies that are base of this research.
CONSENT FOR PUBLICATION
Not applicable.
CONFLICT OF INTEREST
Sanjay K. Paul (SKP) has acted as a consultant and/or speaker for Novartis, GI Dynamics, Roche, AstraZeneca, Guangzhou Zhongyi Pharmaceutical and Amylin Pharmaceuticals LLC. He has received grants in support of investigator and investigator initiated clinical studies from Merck, Novo Nordisk, AstraZeneca, Hospira, Amylin Pharmaceuticals, Sanofi-Avensis and Pfizer. Olga Montvida (OM) and Ognjen Arandjelovic (OA) has no conflict of interest to declare. Edward Reiner (ER) was an employee of Quintiles and was responsible for the strategic development of the Centricity EMR database.
ACKNOWLEDGEMENTS
Olga Montvida (OM) and Sanjay K. Paul (SKP) conceived the idea and were responsible for the primary design of the study and the methodological developments. Ognjen Arandjelovic (OA) and Edward Reiner (ER) evaluated the methodological approach. Olga Montvida (OM) conducted the data extraction and statistical analyses. The first draft of the manuscript was developed by Sanjay K. Paul (SKP) and Olga Montvida (OM), and all authors contributed to the finalization of the manuscript. Sanjay K. Paul (SKP) had full access to all the data in the study and takes responsibility for the integrity of the data and the accuracy of the data analysis.
Melbourne EpiCentre gratefully acknowledges the support from the Australian Government’s National Collaborative Research Infrastructure Strategy (NCRIS) initiative through Therapeutic Innovation Australia. No separate funding was obtained for this study.

