
Predicting Sepsis in the Intensive Care Unit (ICU) through Vital Signs using Support Vector Machine (SVM)
Abstract
Background:
As sepsis is one of the life-threatening diseases, predicting sepsis with high accuracy could help save lives.
Methods:
Efficiency and accuracy of predicting sepsis can be enhanced through optimal feature selection. In this work, a support vector machine model is proposed to automatically predict a patient’s risk of sepsis based on physiological data collected from the ICU.
Results:
The support vector machine algorithm that uses the extracted features has a great impact on sepsis prediction, which yields the accuracy of 0.73.
Conclusion:
Predicting sepsis can be accurately performed using the main vital signs and support vector machine.
1. INTRODUCTION
Sepsis occurs when the patient body releases chemicals into the bloodstream to fight an infection triggering an inflammatory response that causes tissue damage, organ failure, or death [1-3]. Sepsis is thought to be present in more than half of ICU patients in hospitals that lead to death [4]. Early sepsis prediction and detection would likely have an impact on mortality rates. As reported widely, the mortality rates increase with each hour of delay in receiving the antibiotics treatment [5].
In this paper, we propose a machine learning approach to predict sepsis, where machine learning techniques can help improving Sepsis prediction [6]. The used performance metrics are accuracy, precision, and recall. The used dataset is prepared by the PhysioNet Challenge 2019 [7-9] collected from the ICU Patients. The dataset is highly imbalanced, so that’s why we used the under-sampling method.
This paper is presented as follows: Section 2 contains a brief description of the dataset used, and the features selected, section 3 includes the proposed sepsis prediction methodology, section 4 presents the results, and section 5 contains the conclusion and future work.
2. DATASET AND FEATURE EXTRACTION
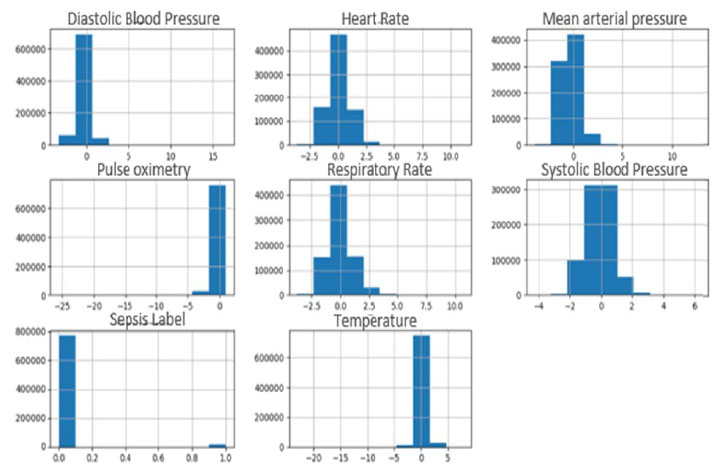
The PhysioNet challenge 2019 provided two publicly available datasets (A and B) collected from ICU patients in two different hospitals. Dataset A includes 20,336 patients, and dataset B includes 20,000 patients. Each file in the datasets contains the records of one patient during the stay in ICU where samples were collected every hour. These features (total 40 features) consist of three groups which are: Vital signs, laboratory values, and demographics [7-9]. Data extracted from the Electronic Medical Record (EMR) underwent a series of preprocessing steps prior to formal analysis and model development. All patient features were condensed into hourly bins simplifying model development and testing, e.g., multiple heart rate measurements in an hourly time window were summarized as the median heart rate measurement [7]. In this paper, only the vital signs features were used as these features can be easily obtained near the bed of the ICU patient [10, 11]. These features are Heart Rate (HR), Pulse oximetry (O2Sat), Temperature (Temp), Systolic BP (SBP), Arterial Pressure (MAP), Diastolic BP (DBP), and Respiration Rate (Resp). A histogram for each of these features selected from dataset A is represented in Fig. (1).
A histogram for each of these features selected from dataset B is represented in Fig. (2).
3. METHODOLOGY
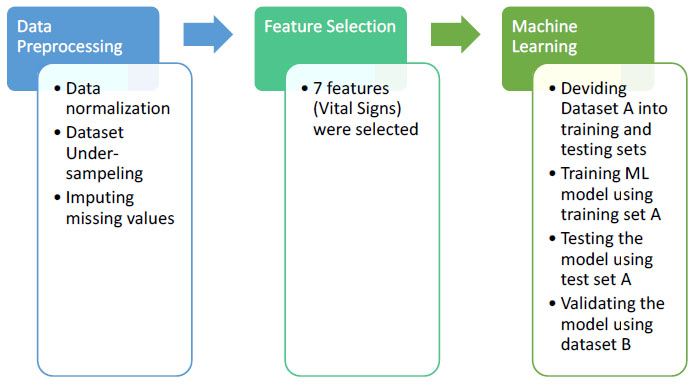
The aim of this paper is to develop an automated model that can predict sepsis accurately using vital signs. The developed methodology is applied to dataset A and dataset B from the PhysioNet Challenge 2019. This methodology is represented in Fig. (3). The first step in this methodology is data preprocessing. The second step is feature selection. The third step is applying the supervised machine learning approach, evaluating the methodology using the test set A, and validating the methodology using dataset B. Each of these steps will be explained in the following sub-sections. The proposed methodology is implemented by the Python language, version 3.8, using the libraries: SckitLearn, Pandas, Matplotlib, Numpy through Anaconda 3.

3.1. Data Preprocessing
For each one of the vital sign features, data values were standardized by subtracting the mean of all values from each feature value and dividing by the standard deviation of each feature.
The dataset is highly imbalanced, where only 1.8% of the patient records have sepsis. In order to handle the dataset imbalance, the under-sampling method was used, where the class (does not have sepsis) was down-sampled to the class (have sepsis); so that both classes have the same number of records which is 17136 records.
The missing values were imputed using the mean value of the population, calculated from both datasets A and B.
After data preprocessing phase, dataset A’s shape report is presented in Table 1.
After data preprocessing phase, dataset B’s shape report is presented in Table 2.
3.2. Feature Selection
Seven features were selected, which are Heart Rate (HR), Pulse Oximetry (O2Sat), Temperature (Temp), Systolic Blood Pressure (SBP), Mean Arterial Pressure (MAP), Diastolic Blood Pressure (DBP), and Respiration rate (Resp). These features are selected using forests of trees to evaluate the importance of our dataset features. The tree-based feature selection used in our experiment computes the impurity-based feature importance, which in turn can be used to discard irrelevant features when coupled with the Extremely Randomized Tree (Extra Trees) classifier [12]. The feature selection technique is applied to dataset A, resulted in eleven features which are HR, O2Sat, Temp, SBP, MAP, DBP, Respiration rate, Age, ICU length of stay, hospital admit time, Fraction of inspired oxygen. It is noted that seven of these eleven features represent vital signs. In this paper, we selected the features of the vital sign as these features are easily captured at the bedside by ICU equipment.
3.3. Machine Learning
Dataset A was divided into training and testing sets, then a machine learning algorithm is trained using the training set A, then this learning algorithm is evaluated through calculating the accuracy using the testing set A, and finally validating the methodology using dataset B. Experiments were made, and Support Vector Machine [13] proved to get the highest accuracy. The following machine learning approaches were used in those experiments; K-Nearest Neighbor [14], Naïve Bayes [15], Logistic Regression [16], Linear Discriminant Analysis [17], Decision Tree [18], Random Forest [19].
4. RESULTS AND DISCUSSION
Precision, recall, and F1-score are three metrics used for evaluating the proposed methodology. The precision is the ratio of correctly classified positive records (True Positive) to the total classified positive records (True Positive + False Positive). The recall is the ratio of correctly classified positive records (True Positive) to all records in a class (True Positive + False Negative). The F1-score conveys the weighted balance between the precision and the recall [20].
Various experiments were conducted before getting the final results and proving that SVM is best suitable for this work. These results can be found in Table 3. These results are for evaluating these experiments using the testing set A.
The support vector machine proved to be the best learning model. The accuracy obtained from running SVM is 62%. The total number of records that were correctly predicted to have sepsis is 1836, the number of records that were wrongfully predicted to have sepsis is 1046, the number of records that were correctly predicted to do not have sepsis is 2342, and the number of records that were wrongfully predicted to do not have sepsis is 1631.
The results for validating these experiments using dataset B are found in Table 4.
| - | Heart Rate | Pulse Oximetry | Temperature | Systolic Blood Pressure | Mean Arterial Pressure | Diastolic Blood Pressure | Respiratory Rate |
|---|---|---|---|---|---|---|---|
| Count | 790215.00 | 790215.00 | 790215.00 | 790215.00 | 790215.00 | 790215.00 | 790215.00 |
| Mean | 0.056750 | 0.062320 | 0.108375 | -0.183601 | -0.405718 | -0.229251 | 0.008720 |
| Std. | 0.922067 | 0.904777 | 0.674996 | 0.819226 | 0.867168 | 0.680114 | 1.089660 |
| Min | -3.620497 | -25.54520 | -23.06817 | -4.289265 | -3.982404 | -3.282423 | -3.769108 |
| 25% | -0.560903 | -0.348772 | 0.000000 | -0.749996 | -1.038736 | -0.583004 | -0.792601 |
| 50% | 0.000000 | 0.000000 | 0.000000 | -0.091527 | 0.437988 | 0.000000 | 0.000000 |
| 75% | 0.572280 | 0.645824 | 0.000000 | 0.196553 | 0.000000 | 0.000000 | 0.483045 |
| Max | 11.11088 | 0.977356 | 7.852792 | 6.369697 | 12.83856 | 16.46596 | 10.68821 |
| - | Heart Rate | Pulse Oximetry | Temperature | Systolic Blood Pressure | Mean Arterial Pressure | Diastolic Blood Pressure | Respiratory Rate |
|---|---|---|---|---|---|---|---|
| Count | 761995.00 | 761995.00 | 761995.00 | 761995.00 | 761995.00 | 761995.00 | 761995.00 |
| Mean | 0.012067 | 0.018718 | 0.059284 | 0.013265 | 0.003915 | 0.001651 | -0.009594 |
| Std. | 0.941526 | 0.910823 | 0.643600 | 0.936755 | 0.930428 | 0.938199 | 0.891222 |
| Min | -3.620497 | -25.54520 | -9.870196 | -4.371574 | -3.381656 | -3.282423 | -3.769108 |
| 25% | -0.617562 | -0.348772 | 0.000000 | -0.626533 | -0.618212 | -0.583004 | -0.579994 |
| 50% | 0.000000 | 0.000000 | 0.000000 | 0.000000 | 0.000000 | 0.000000 | 0.000000 |
| 75% | 0.515621 | 0.645824 | 0.000000 | 0.525787 | 0.463135 | 0.447038 | 0.270437 |
| Max | 7.201401 | 0.977356 | 19.13633 | 7.151629 | 12.83856 | 16.60804 | 17.27905 |
| Machine Learning Model | Class/Label | Precision | Recall | F1-Score |
|---|---|---|---|---|
| K-Nearest Neighbor, K = 9 | Don’t Have Sepsis patients | 0.99 | 0.62 | 0.76 |
| Have Sepsis patients | 0.04 | 0.64 | 0.07 | |
| Naïve Bayes | Don’t Have Sepsis patients | 0.56 | 0.73 | 0.63 |
| Have Sepsis patients | 0.62 | 0.43 | 0.51 | |
| Logistic Regression | Don’t Have Sepsis patients | 0.58 | 0.65 | 0.61 |
| Have Sepsis patients | 0.61 | 0.53 | 0.57 | |
| Linear Discriminant Analysis | Don’t Have Sepsis patients | 0.58 | 0.66 | 0.61 |
| Have Sepsis patients | 0.61 | 0.53 | 0.57 | |
| Decision Tree | Don’t Have Sepsis patients | 0.56 | 0.62 | 0.59 |
| Have Sepsis patients | 0.58 | 0.52 | 0.55 | |
| Random Forest | Don’t Have Sepsis patients | 0.61 | 0.66 | 0.64 |
| Have Sepsis patients | 0.64 | 0.59 | 0.62 | |
| SVM | Don’t Have Sepsis patients | 0.59 | 0.69 | 0.64 |
| Have Sepsis patients | 0.64 | 0.53 | 0.58 |
| Machine Learning Model | Class/Label | Precision | Recall | F1-Score |
|---|---|---|---|---|
| K-Nearest Neighbor, K = 9 | Don’t Have Sepsis patients | 0.99 | 0.62 | 0.76 |
| Have Sepsis patients | 0.02 | 0.50 | 0.04 | |
| Naïve Bayes | Don’t Have Sepsis patients | 0.99 | 0.73 | 0.84 |
| Have Sepsis patients | 0.02 | 0.46 | 0.04 | |
| Logistic Regression | Don’t Have Sepsis patients | 0.99 | 0.72 | 0.83 |
| Have Sepsis patients | 0.02 | 0.45 | 0.04 | |
| Linear Discriminant Analysis | Don’t Have Sepsis patients | 0.99 | 0.72 | 0.84 |
| Have Sepsis patients | 0.02 | 0.45 | 0.04 | |
| Decision Tree | Don’t Have Sepsis patients | 0.99 | 0.59 | 0.74 |
| Have Sepsis patients | 0.02 | 0.47 | 0.03 | |
| Random Forest | Don’t Have Sepsis patients | 0.99 | 0.62 | 0.76 |
| Have Sepsis patients | 0.02 | 0.50 | 0.04 | |
| SVM | Don’t Have Sepsis patients | 0.99 | 0.70 | 0.82 |
| Have Sepsis patients | 0.02 | 0.49 | 0.04 |
After the support vector machine was trained using the training set A and evaluated using the test set A, it was then reevaluated (to validate the results) using dataset B. The results are still considering the SVM best learning model, where the accuracy obtained is 73%. The total number of records that were correctly predicted to have sepsis is 5258, the number of records that were wrongfully predicted to have sepsis is 223754, the number of records that were correctly predicted to do not have sepsis is 527461, and the number of records that were wrongfully predicted to do not have sepsis is 5522.
CONCLUSION AND FUTURE WORK
Predicting Sepsis is still a challenging problem as its manifestation cannot be determined till the last stages. In this paper, a methodology is proposed for predicting sepsis. This methodology is composed of three stages; data pre-processing, feature selection, and machine learning. From the results obtained, we can conclude that the main vital signs can be used to predict sepsis, where the methodology proved to be an effective predictor for sepsis by obtaining an accuracy of 73%.
In future work, we are going to apply the proposed methodology to predict sepsis to different datasets using different features, and enhance the accuracy.
ETHICS APPROVAL AND CONSENT TO PARTICIPATE
This study was approved by the Ethics Committee of Ain Shams University, Cairo, Egypt.
HUMAN AND ANIMAL RIGHTS
No animals were used in this research. All human research procedures were followed in accordance with the ethical standards of the committee responsible for human experimentation (institutional and national), and with the Helsinki Declaration of 1975, as revised in 2013 (http://ethics.iit.edu/ecodes/node/3931).
CONSENT FOR PUBLICATION
Not applicable.
AVAILABILITY OF DATA AND MATERIALS
The data supporting the findings of the article are available at https://physionet.org/content/challenge-2019/1.0.0/?fbclid =IwAR2xKZQga9_eB3um0dAwhZ3DIIfdQDsoMOwzizfgKzIPK6uUX44ak7bjucg.
FUNDING
None.
CONFLICT OF INTEREST
The authors declare no conflict of interest, financial or otherwise.
ACKNOWLEDGEMENTS
Declared none.

