
An Approach to Early Diagnosis of Pneumonia on Individual Radiographs based on the CNN Information Technology
Abstract
Aim:
This study investigates the topology of convolutional neural networks and proposes an information technology for the early detection of pneumonia in X-rays.
Background:
For the past decade, pneumonia has been one of the most widespread respiratory diseases. Every year, a significant part of the world's population suffers from pneumonia, which leads to millions of deaths worldwide. Inflammation occurs rapidly and usually proceeds in severe forms. Thus, early detection of the disease plays a critical role in its successful treatment.
Objective:
The most operating means of diagnosing pneumonia is the chest X-ray, which produces radiographs. Automated diagnostics using computing devices and computer vision techniques have become beneficial in X-ray image analysis, serving as an ancillary decision-making system. Nonetheless, such systems require continuous improvement for individual patient adjustment to ensure a successful, timely diagnosis.
Methods:
Nowadays, artificial neural networks serve as a promising solution for identifying pneumonia in radiographs. Despite the high level of recognition accuracy, neural networks have been perceived as black boxes because of the unclear interpretation of their performance results. Altogether, an insufficient explanation for the early diagnosis can be perceived as a severe negative feature of automated decision-making systems, as the lack of interpretation results may negatively affect the final clinical decision. To address this issue, we propose an approach to the automated diagnosis of early pneumonia, based on the classification of radiographs with weakly expressed disease features.
Results:
An effective spatial convolution operation with several dilated rates, combining various receptive feature fields, was used in convolutional layers to detect and analyze visual deviations in the X-ray image. Due to applying the dilated convolution operation, the network avoids significant losses of objects' spatial information providing relatively low computational costs. We also used transfer training to overcome the lack of data in the early diagnosis of pneumonia. An image analysis strategy based on class activation maps was used to interpret the classification results, critical for clinical decision making.
Conclusion:
According to the computational results, the proposed convolutional architecture may be an excellent solution for instant diagnosis in case of the first suspicion of early pneumonia.
1. INTRODUCTION
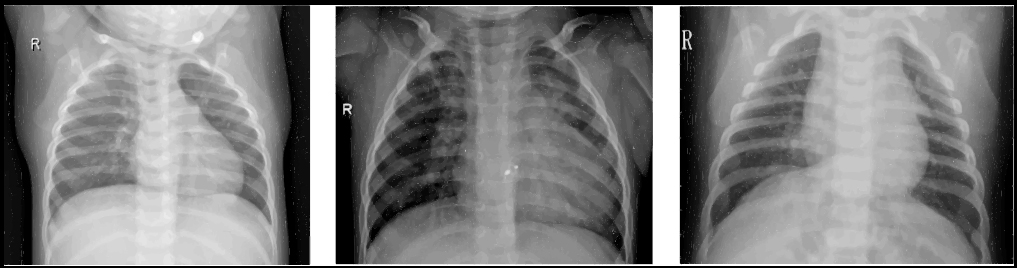
Pneumonia is a severe disease of people of all ages around the world. According to the World Health Organization (WHO), nearly 2 million deaths from pneumonia are reported yearly [1]. A severe pandemic of the COVID-19 coronavirus in early 2020 further exacerbated the death of lung diseases. Numerous clinical studies have confirmed that COVID-19 infection causes severe pneumonia in a significant number of people [2, 3]. At the same time, bacterial and viral pathogens cause various pneumonia forms, requiring different treatment approaches [4]. Bacterial pneumonia can be treated instantly with antibiotics; simultaneously, patients with viral pneumonia require additional support and treatment, making early and accurate diagnosis especially valuable [5]. Chest X-ray analysis is one of the most common methods of diagnosis and differentiation of pneumonia [6]. Fig. (1) shows examples of X-rays with healthy and pneumonia-infected lungs.
Applying preventive measures to diagnose lung diseases is the key to effective treatment. Even in the absence of the first external symptoms of pneumonia (cough, difficulty breathing, high body temperature (39°), rapid breathing), it is possible to detect its origin on X-rays [7-10]. The result of diagnosing pneumonia with radiographs is possible in three main conditions: perfectly healthy lungs without any visible features of the disease, clearly pneumonia with bright manifestations in the image, and an intermediate condition in which the prominent pneumonia features are not presented. Simultaneously, a chest radiograph is taken for prophylactic purposes or if there is a suspicion of early manifestations of viral pneumonia [10-12]. Therefore, an individual approach to digital diagnosis is to identify the first manifestations of pneumonia on X-rays.
The main features of viral pneumonia in X-ray are [13]:
- Complete loss of transparency of lung tissue (complete darkening of the pulmonary field).
- Eclipse of one or more parts of the lung (sub complete eclipse).
- Eclipse, which is within one segment of the lung (limited eclipse).
Pathological changes in the lungs during pneumonia correspond to four stages [14]: inflow of fluid to the lungs, red pulmonary seal, gray deepening, and thinning. The early stage of pneumonia includes flushing and pulmonary compaction.
The inflow stage lasts 12-72 hours and is characterized by intense blood flow to the lungs' vascular system, decreased functional activity, and alveolar exudate formation. An X-ray can show an increase in the pulmonary image's intensity and clarity, a slight darkening of the pulmonary fields in localization of pathological changes, and an increase in the lung root with a simultaneous loss of its structure [15]. The chest scan in the first stage of the disease, due to the lungs' filling with blood, resembles a lattice (cellular lung).
The red seal stage usually lasts from 24 to 72 hours. We may observe the compaction of interstitial tissue during this period, which in structure begins to resemble the liver. A certain amount of blood (erythrocytes) appears in the exudate. The radiological picture has only slight differences from the first stage: the pulmonary image is less pronounced but enlarged, the pulmonary contours become darker (the effect of “frosted glass”).
For the most part, pneumonia can be detected at the initial stages of development only by comparing images taken at intervals of 1-2 days [16]. However, a significant disadvantage of radiographs, as a means of early diagnosis of viral pneumonia, is the limited range of colors, consisting of different shades of gray [11]. Also, due to the high intensity of the film's white wavelength, the fluid in the lungs at the tide stage is quite tricky to identify as a dense and complex tissue [17]. In other words, the visual transition from air-filled tissue (normal lung condition), which is visible in darker shades, to distinctly compacted tissue requires enough fluid to shift the overall color scheme of the image to lighter shades. As a result, preventive actions to detect viral pneumonia are complicated by the limited color scheme of radiographs and, consequently, the weak expression of the disease's features in the image.
Another problem in the early diagnosis of pneumonia is the human factor. Radiologists must have extensive expertise to distinguish the heterogeneous color distribution of air in the lungs. Such a distribution can be clearly expressed on the radiograph in various gray shades but simultaneously does not correspond to the pneumonic fluid. Therefore, specialists must determine whether the white spots on the X-ray film correspond to the liquid. According to the experience of radiologists [18-20], both false positive and false negative diagnoses can considerably harm human health. Thus, the use of computational methods and the introduction of automated diagnostic systems at an early stage of the disease can significantly increase the chances of correct diagnosis and, as a result, increase the reliability of preventive measures and further treatment.
Automated Diagnostic Tools (ADTs) aim to complement the clinical decision-making process, considering the study of information adequacy [21] and its noise immunity [22]. They combine Computer Vision (CV) and Artificial Intelligence (AI) systems with X-ray image processing to detect patterns in images [23]. Modern digital diagnostic systems work based on Machine Learning (ML) methods [24], which detect and describe specific disease features in the image. Such methods are optimized for specific datasets and are trained to identify predetermined changes in the size of the Region of Interest (ROI), orientation, and position on X-rays. Note that in recent years, methods based on the detection and classification of characteristics [25, 26], particularly hyperplane classification [27, 28], using Deep Learning (DL) [18, 20, 23, 29] have been widely spread.
Different CV issues in medical image processing have usually been addressed with convolutional neural networks (CNNs). Over the past years, various modifications of convolutional architectures have received considerable recognition [30-32]. Furthermore, based on novel comparative studies [33-35], it can be claimed that CNNs mostly outperform traditional ML techniques in medical imaging tasks. A key CNN's benefit is a combination of sequentially placed different processing layers to detect hierarchical features of objects from the input pixel data [36]. The network's initial layers abstract the features of the targeted object using diverse pixel manipulation techniques [37], such as receptive fields' localization, weight distributions and sharing, subsampling, pooling, and normalization. The successful synergy of different obtaining mechanisms provides a holistic view of investigated objects in the images ensuring high classification. Considering all possible medical image processing methods, a CNN was chosen as the underlying feature extractor the automated pneumonia detection.
Although DL methods demonstrate significant achievements in various medical imaging problems, the lack of robust interpretation limits their medical diagnosis potential. For instance, the insufficiently studied behavior of the CNN model limits its use in everyday clinical practice [38]. To date, there is still no clear understanding of the features of pneumonia on an X-ray that indicate the models of CNN about the presence of the disease. Accordingly, it is not clear how to design and specify a proper CNN topology for individual pneumonia diagnosis in the early stages. Therefore, the presented study is devoted to the early pneumonia detection and interpretation in the chest X-rays.
2. RELATED WORK
In recent years, the scientific community has presented many works on using machine diagnosis of pneumonia on chest radiographs. For example, in [39], active contour algorithms were used to detect the entire lung zone, and then this zone was divided into 40 ROIs. As a result of applying the two-dimensional Daubechies wavelet transform and the analysis of the main components, each region's components were removed and compared to the predicted area. In this way, the authors could segment the chest image and present ROIs with possible lung disease features. The study [40] is devoted to the identification of pneumonia using a modified threshold value Otsu. The presented threshold value makes it possible to separate the healthy part of the lung from the manifestations of frosted glass in the image, signaling the disease's presence. The study [41] presents an automated diagnostic system that uses the procedure of X-ray voxel differentiation for sequential extraction of pneumonia features in pre-prepared areas of interest. Simultaneously, the method of reference vectors was used to train and mark the pulmonary parenchyma's ROIs, guided by the characteristics of the image's texture and shape. This approach made it possible to achieve a classification accuracy of 91%, which exceeded the radiologists' results at the time.
However, despite the decent results of traditional short circuit methods in the digital diagnosis of pneumonia, they do not reveal a few essential points. First, it is necessary to specify the ROIs manually, but it is not clear how many of them are sufficient to cover all the pneumonia features. Furthermore, it is unknown which types of textures are most significant for early pneumonia, given the blurring of the X-ray image's features. Besides, for new forms of pneumonia, such as those caused by COVID-19 [10, 14, 42], it is necessary to improve the level of chest segmentation in the image while maintaining a high level of interpretation of the results. In general, traditional CV techniques require significant image preprocessing and manual intervention to remove specific visual features before classification. Over the past few years, such issues have been primarily addressed with DL methods, mainly using CNNs.
In [43], a modified CNN is presented, configured to localize the ROI based on a gradient for the detection and spatial localization of pneumonia. In addition, the authors of this work have released an extensive collection of datasets of frontal X-rays with a size of 112,120 images. At the time of writing, the authors achieved an accuracy of detecting pneumonia in 63.3%. In [18], the gradient imaging method combined with heat maps was applied to the ROI's localization to identify pneumonia. The authors used a 121-layer tightly coupled neural network to assess the likelihood of disease and achieved an AUC of 76.8%. In another paper [44], the authors focused on visualizing the process of detecting pneumonia, using Class Activation Maps (CAMs) to interpret the results of an automated diagnostic system. As a result of VGG19 [45] modification, they achieved 93.6% of classification accuracy, and their imaging approach revealed what features CNN considers the most significant for the clinical decision. Another approach to visualizing and interpreting deep learning is fully-connected CNN, specifically, the U-Net architecture. For example, the study [46] proposes a modified U-Net architecture with convolutional kernels of 3 × 3 × 3 to segmentation abdominal organs in volumetric images of computed tomography.
Over the last few years, an approach called transfer learning has become popular, which involves transferring the values of the weights of a network trained on a single dataset to a target model of a specific task. For example, the study [7] applied a transfer training method to a 36-layer CNN to effectively classify pneumonia on a small dataset and used gradient-based CAMs to interpret the automated diagnosis output. On a small training dataset of 5232 X-rays, such CNN achieved a classification accuracy of 96.4%. In a recent study [47], the authors proposed an automated system for diagnosing pneumonia and COVID-19 by developing a transfer training method using a small number of COVID-19 X-rays. The proposed multilayer CNN uses in-depth convolution with various dilated coefficients to effectively extract targeted features from radiographs.
Furthermore, discriminant gradient-based localization is integrated to separate ROIs that may signal the presence of pneumonia. At present, the in-depth convolution approach seems to be the most promising for the early diagnosis of pneumonia without significant expansion of the neural network topology. A novel study [48] presents an ensemble approach combining AlexNet architecture as a feature extractor, Relief algorithm for efficient feature selection, and Support Vector Machine (SVM) as a final classification layer. This approach demonstrated notable results, achieving validation accuracy of 96-97% depending on different datasets. Nonetheless, despite the successful implementation of CNN architecture in pneumonia detection, few studies have addressed the early diagnosis.
All mentioned detection methods and approaches were based on extensive multilayer CNN architectures. However, multilayer networks do not always provide sufficient coverage of receptive fields [49]; as a result, they may not extract inconspicuous texture features in the image while remaining heavy and challenging to operate. Additionally, neural networks have been perceived as black boxes due to vague interpretation of their performance results. Altogether, a heavy and frail computational model with insufficient explanation for the early diagnosis can be perceived as a severe negative feature of automated decision-making systems, as the lack of interpretation results may negatively affect the final clinical decision. Thus, to address these issues, we propose an individual approach to the automated diagnosis of early pneumonia based on a simple yet efficient DL model and straightforward interpretation technique.
3. MATERIALS AND METHODS
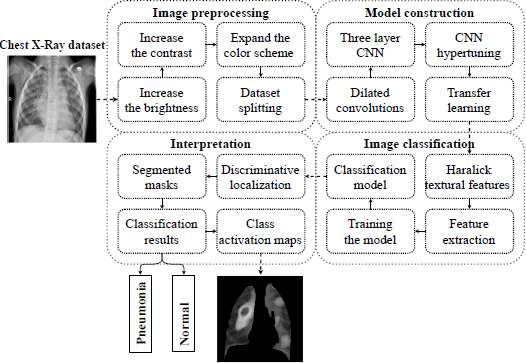
The presented study consists of three aspects: first, the approach to detecting early pneumonia features on X-rays, second, the method of interpreting the extracted features of early disease, and third, substantiating the effectiveness of the proposed approach based on computational experiments. In particular, in this section, we present and describe the methodology of an individual approach to detecting pneumonia in the early stages. It should be noted that the idea of diagnosis of early pneumonia on individual radiograms was primarily proposed in our previous work [50]. In general, the idea of an individual approach is presented by the conceptual model in Fig. (2).
According to the analysis of the related work from the previous section, the CNN architecture has been considered the most prominent feature extractor so far; thus, it was chosen as the core for disease identification.
3.1. The Modification of the Convolutional Layer
First, we will form the task of detecting pneumonia on X-rays. The following image features are most used in image processing: target color, object shape, texture, and objects' relationship in space. The main difference between different types of pneumonia from healthy lungs in the image is the lungs' textural features. Despite the intuitive choice of feature textures to identify the image's disease, there is no clear standard for defined textures. Unlike image features such as grayscale and color, textures are grayscale distribution relative to a particular pixel and its space. Therefore, we present the texture as a constant repetition of local space in the image.
The convolution kernel is a typical example of the mechanism of extraction of features. In a convolutional layer consisting of a plurality of filters, each neuron's input is connected to the previous layer's local receiving area, which allows removing local features in the image. The approach based on local connections has been repeatedly successfully applied to many texture analyses [51]. Therefore, due to the convolutional layer's modification, it is possible to remove the textures' local features effectively. However, the texture does not always entirely reflect the object's essential properties; thereby, using only the texture features to obtain a higher level of image content might not be the right approach. As the depth of the model increases, the feature map resolution gradually decreases, and the texture highlighted by the convolution kernel may have significant deviations.
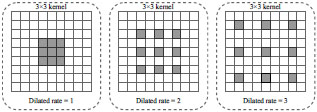
According to clinical diagnosis [4, 6, 12], the features of X-ray pneumonia can be either highly compacted or diffusely distributed throughout the lung plane. Therefore, there is a need to consider the disease's features at different observation levels. For instance, in [52], it is proposed to use a new type of convolution, called dilated convolution, to enlarge the convolution's receptive field without increasing the convolution kernels' total number of parameters. Fig. (3) illustrates dilated operations with different dilated rates.
Due to the expansion's peculiarity, various disease features, removed from various convolutions with several dilated rates, will accumulate more diversity. The traditional convolution can be divided into in-depth and dotted, one after the other. When performing deep (spatial) convolution, each input channel is individually processed by separate filters. Next, a point (traditional) convolution with 1 × 1 kernels is performed to integrate deep convolution results into the new space. This approach makes the extraction process computationally efficient with a small number of convolutions [47].
In this study, we propose to apply dilated convolutions consistently with point convolutions. First, the dot convolution passes through a map of input characteristics to project information from many input channels into a more expansive space. The image is then produced through numerous deep convolutions with different spatial kernels and different dilated rates, from 1 to the maximum value of the dilation rate. The rate's value is adjusted according to the input feature map's shape to cover all the necessary receptive fields. As a result, in-depth convolutions extract spatial features from various receptive fields, from very condensed to generalized features. Then all the disparate features go through the next point convolution to merge into a narrow space. Such a procedure leads to removing even a few visible features of pneumonia in the image using only a few convolutional layers, which allows designing individual CNN architectures.
3.2. The Neural Network Architecture
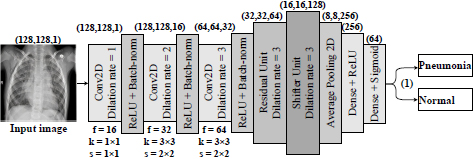
In this work, the proposed architecture is CNN. In this case, the balance is the difference between the actual observed value and the calculated value. The idea is to adjust the CNN to study minor changes removed by the rest of the convolutional layer. Therefore, we formulate a hypothesis according to which an individual approach to the medical image analysis should be based on preserving the necessary information about the textural features of pneumonia and the simplicity of the computational model. To prove this hypothesis, we propose and investigate a three-layer residual CNN with skipping connections and dilated convolutions as feature extractions. The scheme of the proposed CNN architecture is presented in Fig. (4).
Thus, the network receives a set of images of 128 × 128 pixels after their preprocessing collapsing in a sequence of three convolutional layers. Simultaneously, convolutional filters contain 3 × 3 kernels [53] with the ReLU activation function [54]. In this way, the neurons' small size relative to the input signal's entire receptive field is provided. Accordingly, it provides an opportunity to cover the local features of the texture of pneumonia.
This approach should ensure consistent network resolution and minimize image space resolution loss. As we see from Fig. (3), the dilated convolutional kernel can increase the kernel's receptive field without increasing the kernel parameters and allows avoiding excessive loss of feature map resolution. The ReLU activation function was utilized after each convolutional layer. Moreover, a normalization layer follows each convolution so that the nonlinear transformation function's input value falls into the region that is sensitive to the input data. Such an approach may avoid the problem of gradient disappearance and speeds up network learning. A dropout layer with a parameter of 0.5 has been added to prevent the model from being retrained. This layer accidentally stops the training of half of the neurons each time the training is updated and prevents hidden neurons' dependence on specific inputs. Next, we have an averaged pooling layer, which calculates each feature map's average value for the last original convolution layer. The output feature set is equal to the number of feature maps of the global average pooling layer and is forwarded to two dense (fully-connected) layers. The first dense layer has 256 nodes with ReLU activation function, the second, a classification layer with two nodes and a Sigmoid activation function to compress the two-dimensional output in the probability distribution.
3.3. Data Preprocessing and Feature Extraction
To date, the apparent features for the digital diagnosis of early pneumonia have not still been standardized in the scientific community. Even though numerous studies have proposed various feature selection methods and confirmed their practical benefit [55-58], there are no special techniques that would distinguish early pneumonia from perfectly healthy lungs and lungs with late stage of the disease [10, 11, 42, 59]. Therefore, this study also considers a method for selecting early pneumonia features and interpreting the diagnosis results as a part of the individual approach.
A three-step preprocessing is applied to the input X-ray image to make it more straightforward and detect pneumonia features.
(1) In the first step, the X-ray image is illuminated to increase the brightness. This approach was used since even professional radiologists examine X-ray images under the light. Artificial radiographs can be an effective means of detecting pneumonia features for the classification task. Increasing the brightness is done by parsing each pixel of the image and then increasing their respective values of Red, Green, and Blue (RGB) by an absolute constant.
(2) The second step increases the image's contrast, which is like changing the image's brightness. Increasing the contrast makes the borders in the image more continuous and some areas more noticeable. This technique can be used with the original color scheme, which does not reflect the disease features, yet emphasizes the image's local areas. Increasing the contrast of the image can be obtained by introducing affinity equivalence:
 |
(1) |
where α – contrast level; β – image brightness level; (i, j) – the corresponding pixels' coordinates in the image.
3) The third step is to expand the color scheme by computing the average RGB values for each image. Next, these values are multiplied by the average found to increase the overall values and get a color version of the image. This technique is used to simplify the symptoms of the disease during image classification. The image created in this way allows highlighting the details on the surface so that the classifier can better identify any features and differences from the image with healthy lungs.
Among all the Haralick textural features [60], we choose those that best show pneumonia's manifestations on the processed image. Such features are the square deviation of the mean value of the image (variance), the sum of all mean values in this image, and the sum of all values of variance in the image.
Dispersion
 |
(2) |
The sum of all averages
 |
(3) |
The sum of all variance values
 |
(4) |
Next, we create a classifier in the form of a convolutional neural network with three convolutional layers. This number ensures the efficiency of the classifier on any computing device.
3.4. Visual Analysis Through Discriminative Localization
The CNN performance interpretation is an urgent task, especially in clinical decision-making [27, 44]. DL models have been considered black boxes for a long time; there is still no trust in their forecasts [18, 33]. Simultaneously, understanding the principles of feature detection can help configure and optimize network hyperparameters, identify and understand the cause of model failures, and explain the results to a non-specialist user in solving practical problems. The visual interpretation of DL [41] can be performed with (a) preceding techniques to visualize the separate parts of a network's structure and (b) gradient-based methods that operate gradients through the whole network.
Every trained model focuses on the discriminant parts of the image at the last stage of classification. Class activation maps [61] might be an excellent solution to visualize and debug model predictions and address the interpretation issue. The pooling layer's output is fed to the linearized layer to identify the discriminant ROI, which is explicitly allocated to classify inputs to the appropriate classes.
Let us consider the pooling layer Gm, which spatially averages the Gm-th feature map from the convolutional layer. Meanwhile, the m-th feature map joins the last neuron with the weights wcm, according to the predicted class c. Therefore, the prediction score s on the initial neuron can be represented as the weighted sum of all neurons on the pooling layer:
 |
(5) |
where gm (x, y) denotes the m-th activation feature map on the (x, y) plane, M – total number of class activation maps.
Also, the weighted number of activations from all feature maps relative to the predicted class c on the (x, y) are as follows
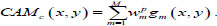 |
(6) |
The value of CAMc (x, y) displays the significance of a feature on each spatial grid (x, y) to classify the input image into the predicted class c. The maps should also be scaled to the input image's size to find the discriminant ROI. This approach can explain the process of forecasting the model and localize the ROI specific to its class.
In this study, we utilized a visualization technique called average-CAM. It represents the class level's ROI, which is considered the most important for correct prediction for all inputs belonging to this class. The average-CAM for class c is calculated by averaging all CAM outputs:
 |
(7) |
where CAMkp (x, y) corresponds to the value of CAM for the k-th image in the class p, K is the total number of images at the pooling layer's output.
Approach (7) can identify the ROI that is characteristic of the predicted class, improve the interpretation of internal representations, and explain model predictions.
3.5. Transfer Learning
In traditional classification problems, the classification model's accuracy and reliability can be guaranteed if there are enough training and testing data from one space of characteristics and unified distribution. At the same time, the model must be retrained with each data change. However, in practice, it has been found that available labeled image samples may not be consistent with the distribution of new test samples. Besides, due to the patient's confidentiality, it is often challenging to obtain labeled medical imaging data. Transfer training might serve an excellent role in addressing the above issues [62]. In this study, we pretrained our three-layer CNN on the recently released benchmark ChestXray14 dataset [42] and utilized its weights for further investigation. This dataset contains 112,120 frontal X-rays of the chest, marked by fourteen chest diseases. Next, the network's trained weights are stored and transferred to the classification of early pneumonia. Experiments have shown that transfer training avoids introducing structured noise and is sufficient for model convergence and improved classification characteristics.
3.6. Evaluation Criteria and Experiment Setup
A small CheXpert dataset [63] was used to test the proposed approach experimentally. The dataset contains 3458 chest radiographs with 320 × 320 pixels obtained from 524 patients. The images are marked with two classes: normal and pneumonia. The entire dataset is divided into train, test, and validation samples, each containing 70%, 20%, and 10% of all images, respectively.
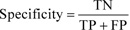
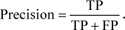
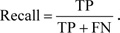
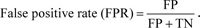
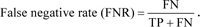
Let us consider the number of real Positive (P) and real Negative (N) cases in the data. As is known, the results of modeling and classification [64, 65] are distributed as True Positive (TP), True Negative (TN), False Positive (FP), and False Negative (FN) cases. In this paper, the performance of targeted neural networks is evaluated by several fundamental statistical indicators defined as
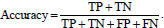 |
(8) |
 |
(9) |
 |
(10) |
 |
(11) |
 |
(12) |
 |
(13) |
We also calculated the area under the curve (AUC) [66] to measure the distinction between normal and pneumonia classes
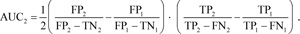 |
(14) |
To train the network, we utilized the Adam optimization [67] with overall 300 epochs. Adam's algorithm serves as an extension of the stochastic gradient descent algorithm, which iteratively updates the neural network weights based on training data. Guided by the results of computational experiments in [68, 69], the training parameters are established as follows: learning rate of 10-5 -10-3, the weight decay of 0.5 10-3, the momentum of 0.85, and the batch size of 512. According to recent studies [70, 71], such a set provides an excellent model's approximation.
At the model's initialization stage, the pretrained weights on the Chest X-ray 14 dataset were transferred to the current CNN model to perform the early pneumonia classification task. While training, the scales with small-batch data are updated, and the batch size is set to 256. When the model's accuracy on the validation set does not increase anymore, the learning rate decreases ten times. The network training finished after reaching 100 iterations.
All experiments were performed on the Windows 10 operating system using the Python v3.7 stack. The proposed architecture was implemented based on TensorFlow v.1.15 [72] and Keras frameworks; hardware – 8-core Ryzen 2700 and one NVIDIA GeForce GTX1080 graphics processor with 8 GB of memory. The code has been open-sourced and available on GitHub via [73].
4. EXPERIMENTS AND RESULTS
This section presents the results of computational experiments and presents a visualization of the proposed model to interpret the results.
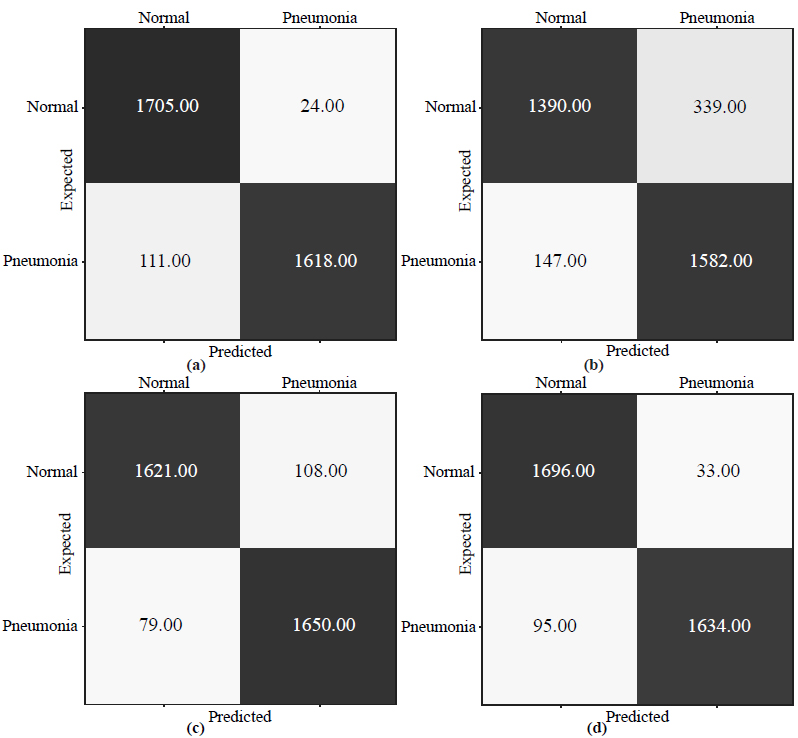
Fig. (5) illustrates confusion matrices obtained by the proposed architecture and state-of-the-art CNNs: VGG19 [45], Inception-V4 [74], and MobileNet_v2 [75].
As shown in Fig. (5a), the VGG19 model achieved 85.9% validation accuracy classifying 1,582 images as pneumonia and 147 images as normal samples for the pneumonia class, and 1390 images as normal and 339 images as pneumonia for the normal class. From Fig. (5b), we may observe that Inception_v4 marked 1650 samples for the pneumonia class correctly and 79 – incorrectly. It also included 1621 normal and 108 pneumonia images to the normal class. According to Fig. (5c), MobileNet_v2 classified 1634 images correctly as pneumonia and 95 incorrectly as normal for the pneumonia class; simultaneously, for the normal class, it correctly predicted 1696 images but erred in 33 samples. Finally, the model based on our architecture correctly marked 1618 images as pneumonia while incorrectly assigned 111 images with healthy lungs to the pneumonia class (Fig. 5d). As for the normal class, 1705 samples were correctly classified as normal and 24 – incorrectly as pneumonia.
Fig. (6) shows the training and validation curves obtained by the proposed architecture.
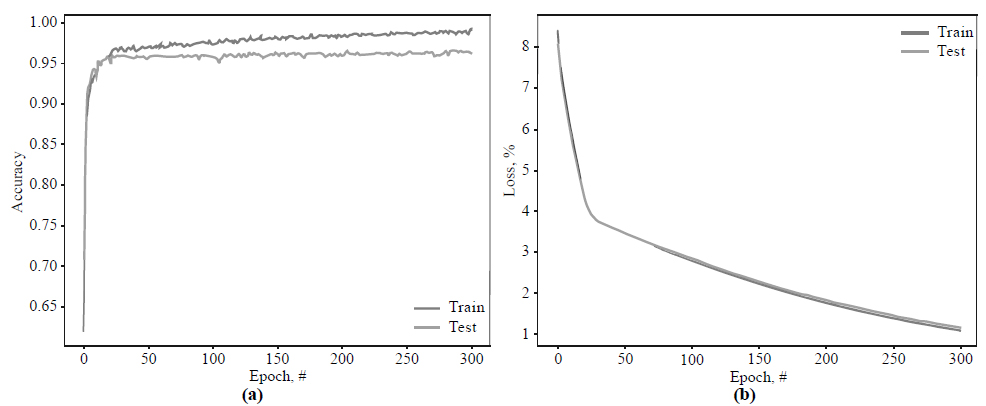
According to Fig. (6a), the training and validation curves increase to 95.5% from epoch 0 to 20. After that, training accuracy slightly increases and eventually reaches 99.1%, while the validation accuracy stops at 96.1%. In Fig. (6b), training and loss validation curves demonstrate excellent convergence. By epoch 25, the loss function's value for both curves slows at 3.98% and then gradually falls to 1.16% in epoch 300.
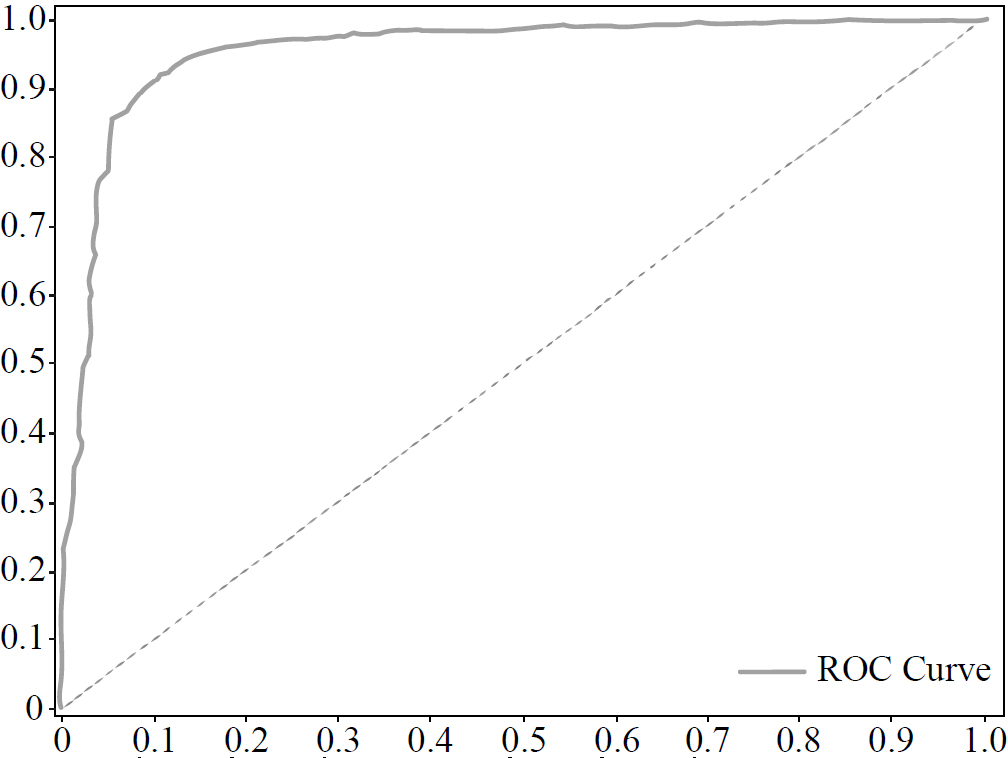
The graph of the ROC curve is shown in Fig. (7).
As from Fig. (7), the AUC score reaches 95.3%. This result shows that our three-layer CNN can provide complete textural feature extraction associated with early pneumonia and accurately determine the ROI in the limited chest X-ray dataset.
Overall, Table 1 contains all predictions obtained by the targeted networks. Moreover, we included training time for each model to estimate their computational efficiency.
Table 2 compares four investigated convolutional architectures by the statistical indicators (8)–(14).
| Architecture | TP | TN | FN | FP | Time, h |
|---|---|---|---|---|---|
| VGG19 [45] | 1390 | 1582 | 147 | 339 | 5.11 |
| Inception_v4 [74] | 1621 | 1650 | 79 | 108 | 5.21 |
| MobileNet_v2 [75] | 1696 | 1634 | 95 | 33 | 6.17 |
| The proposed architecture | 1705 | 1618 | 111 | 24 | 4.62 |
| Architecture | Accuracy | Specificity | Precision | Recall | FPR | FNR | AUC |
|---|---|---|---|---|---|---|---|
| VGG19 | 0.859 | 0.824 | 0.804 | 0.904 | 0.176 | 0.096 | 0.951 |
| Inception_v4 | 0.946 | 0.939 | 0.938 | 0.954 | 0.061 | 0.046 | 0.843 |
| MobileNet_v2 | 0.963 | 0.980 | 0.981 | 0.947 | 0.020 | 0.053 | 0.939 |
| The proposed architecture | 0.961 | 0.985 | 0.986 | 0.939 | 0.015 | 0.061 | 0.953 |
As we see from Figs. (6 and 7) and Table 2, the learning and validation accuracy curves gradually increase to the point of stability and reach a maximum of 300 epochs. It should be noted that the VGG19 model shows significantly worse performance (85.9%) compared to other investigated networks. Their training and validation curves begin to be stable starting from epoch 20, and validation accuracy stops at 94.6% for Inception_v4, 96.3% for MobileNet_v2, and 96.1% for the proposed architecture.
It is also noteworthy that the proposed three-layer architecture demonstrates good convergence of the training and validation curves, which may indicate a low level of over-fitting of the model and, consequently, reliable and practical implementation. Moreover, our approach shows relatively low type I and type II errors, with 1.5% and 6.1%, respectively. Therefore, according to all statistical indicators (Table 2), the model based on the proposed architecture, schematically depicted in Fig. (4), achieves high and robust performance efficiency and can be further implemented for practical tasks.
Next, we evaluated the proposed model's effectiveness in detecting pneumonia-affected parts of the lungs using heat maps.
5. DISCUSSION
This section provides a systematic analysis of the proposed approach against other recognized CNNs based on the previous section's experimental results. It also describes the features of the approach in terms of interpreting the results of diagnosing early pneumonia.
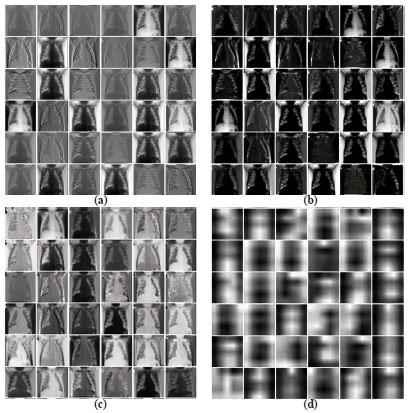
First, Fig. (8) demonstrates the feature maps constructed by different parts of our CNN model.
Fig. (8a) presents a visualization of the original feature maps of the best model's first convolutional layer. It can be seen from the figure that the convolutional layer reveals the edges, and their various properties cover the leading edges of the forms. Fig. (8b) also shows a partial feature map of the pooling layer. Furthermore, Fig. (8c) presents the partial output of the first dense layer (Fig. 5), while Fig. (8d) visualizes the last classification layer's output.
According to the indicators in Table 2, we may see that the VGG19, Inception_v4, and MobileNet_v2 generally performed worse compared to our network. Given the problem of classifying images with poorly expressed pneumonia features, we assume that multilayer architectures lose spatial features on the last convolutional layer, limiting the model's classification characteristics. On the other hand, the small number of layers of our network makes it possible to preserve and pass through all convoluted layers, such weak features of early pneumonia as darkening of one or more parts of the lung or darkening within one segment of the lung. In particular, the proposed filter designs based on the dilated convolutions ensure the expansion of the neuron's receptive field, thus capturing additional vital pneumonia features.
The use of transfer training has reduced the negative impact of introducing structured noise on the model's performance. Instead, initializing the model with mastered scales from the Chest X-ray 14 dataset significantly accelerated its convergence. Other modifications of the approach are also noteworthy, such as image preprocessing, highlighting essential Haralick features, selecting the activation function and the loss function, and adjusting the target's optimal hyper-parameters. Thus, the proposed model of deep learning has the following contribution against other methods: A cross-cutting model of CNN with dilated convolutional operations for the classification of pneumonia in the early stages is proposed. The model effectively addresses the issue of low resolution, partial occlusion, or blockage of the inflammatory area of chest X-rays.
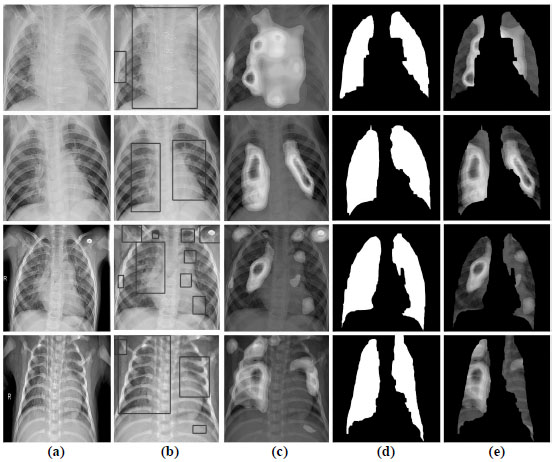
Because the configured CNN, Fig. (4) contains pooling layers in its topology, it is compatible with the CAM visualization method. Fig. (9) shows the visual results of the CAM in localization of the area on the radiograph with the most prominent pneumonia features.
The approach to the interpretation of the work of CNN is as follows. The model receives X-rays from the training dataset and decodes predictions about the features of the disease. The CAMs generate heat maps in two-dimensional evaluation grids, calculated for each input pixel location. Those pixels with a high value relative to the predicted class have a bright red color with clear color transitions for different ranges. After that, the formed heat maps are applied to the input X-rays to visualize the ROI with the most probable pneumonia features. Then, with the help of an algorithm for detecting boundaries, lung masks are formed. These masks describe the contours of the lungs on radiographs to remove the localized area with features.
Given the visualization results in Fig. (8), we see that the network's convolutional layer absorbs the image's fuzzy contours. These patterns are abstracted as they pass through successive convolutional layers until the last layer describes the lungs' characteristics. Heat maps in Fig. (8) demonstrate that the proposed CNN assimilates features that strongly correlate with the class of pneumonia, and with high accuracy, identifies areas of interest with inflammation. Simultaneously, our CNN architecture is based on the residual network by the dilated convolution's internal structure. This approach can provide high image plane resolution and competitive classification accuracy through weight assimilation and hyperparameter adjustment.
CONCLUSION
The current study investigates an early diagnosis of pneumonia based on deep learning methods. We propose an approach to identify mild pneumonia in the X-ray images and interpret classification results with a CNN. The feature extractor here is a modified CNN architecture, consisting of three convolutional layers with ReLU activation functions after each layer, followed by an averaged pooling layer and two dense layers. A dilated convolution with different sizes was employed to detect and analyze visual deviations on the radiograph in convolutional layers to preserve the radiograph's receptive fields' spatial features. The network was trained with an Adam optimizer to minimize the cross-entropy loss function. The proposed architecture provides minimal losses of objects' spatial information due to dilated operations while ensuring low computational costs.
Our approach involves utilizing transfer training to overcome the lack of data in early pneumonia. The investigated CNN achieves high classification rates on the CheXpert dataset, relevant to state-of-the-art neural networks, and demonstrates significant computational efficiency, surpassing other models. Moreover, we applied a visual strategy based on class activation maps to explain the classification outcome, critical for clinical decision making. The formed class activation maps provide discriminatory localization of abnormal zones in radiographs that can help diagnose weakly expressed early pneumonia features. According to the simulation results, the proposed CNN architecture may be a promising solution for instant diagnosis in the first suspicion of early pneumonia.
Further, research will focus on applying optimization methods to fine-tune our architecture and, therefore, improve clinical measurements. Besides, the authors plan to expand the network's use for the analysis of computed tomography images.
LIST OF ABBREVIATIONS
| ACC | = Accuracy of Classification |
| ADT | = Automated Diagnostic Tools |
| AI | = Artificial Intelligence |
| AUC | = Area Under the Curve |
| CAM | = Class Activation Map |
| COVID-19 | = Coronavirus Disease 2019 |
| CNN | = Convolutional Neural Network |
| CV | = Computer Vision |
| DL | = Deep Learning |
| FPR | = False Positive Rate |
| FNR | = False Negative Rate |
| ML | = Machine Learning |
| RGB | = Red, Green, and Blue |
| ReLU | = Rectified Linear Unit |
| ROI | = Region of Interest |
| SVM | = Support Vector Machine |
| TP | = True Positive Cases |
| TN | = True Negative Cases |
| FP | = False Positive Cases |
| FN | = False Negative Cases |
| WHO | = World Health Organization |
ETHICS APPROVAL AND CONSENT TO PARTICIPATE
Not applicable.
HUMAN AND ANIMAL RIGHTS
No animals/humans were used for studies that are the basis of this research.
CONSENT FOR PUBLICATION
Not applicable.
AVAILABILITY OF DATA AND MATERIALS
The data supporting the findings of the article is available in the [GitHub Repository] at [https://github.com/soolstafir /An-Early-Diagnosis-of-Pneumonia-on-Individual-Radiographs], reference number [49].
FUNDING
None.
CONFLICT OF INTEREST
The authors declare no conflict of interest, financial or otherwise.
ACKNOWLEDGEMENTS
Declared none.

