
Ancestral Area Reconstruction of SARS-CoV-2 Indicates Multiple Sources of Entry into Australia
Authors Info & Affiliations
Abstract
Background:
The ongoing COVID-19 pandemic is caused by severe acute respiratory syndrome coronavirus 2 (SARS-CoV-2). International travels to Australia during the early stages of the pandemic prior to border closure provided avenues for this virus to spread into Australia. Studies of SARS-CoV-2 biogeographical distribution can contribute to the understanding of the viral original sources to Australia.
Objective:
This study aimed to investigate the clonality and ancestral sources of Australian SARS-CoV-2 isolates using phylogenetic methods.
Methods:
We retrieved 1,346 complete genomes from Australia along with 153 genomes from other countries from the GISAID and NCBI nucleotide databases as of the 14th May 2020. A representative dataset of 270 Australian and international sequences were resulted from performance of nucleotide redundancy reduction by CD-HIT. We then constructed a median-joining network by Network 10.1.0.0, and phylogenies by IQ-Tree, BEAST and FastTree. The Bayesian statistical dispersal-vicariance analysis (S-DIVA) and Bayesian interference for discrete areas (BayArea) built in RASP were used to reconstruct ancestral ranges over the phylogenetic trees.
Results:
Two major clusters, from Europe and from Asia, were observed on the network of 183 haplotypes with distinct nucleotide variations. Analysis of ancestral area reconstruction over the phylogenies indicated most Australian SARS-CoV-2 sequences were disseminated from Europe and East Asia-Southeast Asia.
Conclusion:
The finding is genetic evidence for the geographic origins of the Australian SARS-CoV-2 sequences. Most Australian sequences were genetically similar to those from Europe and East Asia-Southeast Asia, which were also suggested as two main sources of introduction of SARS-CoV-2 to Australia.
1. INTRODUCTION
Infections caused by the novel severe acute respiratory syndrome coronavirus 2 (SARS-CoV-2), the causative agent of coronavirus disease 2019 (COVID-19), were first reported in Wuhan, China in December 2019 [1, 2]. In January 2020, outbreaks of COVID-19 were reported outside China, initially in East and Southeast Asia, and then in the USA and Europe before spreading to Australia [1, 2]. The World Health Organisation (WHO) declared COVID-19 a pandemic on the 11th March 2020. As of the 11th March 2021, over 117 million people have been diagnosed as infected worldwide with over 2.6 million deaths [3].
SARS-CoV-2 belongs to the same family, Coronaviridae, and genus, Betacoronavirus, as severe acute respiratory syndrome (SARS) and Middle East respiratory syndrome (MERS) coronaviruses [4]. SARS-CoV-2 is an enveloped single-stranded RNA virus with >29kb genome, which share 75-80% genetic similarity to SARS-CoV [5] and 96.2% to the bat coronavirus GISAID_EPI_ISL_402131, which was isolated from Yunnan in China [6]. The virus shares a similar genomic organisation to other coronaviruses, including short untranslated regions at both ends and five open reading frames (ORFs) encoding replicase polyproteins (ORF1ab), spike (S), envelope (E), membrane (M) and nucleocapsid (N) proteins [7, 8]. People infected with SARS-CoV-2 can have mild symptoms such as fever, cough, sore throat, muscle pain or fatigue, or more severe symptoms such as acute respiratory distress syndrome and shortness of breath [2, 9, 10]. Other symptoms such as shock, diarrhea, and loss of smell/taste have also been reported [2, 9, 10]. The virus is contagious [11] and can be transmitted from human to human via close contact, small droplets or exposure to infected surfaces [4].
The first four cases in Australia were confirmed on the 25th January 2020, one in the state of Victoria (VIC) and three in the state of New South Wales (NSW) [12]. Australia activated a national COVID-19 emergency plan on the 29th February 2020 [13]. At the height of SARS-CoV-2 outbreak in Australia, an approximate doubling of cases was confirmed every 3 days, rising from under 200 cases on the 13th March 2020 to over 2,000 cases on the 27th March 2020 [12, 13]. Overseas acquired cases were more than two times higher than locally acquired cases prior to the closure of Australian borders to all non-citizens and non-residents on the 20th March 2020 [12]. As from 25th June 2020, Australia recorded 7,558 cases and 104 deaths, including 608 cases from Western Australia (WA), 29 from Northern Territory (NT), 1,066 from Queensland (QLD), 3,162 from NSW, 108 from Capital Territory, 440 from South Australia, 1,917 from VIC and 228 from Tasmania [14].
Studies of SARS-CoV-2 biogeographical distribution can contribute to the understanding of the viral original sources and give an insight to its evolutionary history on a phylogenetic tree. The Bayesian statistical dispersal-vicariance analysis (S-DIVA) and Bayesian interference for discrete areas (BayArea) are two commonly used methods for interference of biogeographical histories. S-DIVA is an event-based method that ignores branch lengths and reconstructs ancestral distribution based on a cost matrix of dispersal, vicariance and extinction events under generalised parsimony approaches [15]. In S-DIVA, a dispersal event incurs a cost of one when an area is included to an ancestral range. A cost of zero is applied when an ancestor shares the same area with its direct descendants or when speciation happens by vicariance. Higher cost may be incurred, and the rule of incurring costs is more complicated when multiple areas are involved in ancestral range [15]. Differing from S-DIVA, BayArea is a model-based method of inferring phylogenetic biogeography through a matrix of instantaneous rate of change within a set of discrete geographic areas [16, 17]. Moreover, BayArea accepts trees with polytomies while at least one binary tree has to be included for S-DIVA analysis. This study used a phylogenetic approach to assess the clonality and ancestry of SARS-CoV-2 isolates in Australia and to determine potential sources of dissemination of this virus, through ancestral reconstruction using S-DIVA and BayArea.
2. MATERIALS AND METHODS
2.1. Sequence Dataset Collection and Preparation
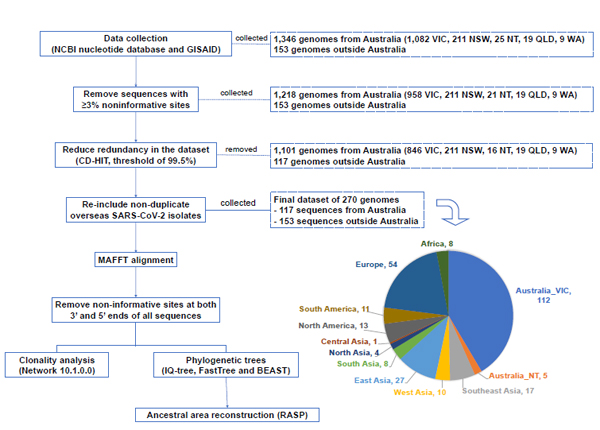
All human SARS-CoV-2 complete genomes from Australia were retrieved from the NCBI nucleotide database and Global Initiative On Sharing All Influenza Data (GISAID) as available on 14th May 2020. In addition, one to fourteen SARS-CoV-2 complete genomes were randomly selected per country or region outside Australia, from either GISAID or NCBI nucleotide database, to represent overseas SARS-CoV-2 cases. The first sequenced SARS-CoV-2 isolate, NC_045512_China/Wuhan (NCBI) was included as a reference sequence and dated 2019-12-20 according to the patient’s onset of disease [18]. Duplicate identification or accession numbers were removed from the analysis. We performed manual curation of the dataset and removed 128 sequences having ≥3% of unassigned or ambiguous nucleotides over their entire genomes. CD-HIT EST [19, 20] was used to cluster nucleotide sequences of ≥ 99.5% similarity. As CD-HIT only retained one representative sequence from each cluster, regardless of the country of origin of the sequence, many of the international sequences would have been discarded. Therefore, we re-included SARS-CoV-2 genomes originating outside Australia that were removed by CD-HIT, in order to have at least a representative sequence for each nation even if they could technically be represented by another sequence. This resulted in a final dataset of 117 representative sequences from Australia and 153 representative sequences internationally.
The collected sequences were then aligned using MAFFT 2.1.11 [21, 22]. Misalignments were manually edited and regions with high numbers of Ns and ambiguous nucleotides were trimmed out. The latter regions predominantly occurred within the 3’- and 5’- untranslated regions, corresponding to nucleotide positions start->55 and 29837->end of the reference sequence NC_045512_China/Wuhan|2019-12-20.
2.2. Clonality Analysis by Network Map
For clonality analysis, a variable dataset, in which gaps were not considered and invariable sites were removed, was generated from the DNA alignment of 270 sequences by DNAsp 6 [23]. A Median-Joining (MJ) network was then built using Network 10.1.0.0 [24, 25] (fluxus-engineering.com) with default weights at 10, connection cost for distance calculation, and an epsilon value of 10.
2.3. Ancestral Reconstruction Phylogeny Analysis
Approximated maximum-likelihood (ML) trees were built using FastTree 2.1.11 [26, 27] and IQ-tree 1.6.12 [28]. For FastTree, a default setting was used with 20 rate categories of sites. For IQ-tree, ModelFinder [29] tested 286 DNA models and selected the substitution model GTR+F+R3 as the best-fit model under Bayesian information criterion (BIC) to compute a consensus ML tree from 1000 ultrafast bootstrap replicates [30]. For additional comparison, we performed Bayesian analysis of molecular sequences under a Markov Chain Monte Carlo (MCMC) method using BEAST 1.10.4 [31] with uncorrelated relaxed clock, GRT substitution model, empirical base frequencies, heterogeneity model of 4 gamma categories and an assumption of constant population size. TreeAnnotator 1.10.4 [32] was used to generate a target Maximum Clade Credibility (MCC) tree summarised from sampled posterior trees produced by BEAST with the first 1,000 tree samples discarded as burn-in.
For all analyses, the trees were rooted to the reference NC_045512_China/Wuhan|2019-12-20. The distribution range of SARS-CoV-2 isolates was assigned into eleven areas as per their country of origin: (A) Australia, (B) Southeast Asia, (C) West Asia, (D) East Asia, (E) South Asia, (F) North Asia, (G) North America, (H) South America, (I) Central Asia, (J) Europe, and (K) Africa. We applied S-DIVA [33] implemented within RASP [34] to the binary trees generated by IQ-tree and BEAST to obtain possible ancestral ranges at each node with averaged costs for dispersals between areas. The number of maximum areas was set to 4 as default. We used the BayArea method [16] within RASP to infer phylogenetic biogeography for the non-binary tree given by FastTree. Posterior probabilities of ancestral states were estimated at nodes on the FastTree phylogeny. The constructed ancestors on the phylogenies were compared in terms of the degree of congruence between the different trees and models. Where similar trees were obtained and to allow for better visualisation, a condensed version of a tree was created with reconstructed ancestral ranges using by using interactive Tree of Life (iTOL) [35].
3. RESULTS
3.1. Sequence Dataset Collection and Preparation
Of the 1,499 human SARS-CoV-2 complete genomes initially collected from GISAID and NCBI nucleotide databases (Table S1), we obtained 1,218 genomes isolated within Australia and 153 genomes outside Australia (Fig. 1) after removing 128 sequences having ≥3% noninformative sites – 124 from the state of VIC, Australia and four from the NT, Australia. By clustering sequences with a nucleotide sequence identity of 99.5% and selecting a representative sequence for each cluster, CD-HIT excluded 1,101 SARS-CoV-2 sequences from Australia from 5 states/territories, and 117 genomes outside Australia, which were then manually re-included, finalising 270 genomes for downstream analysis (Fig. 1). The sequence MT121215_China|2020-02-02 was representative of the largest cluster of 844 sequences, 702 of which were from Australia – 211 from NSW, 457 from VIC, 19 from QLD, 9 from WA and 6 from NT. The hCoV-19/Australia/VIC683/2020|EPI_ISL_426978|2020-03-29 and hCoV-19/Australia/NT30/2020|EPI_ISL_430633|2020 sequences were representative of two Australian clusters of 158 and 104 SARS-CoV-2 genomes, respectively. The other sequences selected by CD-HIT represented smaller groups of 24 or fewer genomes. The clusters and representative sequences generated by CD-HIT redundancy reduction at a threshold of 99.5% nucleotide similarity was summarised in Table S2.
3.2. Clonality Analysis by Network Map
The phylogenetic network of the 270 SARS-CoV-2 sequences from Australia and overseas revealed two obvious clusters (Fig. 2), implying two main groups of SARS-CoV-2 isolates circulating in Australia. The majority of the Australian isolates were clustered with those from Europe, with the second cluster primarily from Asia, especially East Asia, as well as partly from North America. Smaller groups of Australian SARS-CoV-2 sequences were genetically more similar to isolates from North and South America. These clusters of SARS-Cov-2 sequences with origins from different regions suggest that Australia and Europe / Asia / North America had transmissions from the same sources at the same time. When examining distal nodes, further diversification of Australian isolates, that appears to have occurred subsequent to the main clusters, highlights evidence of local transmission within Australia. Taken all together, these findings suggest that SARS-CoV-2 isolates in Australia are multiclonal.
3.3. Ancestral Reconstruction Phylogeny Analysis
Reconstruction of ancestral area distribution based on ML and MCC trees allowed us to trace the most recent common ancestor of all lineages and to understand the biogeographic relationships among SARS-CoV-2 isolates. Dispersal routes from different (sub)continents to Australia were identified by S-DIVA using estimated costs (for IQ-tree and BEAST), where the cost of dispersal (the movement of a viral species across a geographical barrier to a new environment) is greater than vicariance (the diversification of a viral species within a geographical area) [15, 36]. The greater the cost, the more support for a dispersal route (Table 1). The data also indicated dissemination of SARS-CoV-2 isolates from Australia to other countries (Table S1), particularly to Europe and Africa, the investigation of which is not within the scope of the study. The S-DIVA analysis showed the disseminations of SARS-CoV-2 between Australia (A) and Europe (J) occurred the most frequently, demonstrated by the highest costs for these routes (Tables 1 and S1). Like the analysis of SARS-CoV-2 network map, the ancestral area reconstructions showed several clusters of Australian isolates themselves along the MCC and ML trees, implying the occurrence of local transmission events in this country.

| Phylogeny (method) |
On IQ-tree phylogeny (S-DIVA)** |
On BEAST phylogeny (S-DIVA)** |
On FastTree phylogeny (BayArea) |
|---|---|---|---|
| Dispersal route to Australia | B->A:1.5 C->A:2.5 D->A:1.666667 E->A:1 G->A:1.5 H->A:0.5 J->A:14.33333 |
B->A:0.5 C->A:1.5 D->A:2 H->A:1 J->A:12 |
B->A C->A D->A E->A F->A G->A H->A J->A K->A |
| Cost of dispersals to Australia | 23 | 17 | N/A |
| Cost of all dispersals identified over the tree | 122 | 123 | N/A |
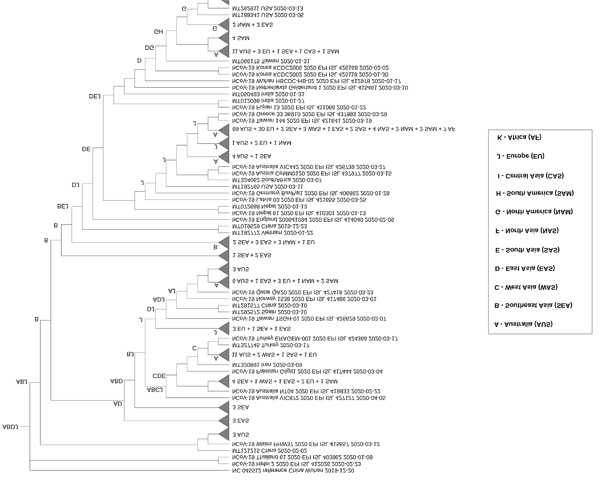
For the IQ-tree phylogeny, all lineages converged to the node ABDJ, indicating that Southeast Asia, East Asia and Europe were most likely common ancestors of SARS-CoV-2 isolates in Australia (Figs. 3 and S1). In addition to ABDJ, Europe (J) or regions including Europe as part of ancestral ranges such as DJ, CJ, or GJ, followed by East Asia (D), had sequences more closely related to the majority of Australian isolates, suggesting those areas as potential sources of SARS-CoV-2 dissemination into the country. West Asia (C), North America (G), South Asia (E) and South America (H) were also observed in internal ancestral nodes for a number of Australian sequences, although to a lesser extent. Similarly, the S-DIVA analysis on BEAST tree (Fig. S2) suggests that the region that combined Southeast Asia and East Asia (BD) was the most likely common ancestor for all lineages. Meanwhile, ancestral ranges of Europe (J), East Asia (D) and/or West Asia (C) were located more proximally to most Australian clusters, indicating these regions were additional minor sources of viral entry to Australia. We used BayArea analysis to reconstruct ancestral ranges on the FastTree phylogeny (Fig. S3). The finding was consistent with the previous analyses from IQ-tree and BEAST trees, except for a greater range of geographic locations with the addition of Africa (K), North Asia (F) as minor sources of viral dissemination to Australia (Fig. S3 and Table 1).
4. DISCUSSION
Our phylogenetic study investigated the clonality of Australian SARS-CoV-2 isolates, up to the 14th March 2020, in a local and international context. The network analysis of 270 sequences representative of 1,499 SARS-CoV-2 complete genomes from both Australia and internationally indicates viral multiclonality in Australia. Specifically, we found two main clusters of Australian SARS-CoV-2 isolates: one cluster aligned mainly with isolates from Europe, while a second cluster aligned primarily with isolates from Asia, particularly East Asia. Minor clusters were aligned with those from the Americas. The finding is supported by the observation of two main ancestral ranges (BD/ABDJ and J) identified over our three ML and MCC trees. This differs somewhat to a study by Foster et al. (2020) [37] in which 160 SARS-CoV-2 complete genomes sampled worldwide were analysed through its phylogenetic network. This study identified three main clusters from Europe, the Americas and East Asia, distinguished by amino acid variations. We found most Australian sequences aligned with those from Asia and Europe, and very few sequences aligned with those from the Americas. This difference could be explained by the effectiveness of public health interventions in Australia [38] such as border closure on the 20th March 2020 [12] or enforced quarantine on the 28th March 2020 [39] before the number of confirmed cases in the United States started to accumulate exponentially from late March 2020 [40].
Similarly, a study by Yu et al. (2020) [41] categorised SARS-CoV-2 isolates from Australia into three groups (B, C and D) clustering with sequences mainly from China, Europe and the United States. In our study, the Americas was observed as a minor source of viral dissemination. This may be due to differences in the methods utilised and the number of Australian SARS-CoV-2 sequences used in our study compared to the study by Yu et al. (2020) [41]. The study of Yu et al. (2020). focused on the evolutionary history of SARS-CoV-2 in China and worldwide [41] instead of transmission patterns into Australia [41], and included only six Australian sequences to represent all Australian cases.
The analysis of ancestral reconstructions at internal nodes from the trees identified five (sub)continents as ancestral areas or points of dissemination from which SARS-CoV-2 spread to Australia: Southeast Asia (B), West Asia (C), East Asia (D), South America (H), and Europe (J). Meanwhile, the analyses of the ML and MCC trees conducted here were all congruent in identifying Southeast and East Asia (BD) as the most common recent ancestors of all lineages, ABDJ for the IQ-tree phylogeny and BD for the FastTree and BEAST trees. The majority of the sampled Australian SARS-CoV-2 isolates were descendants of those originating from Europe (i.e. J, CJ, GJ or DJ). This is concurrent with findings from a phylodynamic analysis by Seemann et al. (2020) [38] that showed Asia and Europe as two of three main sources for the clusters of returning Victorian travellers. Furthermore, the finding on IQ-tree and FastTree trees identified dispersal events from North America (G) and South Asia (E) to Australia while FastTree proposed additional dispersal routes from North Asia (F) and Africa (K). Based on the evolutionary relationships among SARS-CoV-2 isolates from different countries and event routes at reconstructed ancestral nodes, we proposed three main routes for SARS-CoV-2 dissemination into Australia: (1) viruses dispersed directly from East Asia and/or Southeast Asia to Australia (2) viruses dispersed to several geographic locations mostly within Europe before entering to Australia, (3) viruses dispersed to several geographic locations mostly outside Europe before entering to Australia.
Nextstrain reported five distinct clades of SARS-CoV-2, namely 19A, 19B, 20A, 20B and 20C [42, 43]. 20A, 20B and 20C were more frequent in Europe and South America [44] while 19A and 19B were more frequently observed in Asia [43]. However, the geographical distribution of the viral clades is approximate, depending on sampling and reporting systems, number of infected cases, application of travel restrictions and different public health responses among countries worldwide. As observed on Nextstrain, all five clades with greater numbers of clades 19B and 20C, were present in Australia during the first five months of the pandemic, followed by an increase in cases of clade 20 B in NSW and VIC from April 2020 [45]. Regarding viral transmissions into Australia on Nextstrain, SARS-CoV-2 were mostly disseminated from Asia, then Europe during the early stage of the pandemic with additional sources from America and Africa subsequently [45]. The observation on Nextstrain is generally congruent with the findings from our study during the early stage of the pandemic. The two main clusters observed through our network analysis could correspond to clades 19B and 20C found on Nextstrain, with generally similar observed dissemination routes mainly from Asia and Europe.
Community transmission was also demonstrated by the clusters of Australian sequences along the constructed phylogenies in this study. However, no relevant demographic information of the SARS-CoV-2 isolates other than their country of origin was available on GISAID and NCBI, their social risks of transmission for these cases are unknown. Meanwhile, the findings of Seeman et al. (2020) provided genomic evidence of local transmission which was highly associated with social gatherings [38].
We recognise that our study has limitations. The process of sequence retrieval, data curation and clustering resulted in 117 Australian isolates - 112 Australian from VIC and 5 from NT, compared to 1,346 sequences initially collected. This means all sequences from the other Australian states than VIC and NT were removed because of being clustered with representative local and overseas sequences in our dataset (Fig. 1) meanwhile these isolates represented independent introductions. This may overestimate or underestimate the importance of certain routes of SARS-CoV-2 dissemination to Australia and does not give a representation of community transmission within Australia. For instance, there were fewer Australian isolates clustered with lineages dispersed from East/South East Asia than there were from Europe. This is likely due to the removal of all isolates from NSW, QLD and WA, 457 from VIC and 6 from NT, totalling over Australian 700 viral sequences from our initial dataset by CD-HIT clustering, with these sequences represented by MT121215_China|2020-02-02 from East Asia. Likewise, most of the sampled Australian SARS-CoV-2 isolates were from the state of VIC and no travel history data could be collected for these isolates. Therefore, this limits the ability to confirm the findings and determine possible interstate transmission of SARS-CoV-2 within Australia.
Although some studies on the transmission of SARS-CoV-2 in Australia have been conducted, the understanding of viral introduction into and between different Australian states is not well understood. A study on local transmission of SARS-CoV-2 in Australia identified 28% of 209 NSW isolates collected from 21st January to 28th March 2020 were from locally acquired infections, 18.6% of these were from household contacts [46]. The study also observed multiple overseas importations of the virus into NSW, from the same regions we identified in our study [46]. According to a study by Seeman et al. (2020), 61% of infected cases in VIC from 6th January to 14th April 2020 were acquired overseas [38]. Moreover, over 50% of locally acquired cases were reported to be associated with multiple SARS-CoV-2 introductions by these travellers [38].
CONCLUSION
In conclusion, this investigation contributes to our understanding of multiple clonality and dissemination of SARS-CoV-2 isolates circulating in Australia. We highlighted a number of geographic areas from which SARS-CoV-2 viruses circulating in Australia originated, with at least two major dispersals into this country. Using network and phylogenetic analysis, we demonstrate that at least two types of the same sources appear to be circulating within Australia, confirming the multiclonality of Australian SARS-CoV-2 isolates. We demonstrate that Europe (J) and East Asia-Southeast Asia (BD) appear to be the main geographical regions of dissemination into Australia, while confirming East and South-East Asian isolates as the most common recent ancestor to all circulating worldwide. The finding is considered genetic support for strict deferrals and restrictions to donors with recent travel or exposure history to minimise risk to the blood supply, although SARS-CoV-2 has not been known as transfusion transmissible.
ETHICS APPROVAL AND CONSENT TO PARTICIPATE
Not applicable.
HUMAN AND ANIMAL RIGHTS
No animals/humans were used in the study that is the basis of this research.
CONSENT FOR PUBLICATION
Not applicable.
AVAILABILITY OF DATA AND MATERIALS
The SARS-CoV-2 sequences used in this study are available in the GISAID and NCBI nucleotide databases (https://www.gisaid.org/ and https://www.ncbi.nlm.nih.gov /sars-cov-2/).
CONFLICT OF INTEREST
The authors declare no conflict of interest, financial or otherwise.
FUNDING
None.
ACKNOWLEDGEMENTS
We acknowledge Queensland University of Technology for granting to N. M. H. P. Australian Government Research Training Program (RTP) Stipend (International) and QUT HDR Tuition Fee Sponsorship for her Doctor of Philosophy degree. The authors gratefully acknowledge Aoibhe Mulcahy for her advice on using iTOL to condense phylogenies.
SUPPLEMENTARY MATERIAL
Supplementary material is available on the publisher’s website along with the published article.

